💜 B2VB Submission Tracker: bit.ly/496vP13
🏠 Explore all our B2VB tips here: bit.ly/3YMsrGR
🩵 Tag our team: Eric Balash, Shreya Arya, Victory Omovrah
30.07.2025 06:49 — 👍 0 🔁 0 💬 0 📌 0
data.world
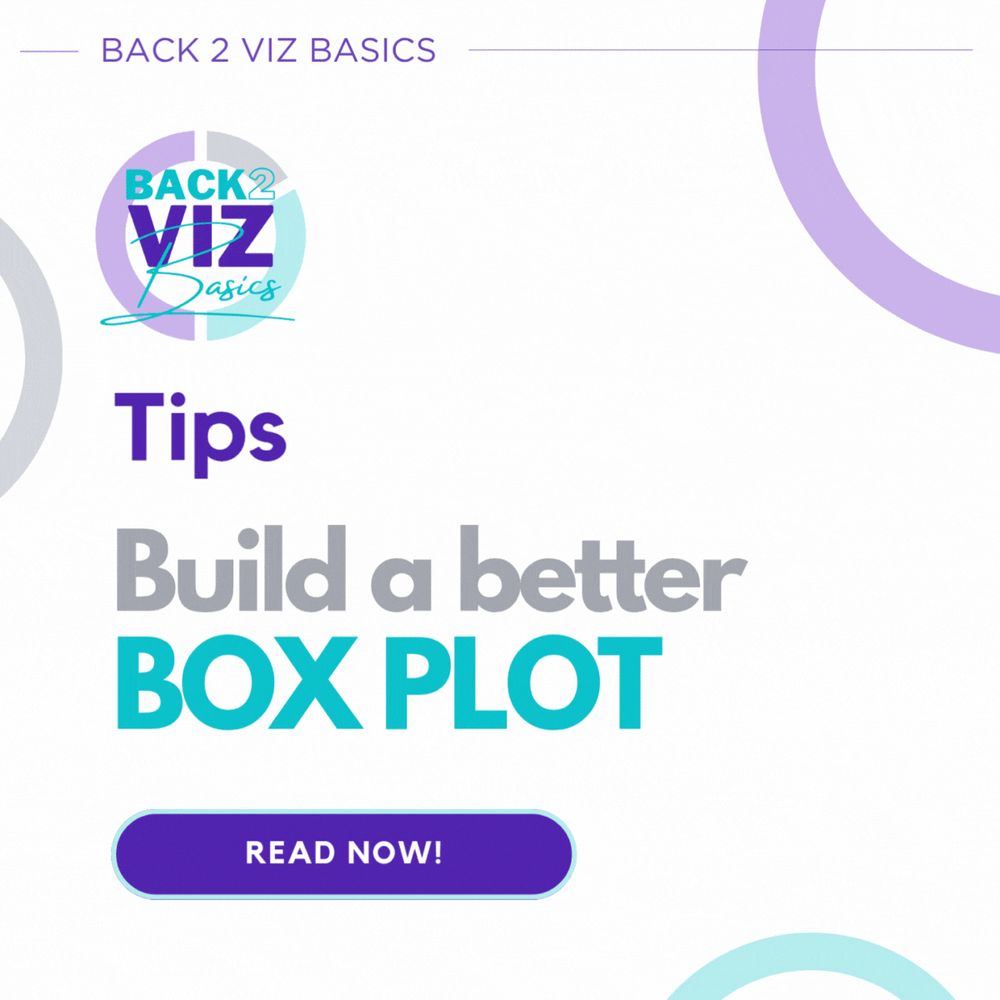
Last week’s challenge was to build a box plot, visualising data on Starbucks Matcha drinks 🍵🌿
Data Prompt: bit.ly/4nImvc1
Parameter tips will be out for this week’s challenge soon, so keep an eye out for those too! 👀✨
30.07.2025 06:49 — 👍 0 🔁 0 💬 1 📌 0
📌 New here or catching up? You can join any of our #B2VB challenges at any time!😊
I didn’t get a chance to share the tips last week, so here are 11 TIPS to help you get started with Box Plots! 💜
Tips: datavizfairy.co.uk/b2vb-tips/bu...
#tableau #datafam #dataviz #boxplot #chart #tips
30.07.2025 06:17 — 👍 0 🔁 0 💬 1 📌 0
💜 B2VB Submission Tracker: bit.ly/496vP13
🏠 Explore all our B2VB tips here: bit.ly/3YMsrGR
02.07.2025 15:05 — 👍 0 🔁 0 💬 0 📌 0
This week, we're looking into the most expensive sports team sales in history!
From basketball to baseball and football... practice using annotations to tell a story behind these numbers 🏀⚾⚽
Data Prompt: bit.ly/3G5BT17
02.07.2025 15:05 — 👍 0 🔁 0 💬 1 📌 0

Annotations are great at highlighting key insights and providing context in data visualisations. Here are 9 TIPS to help you get started! 💜
Tips: bit.ly/4knU6Fh
#b2vb #tableau #datafam #dataviz #tips
02.07.2025 15:05 — 👍 1 🔁 0 💬 1 📌 0
🏳️🌈 Data Prompt: bit.ly/3T8Ec68
💜 B2VB Submission Tracker: bit.ly/496vP13
🏠 Explore all our B2VB tips here: bit.ly/3YMsrGR
11.06.2025 11:54 — 👍 1 🔁 0 💬 0 📌 0
June is #Pride month, and we've teamed up with the DataPride TUG this week to help you practice building Gantt charts! 🌈✨ Here are 11 TIPS to help you get started! 💜
Tips: bit.ly/4dVbkYJ
#b2vb #datapride #datafam #tableau #powerbi #flourish #gantt #schedule #planning #tips #design
11.06.2025 11:54 — 👍 2 🔁 0 💬 1 📌 0
💜 B2VB Submission Tracker: bit.ly/496vP13
🏠 Explore all our B2VB tips here: bit.ly/3YMsrGR
🩵 My B2VB co-leads: @ericbalash.bsky.social, Victory Omovrah
21.05.2025 11:29 — 👍 1 🔁 0 💬 0 📌 0
Take a look at poll data showing how AANHPI adults in the U.S. feel about key policy issues – including healthcare, housing, childcare, crime, and environmental protection – and create a percent-of-total chart to visualise their priorities. 📊
Data Prompt: bit.ly/4dl93pw
21.05.2025 11:29 — 👍 1 🔁 0 💬 1 📌 0
This week, we're celebrating Asian American, Native Hawaiian, and Pacific Islander (AANHPI) Heritage Month with #B2VB! 🌟
Looking for Percent of Total chart inspiration? Here are 6 CHARTS to help you get started! 💜
#B2VB #datafam #dataviz #chart #inspiration #AANHPIHeritageMonth #tableau #powerbi
21.05.2025 11:29 — 👍 1 🔁 0 💬 1 📌 0
haha thank you shri! 🌸😂
21.05.2025 11:10 — 👍 1 🔁 0 💬 0 📌 0
💜 B2VB Submission Tracker: bit.ly/496vP13
🏠 Explore all our B2VB tips here: bit.ly/3YMsrGR
🩵 About Data Mockstar: bit.ly/44imS5P
28.04.2025 15:57 — 👍 0 🔁 0 💬 0 📌 0
Practice your skills this week by building one with a mock dataset from Adam Mico's Data Mockstar GPT! 📱💻
Data Prompt:
28.04.2025 15:57 — 👍 0 🔁 0 💬 1 📌 0
A histogram displays how continuous data is distributed, making it easy to spot patterns and trends. 📊
Here are 11 TIPS to help you get started! 💜
#b2vb #datafam #dataviz #tableau #powerbi #flourish #challenge #chart #tips
28.04.2025 15:57 — 👍 2 🔁 0 💬 1 📌 0
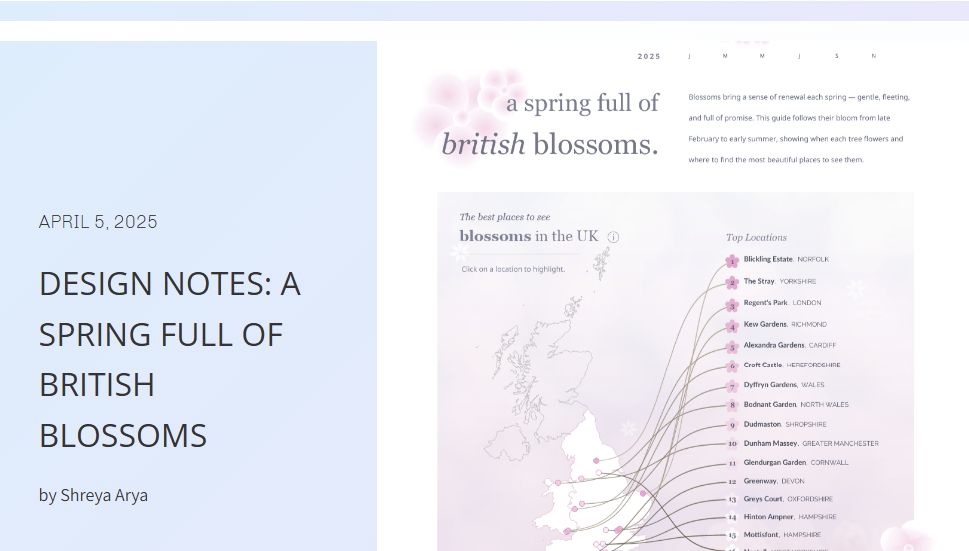
I’ve also written a blog sharing some of my design choices behind this viz. Sending a little spring magic your way :) 🌸✨
BLOG | Design Notes: A spring full of British Blossoms
🌸 datavizfairy.co.uk/blog/design-...
09.04.2025 11:11 — 👍 2 🔁 0 💬 0 📌 0
This is one of my favourite times of the year... it's so pretty, and i've been seeing blossoms everywhere I go!
I made a little spring guide to blossom-viewing spots across the UK, plus a blooming calendar to see what’s in season each month 🌸🌱
09.04.2025 11:11 — 👍 1 🔁 0 💬 1 📌 0
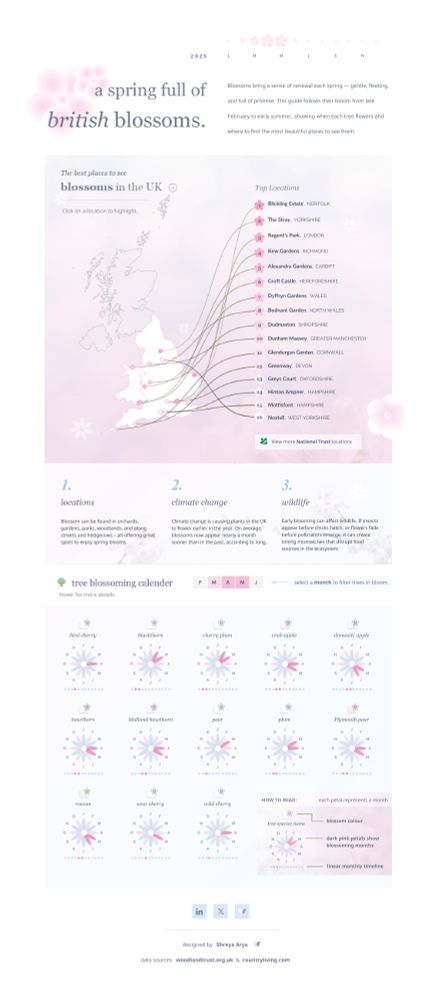
New viz 🌸 A spring full of British blossoms
🌐 Viz: public.tableau.com/app/profile/...
--
#tableau #datafam #dataviz #spring #blossom #trees #editorial #seasonal #design #calendar #nature #dataanalytics
09.04.2025 11:11 — 👍 7 🔁 0 💬 2 📌 0
💜 B2VB Submission Tracker: bit.ly/496vP13
🏠 Explore all our B2VB tips here: bit.ly/3YMsrGR
19.03.2025 15:54 — 👍 0 🔁 0 💬 0 📌 0
B2VB - Build a Scatterplot 💜
Here are 7 TIPS to help you get started!
This week's dataset covers mobile phone specifications! Create a scatterplot chart to compare key features ✨
🛜 Prompt Data: bit.ly/4kw1LCt
#b2vb #datafam #dataviz #tableau #powerbi #flourish #charts
19.03.2025 15:54 — 👍 2 🔁 0 💬 1 📌 0

Latest TUG is youtu.be/CtXKPhSvKf8
Wireframe Your Way to Visualisations that Wow @datavizfairy.co.uk
LOTS of awesome content @ youtube.com/@TeamDataFam #datafam
09.03.2025 02:58 — 👍 1 🔁 1 💬 0 📌 0
💜 B2VB Submission Tracker: bit.ly/496vP13
🏠 Explore all our B2VB tips here: bit.ly/3YMsrGR
📺 Watch the B2VB Live: bit.ly/4hhW6xS
03.02.2025 18:55 — 👍 0 🔁 0 💬 0 📌 0
Our second classic chart challenge of the year is to build a Multiple Line chart. Oftentimes, these can become 'spaghetti charts' where valuable insights get lost in the clutter... 🍝
Here are 6 TIPS to help you get started! 💜
✨ Prompt Data: bit.ly/40LL90D
--
#b2vb #datafam #uk #subscription
03.02.2025 18:55 — 👍 4 🔁 0 💬 1 📌 0
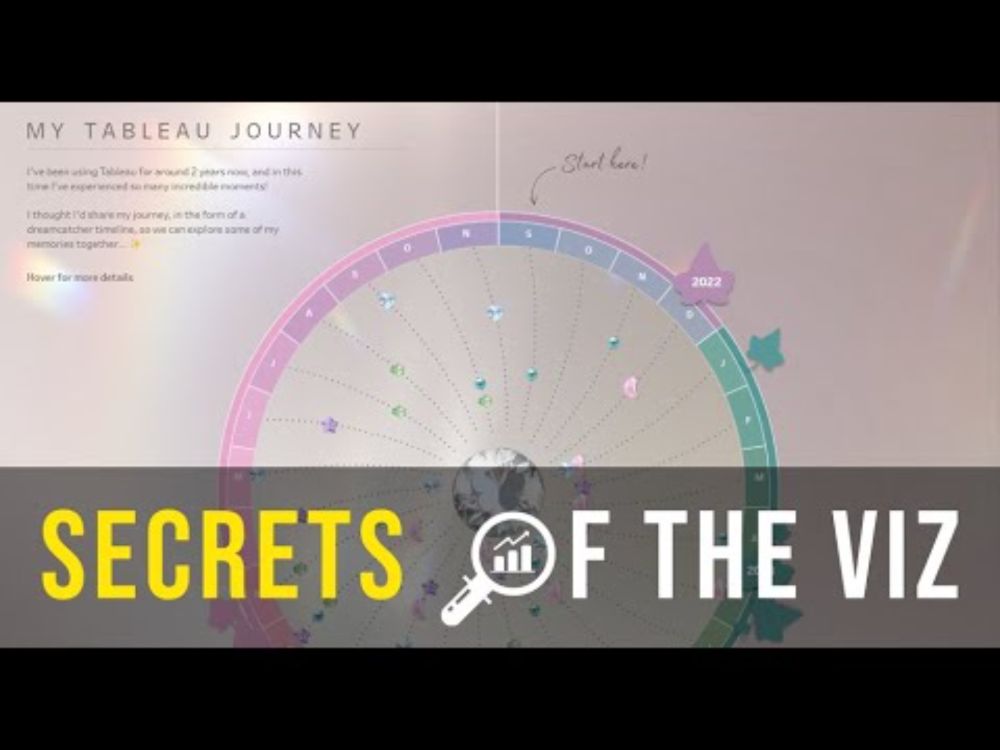
YouTube video by Louis Yu
Secrets of the Viz: My Tableau Journey
This week in #SecretsOfTheViz, @datavizfairy.co.uk drops in to share about her wonderful Dreamcatcher viz 📊 that encapsulates her 2 year+ #Tableau journey, and it's definitely one of my fav vizzes of 2024! Maybe this might spark an idea or two, #datafam 😉
www.youtube.com/watch?v=obVo...
29.01.2025 15:40 — 👍 2 🔁 1 💬 0 📌 0
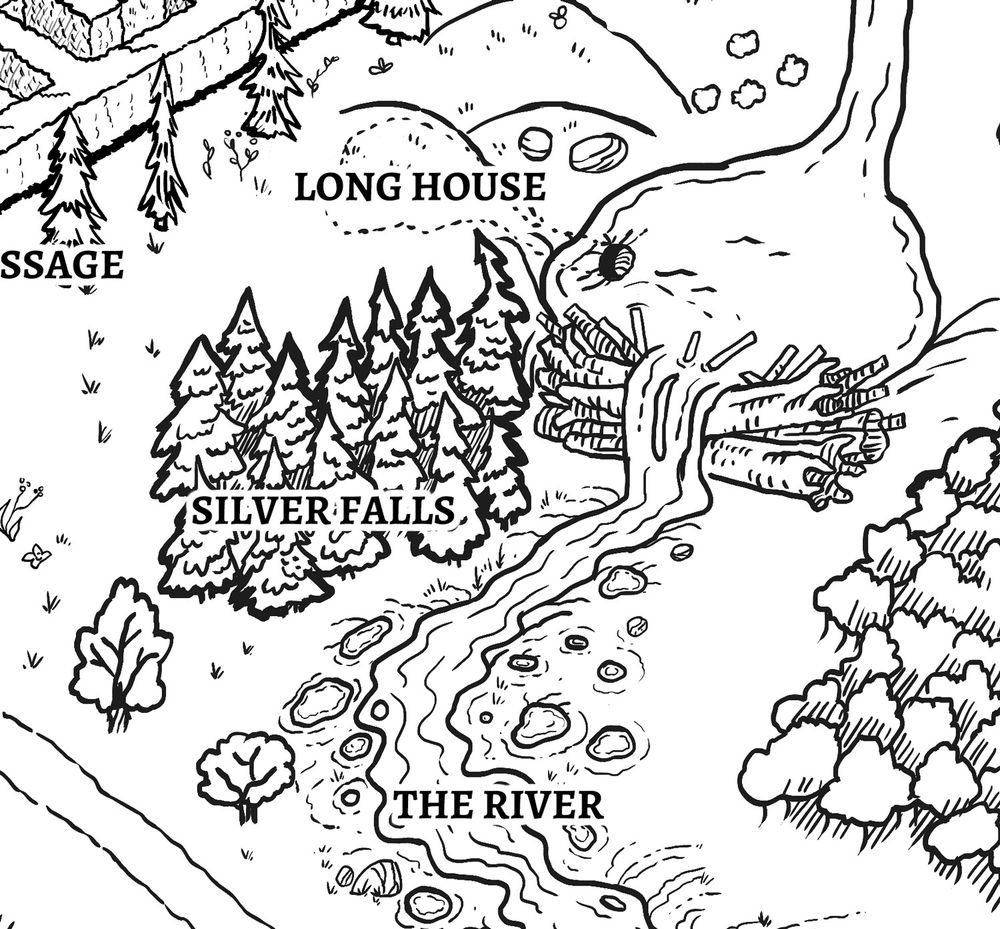
black and white map fragment depicting a beaver dam
mouse-sized map fragment
#ttrpg #indierpg #ttrpgmaps #art
25.01.2025 21:03 — 👍 147 🔁 14 💬 0 📌 1
statics ✨
24.01.2025 17:28 — 👍 0 🔁 0 💬 1 📌 0
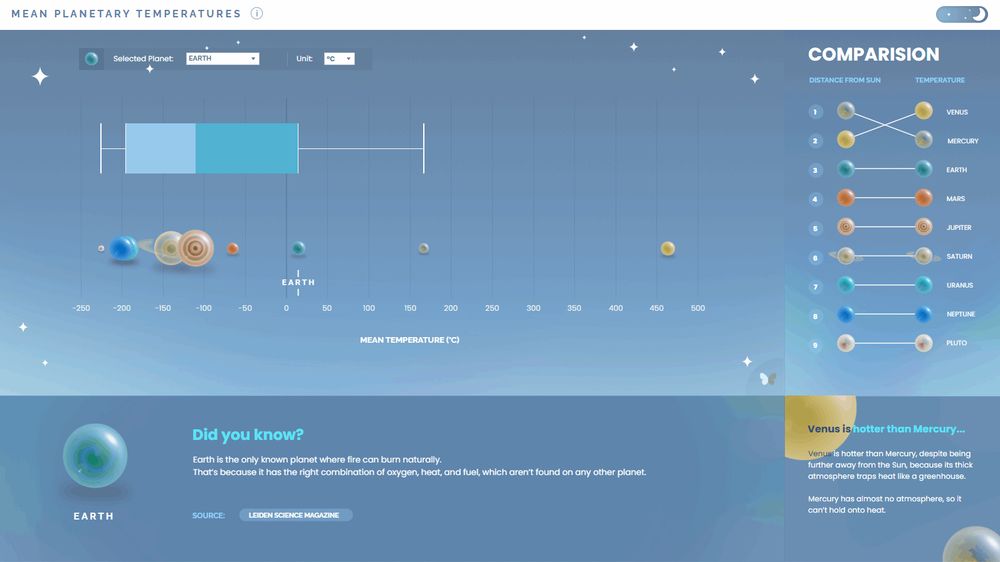
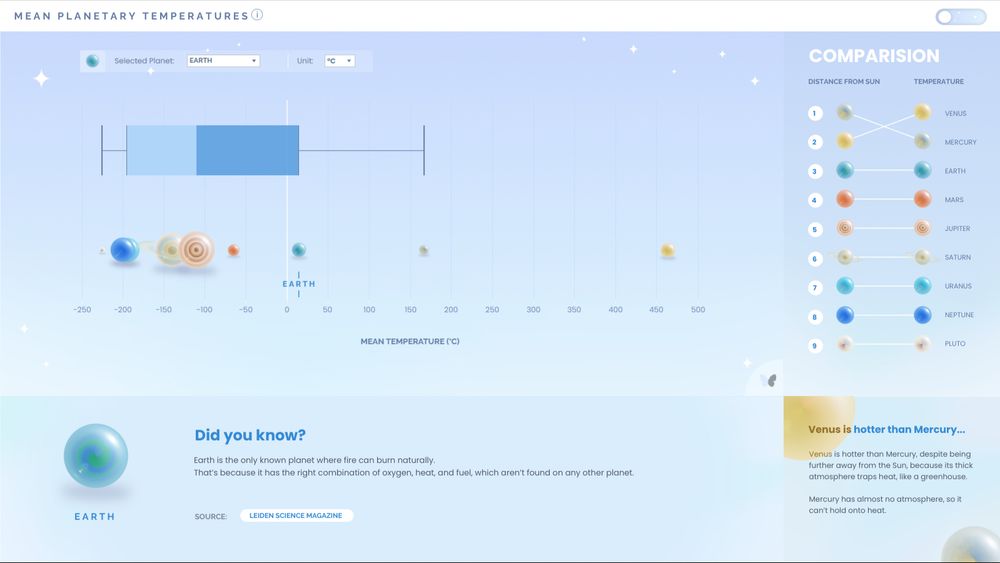
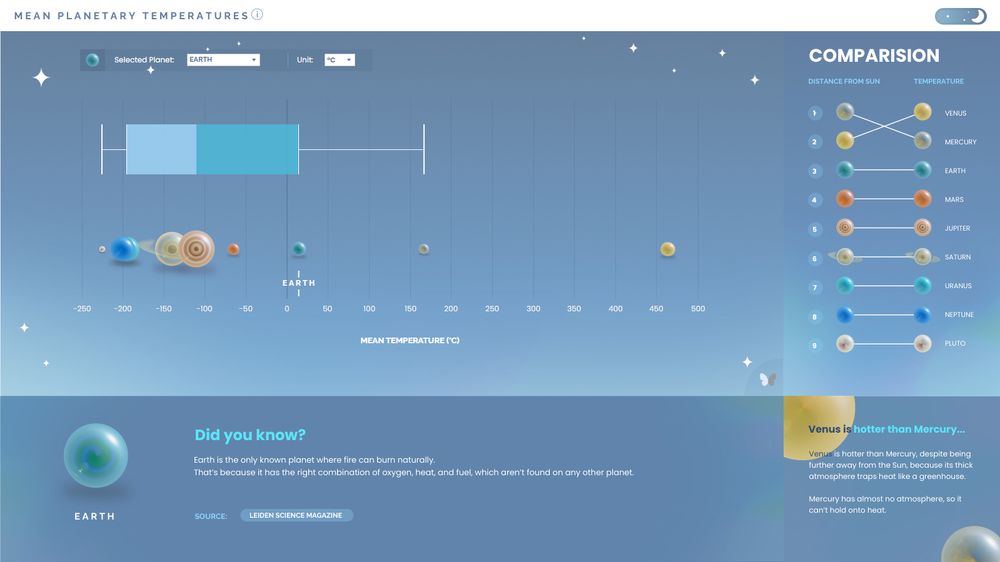
New Viz 💗 Mean Planetary Temperatures
Bringing new life into some forgotten vizzes in my hidden folder on Tableau Public 🪐
Viz: public.tableau.com/app/profile/...
--
#b2vb #boxplot #datafam #dataviz #space #planet #exploration #tableau #design #ui #ux #nasa
24.01.2025 17:28 — 👍 4 🔁 0 💬 1 📌 0

Mentally I'm here.
04.01.2025 16:22 — 👍 76 🔁 17 💬 2 📌 0
💜 B2VB Submission Tracker: bit.ly/496vP13
🏠 Explore all our B2VB tips here: bit.ly/3YMsrGR
16.01.2025 14:33 — 👍 0 🔁 0 💬 0 📌 0
Data Analyst | Exploring Data Science, ML & AI |
Simplifying data | Sharing insights | Learning out loud.
Esoteric aficionado of random knowledge and human shortcut for Google. Love all things data, Old Time Radio, Wikipedia, Tableau. Forever appreciative of the #datafam.
Might contain an Infinite Improbability Drive.
📊 Data visualization engineer, 💊healthcare analytics consultant, 🐶 dog mom, 🌱vegan for the animals. Cannabis, coffee, yoga, graph databases, typography, books. TBTL 🔟 Founder, Women in Dataviz
creative coder, preferrer of democracy
also into coffee shops, sad folk music, basketball, and playing chess poorly
data viz: http://perthirtysix.com
creative coding: http://shrikhalpada.dev/projects
Senior Data Analyst, Business Intelligence, Data Viz, Power BI, R, Python, SQL
Data Visualization Designer | Tableau Public Ambassador | #COYI https://public.tableau.com/app/profile/adedamola8122/vizzes
Data Analyst at The information Lab
Tableau, SQL, Python, R, PBI, Alteryx and more
| 🌈 | (he-him) TTRPG ilustrador and fantasy cartographer. Brazilian. ND.
🗺️ https://www.patreon.com/tomeofsalvaterra
#cartography #art #ttrpg
🚫NoAI/N-F-T
💼 https://cara.app/salvaterra
📧diariodecampanharpg@gmail.com
Analytics specialist in 🇨🇦. Tableau-certified data analyst 📊. Researcher. Hobby photographer.
Data tools 📈: #Tableau, #SQL, #Rstats, #Python, #Excel, #CRManalytics
https://public.tableau.com/app/profile/julia.m.28/vizzes
🇮🇳 #DataAnalyst | 2x #TableauAmbassador | #NewbiesTUG Co-Lead | #MumbaiTUG Lead | #BusinessAnalyst | #BusinessIntelligence | Music Lover | ❤️#datafam | #dataviz | #datasky | #databs | #TableauNewbies
beauty is in the eye of the beholder.
Data visualist, business owner/founder, aspiring coloured pencil artist, men's health & wellbeing advocate, & highly interested in personal fulfilment.
DATA Saber(2023/2/20〜) / Tableau Desktop Specialist / PMP(Project Management Professional) / 1X #datafam Roundup┃無言フォロー失礼します
Life's simple. You make choices and don't look back!
Alteryx Innovator | 2xVOTD | TableauNext2024 | Tableau Public Ambassador 2024
Tableau Public: https://public.tableau.com/app/profile/rob.taylor6175/vizzes#!/