honestly if software companies/projects just started adding a "this is not an AI project" disclaimer, I would go out of my way to support them
(maybe I should add this to my projects...)
05.08.2025 15:17 — 👍 4 🔁 0 💬 0 📌 0
some might say appropriately salty!
03.08.2025 12:22 — 👍 1 🔁 0 💬 0 📌 0
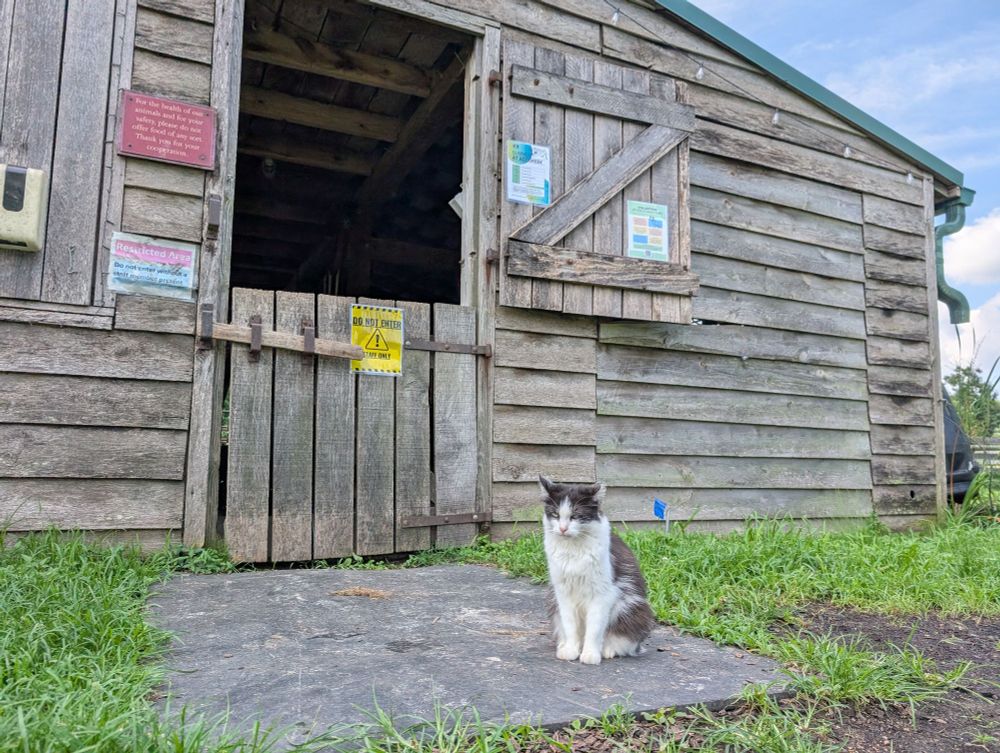

today I met a farm cat
02.08.2025 22:10 — 👍 5 🔁 0 💬 1 📌 0
There are no job losses in Ba Sing Se
01.08.2025 19:20 — 👍 1424 🔁 312 💬 26 📌 9
There‘s a bunch of wholesome nerdy people in my TL but they only post once a day (sometimes once a week) at most. So do I.
I bet everyone is just busy and tired all the time (both from paid work and from nerd-sniping themselves).
And I wished we could all just hang around somewhere in a Nerd Café.
31.07.2025 16:21 — 👍 4 🔁 1 💬 0 📌 2
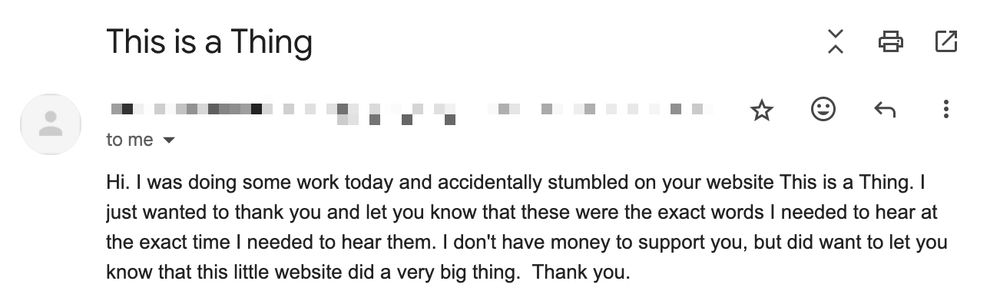
An email that reads:
"Hi. I was doing some work today and accidentally stumbled on your website This is a Thing. I just wanted to thank you and let you know that these were the exact words I needed to hear at the exact time I needed to hear them."
this made my day, and has me in the mood to do more creative coding when I get the chance
31.07.2025 20:18 — 👍 5 🔁 0 💬 1 📌 0
you could work directly with the CEO, though!
31.07.2025 18:14 — 👍 1 🔁 0 💬 0 📌 0
this and Color Theory by Soccer Mommy got me through early COVID
31.07.2025 14:36 — 👍 1 🔁 0 💬 1 📌 0
thank you!! I scraped my own Google Timeline data. I figured if it's being tracked, I might as well do something with it myself lol
I got inspired to do some type of visualization with my personal data from a friend, who did a similar radial visualization showing their sleep data over a year
30.07.2025 21:07 — 👍 1 🔁 0 💬 0 📌 0
I sometimes feel like I'm picking between creativity and utility in #dataviz, but that's a false dichotomy
With some thoughtfulness in design and engineering, we can have the best of both worlds
Live link to this example: perthirtysix.com/visualizing-...
30.07.2025 17:39 — 👍 5 🔁 0 💬 2 📌 0
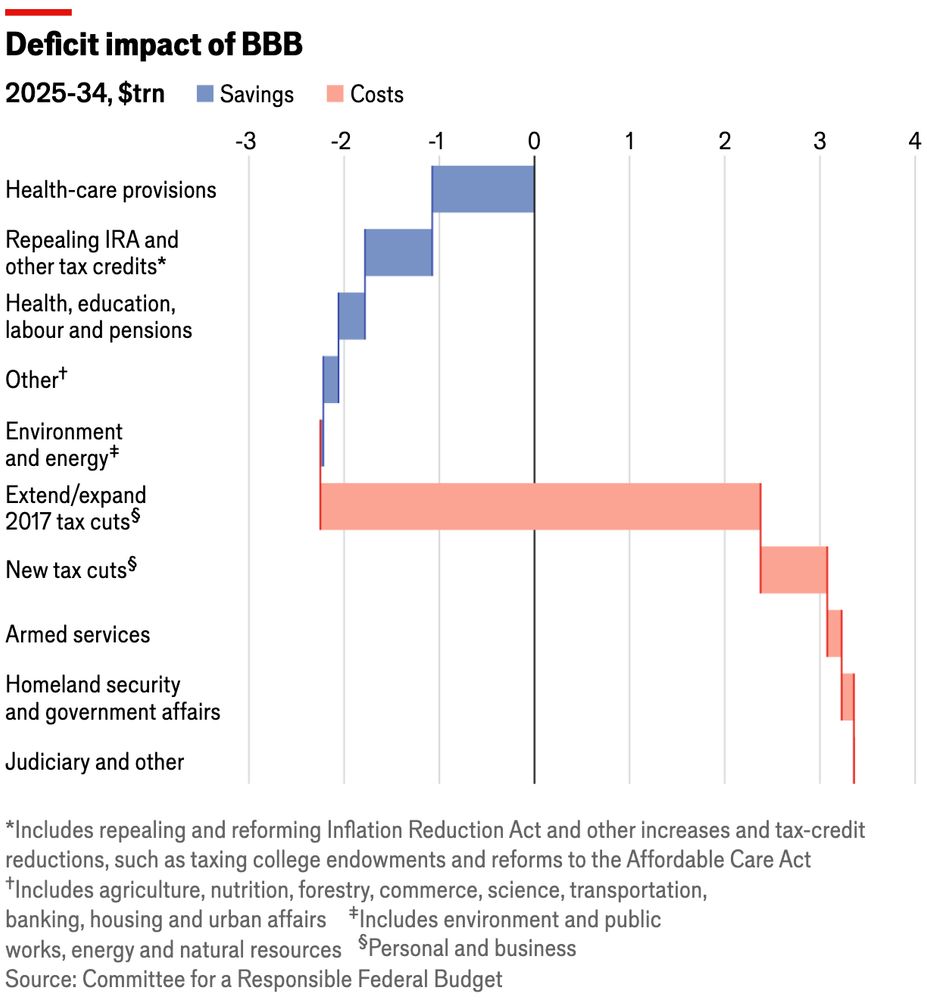
one of my data viz hot takes is I really don't like waterfall charts
29.07.2025 19:43 — 👍 2 🔁 0 💬 1 📌 0
"respectfully yours" after writing hundreds of words of garbage is a choice
23.07.2025 21:36 — 👍 43 🔁 0 💬 0 📌 0
 22.07.2025 13:11 — 👍 6885 🔁 1358 💬 73 📌 53
studies have shown that if you give a rat a button for food, if the button:
- ALWAYS gives them food, they'll hit it just when they're hungry
- SOMETIMES gives them food, they'll get obsessed with it and ignore everything else
intermittent reinforcement is a bug in our brains too
21.07.2025 16:07 — 👍 5 🔁 2 💬 0 📌 0
Miso!
20.07.2025 17:35 — 👍 1 🔁 0 💬 0 📌 0

"There is a marginal risk of severe weather today." in scary red text
I would prefer a severe risk of marginal weather
14.07.2025 15:10 — 👍 4 🔁 0 💬 0 📌 0
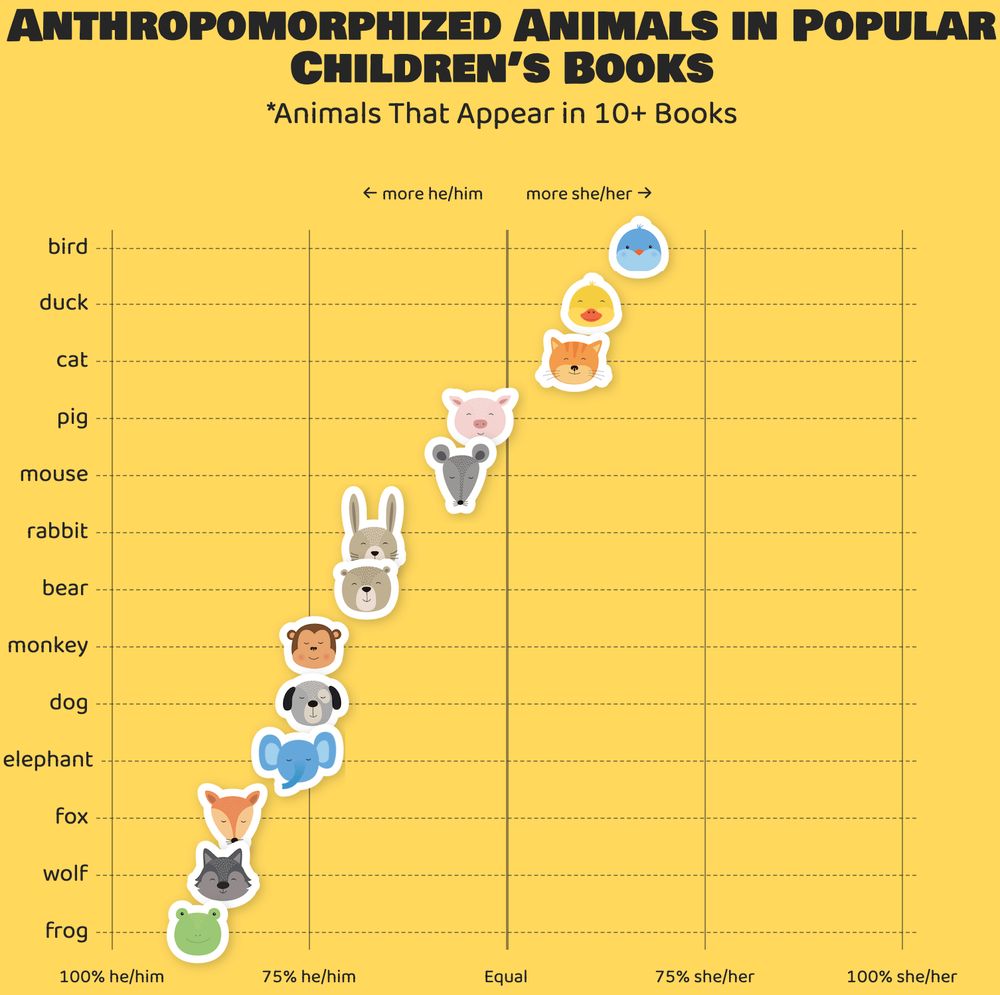
sticker game is strong!
13.07.2025 17:22 — 👍 1 🔁 0 💬 0 📌 0
I've been seeing some meta-analysis about data viz on my feeds and I wish I was as optimistic about some of the stuff I was reading (in terms of societal impact).
My $.02 is that good data communication can help a critical thinker think critically, but it won't make someone a critical thinker.
13.07.2025 17:21 — 👍 4 🔁 1 💬 0 📌 0
it's gambling all the way down baby
12.07.2025 16:21 — 👍 1 🔁 0 💬 0 📌 0
social media platforms, especially infinite algorithmic short video type of stuff, creates some of the same psychological dependencies as gambling too!
12.07.2025 16:16 — 👍 2 🔁 0 💬 1 📌 0
that's the idea! 🙂
but point taken, thanks for the feedback
11.07.2025 20:54 — 👍 0 🔁 0 💬 0 📌 0
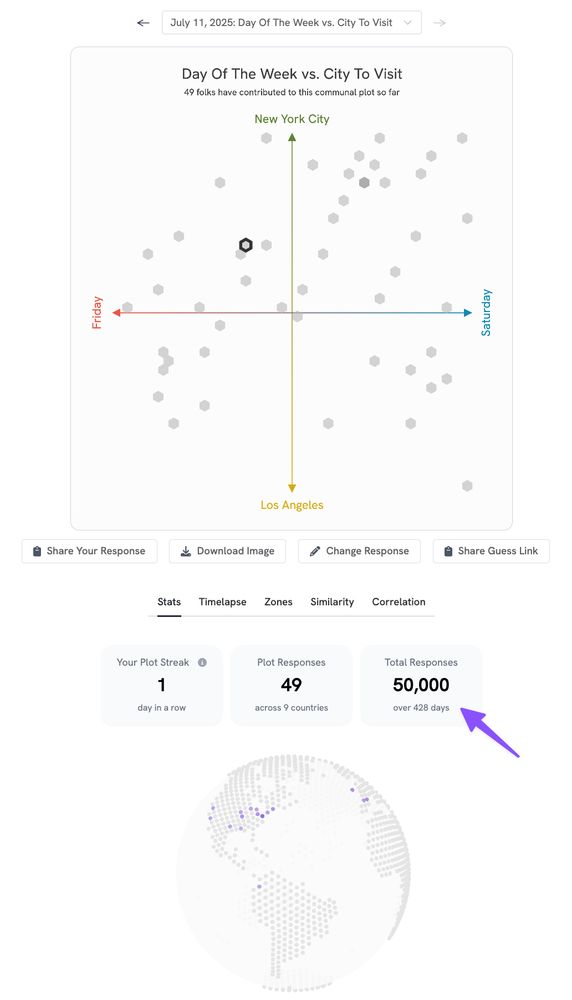
A screenshot of the Communal Plot project, with an arrow pointing at the "Total Response" number, which is at 50,000.
Last year I launched a daily data viz poll game, and today it hit 50,000 total responses across 162 countries! super cool
it's at communalplot.com if you're interested in checking it out!
11.07.2025 17:20 — 👍 5 🔁 0 💬 0 📌 0

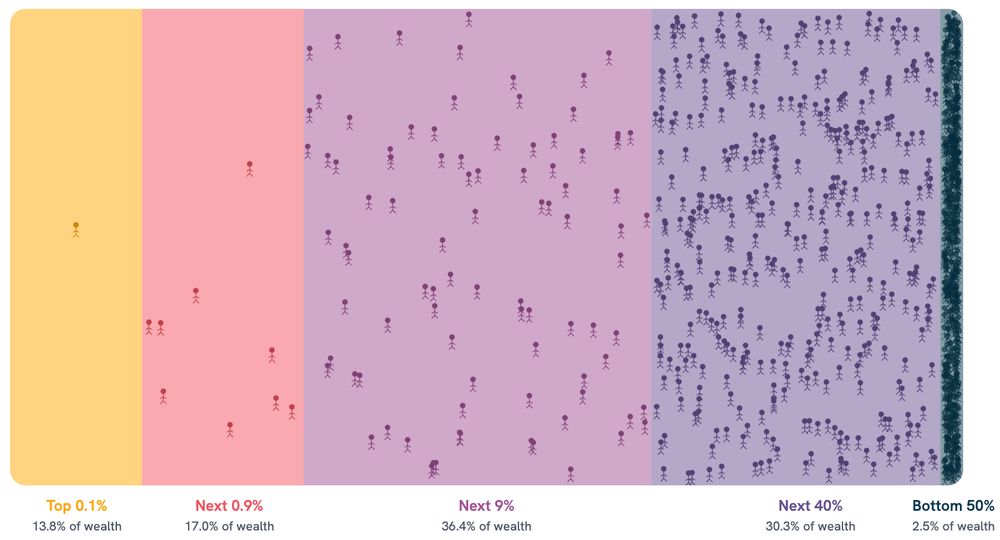
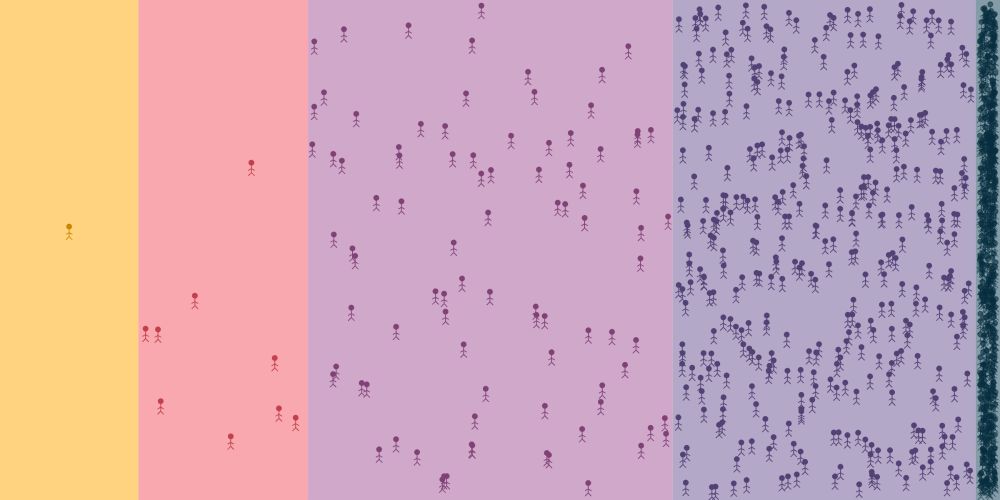
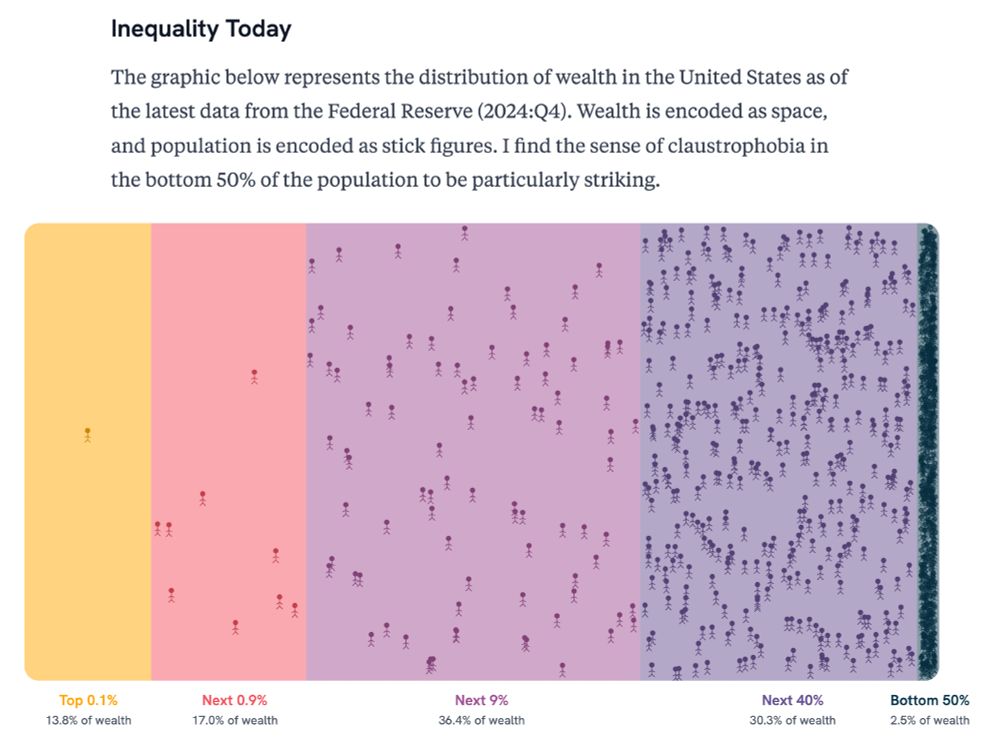
A data viz that shows wealth inequality in America using stick figures and areas. The data shows that the top 0.1% has 13.8% of the wealth, the next 0.9% has 17%, the next 9% has 36.4%, the next 40% has 30.3%, and the bottom 50% has 2.5%.
Thanks Michael! It looks like the link preview on Bluesky actually crops out the bottom 50%. I'm not sure if that's the image you were referring to, or the full image, but here's the full image if helpful!
11.07.2025 15:27 — 👍 2 🔁 0 💬 1 📌 0
For a while now, I've been trying to think of ways to visually and viscerally communicate just how ludicrous the wealth that the top 1% has accumulated is. This one (not mine) is pretty good...
11.07.2025 15:03 — 👍 5 🔁 1 💬 1 📌 0
A data viz that shows wealth inequality in America using stick figures and areas. The data shows that the top 0.1% has 13.8% of the wealth, the next 0.9% has 17%, the next 9% has 36.4%, the next 40% has 30.3%, and the bottom 50% has 2.5%.
how the side the on the left keeps convincing the side on the right that they need more space is beyond me
10.07.2025 14:46 — 👍 47 🔁 19 💬 4 📌 7
me before I go 3 for 18 with 9 turnovers at pickup ball
10.07.2025 14:01 — 👍 10 🔁 0 💬 1 📌 0
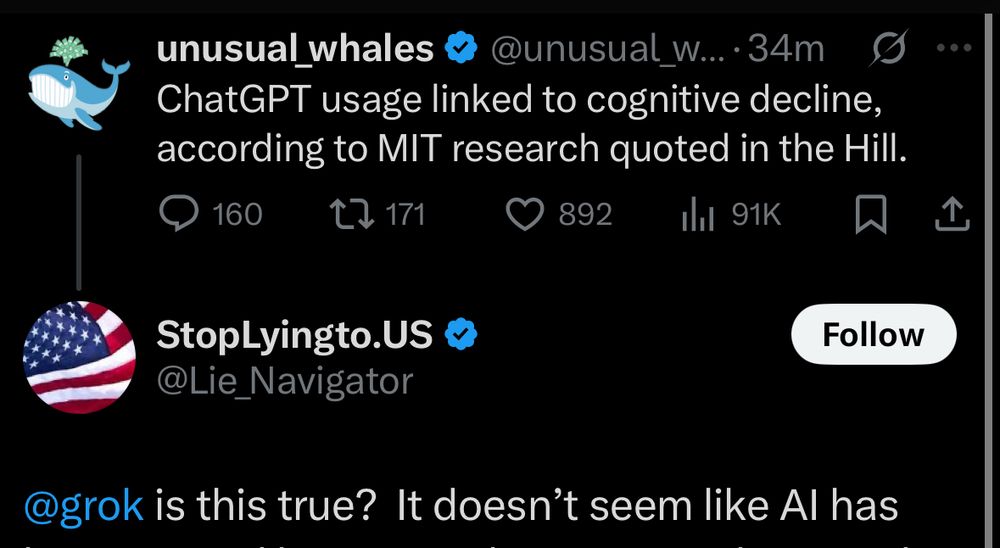
dead internet theory looking more and more true every day
10.07.2025 12:51 — 👍 3 🔁 0 💬 0 📌 0
🧠 Cognitive Data Strategist | Teaching data to speak human
📊 PhD Psychologist + Gov Data Analyst | Learning dataviz publicly
🐳 Victoria, BC
MIT Center for Constructive Communication Prototype Manager and Poetry Open Mic Attender
Assistant Professor @ UMD CS┃she/her┃HCI, Vis, & daydreaming┃Prev Northwestern CS, Brown CS, Tufts CS ┃www.fmyang.com ┃fig-x.github.io
2 Nobel laureates, 6 Pulitzer recipients, scores of Fulbright scholars, one cute turtle and a bike ride away from our nation's capital!
Research in NLP (mostly LM interpretability & explainability).
Incoming assistant prof at UMD CS + CLIP.
Current postdoc @ai2.bsky.social & @uwnlp.bsky.social
Views my own.
sarahwie.github.io
Editor and CEO, Zeteo
Author, ‘Win Every Argument’
British-American
noun | a reference source containing words alphabetically arranged along with information about their forms, pronunciations, functions, and etymologies
"I used to be just like you before I started going to therapy"
art + code, information + design, slime mold, maps.
data viz at Vera Institute of Justice, opinions my own
Streaming on:
http://www.kick.com/destiny
https://www.youtube.com/destiny
Website: https://www.destiny.gg/
Assemblymember. Democratic Nominee for Mayor of NYC. Running to freeze the rent, make buses fast + free, and deliver universal childcare. Democratic Socialist. zohranfornyc.com
MSNBC anchor/co-host of The Weekend: Primetime, Sat/Sun 6-9pm. Fmrly WashPost syndicated op-ed columnist. Currently on leave.
Econ, politics, immigration, tax, etc. + occasional theater nerdery.
Cosmologist, pilot, author, connoisseur of cosmic catastrophes. TEDFellow, CIFAR Azrieli Global Scholar. Domain verified through my personal astrokatie.com website. She/her. Dr.
Personal account; not speaking for employer or anyone else.
Talent Agent ➡️ Data Analyst
📊Tableau / Alteryx Consultant @The Information Lab
🪩Tableau Social Ambassador
🙇🏽♀️Data+Women NYC TUG Co-Lead
Graphics Editor at The New York Times 🇺🇸| former Reuters 🇸🇬 | South China Morning Post 🇭🇰 | La Nacion 🇨🇷
Senior NBA Writer at the Action Network. Episodic maniac writer. Hates your team. Yes yours.
Buckets podcast: https://www.actionnetwork.com/podcasts/buckets