Aleksandra wants your help! Please click here to donate.
Aleksandra is excited to participate in the La Villita Turkey Trot! We need your help to reach our goal for field trips. Please donate to support Aleksandra in raising the funds needed for La Villita ...
Iโll break character to talk about something unrelated to data viz.
My daughter is doing her first-ever fundraising activity: a turkey trot to raise money for field trips. (28% off students are from low-income families.) Any help is appreciated! ๐ฅธ๐ช๐ผ
mybooster.com/v3/dash/NvoC...
15.11.2024 23:42 โ ๐ 3 ๐ 0 ๐ฌ 0 ๐ 0
First www.graphs.world and now this. Nobody quite boosts and destroys productivity like dataviz folks.
07.09.2024 01:38 โ ๐ 2 ๐ 0 ๐ฌ 0 ๐ 0
Image of first page of WordleBot analysis.
Pretty neat, @nytimes.com.
29.05.2024 14:57 โ ๐ 0 ๐ 0 ๐ฌ 0 ๐ 0
Tuna Wang playing Flight of the Bumblebee always blows my mind. m.youtube.com/watch?v=-yZP...
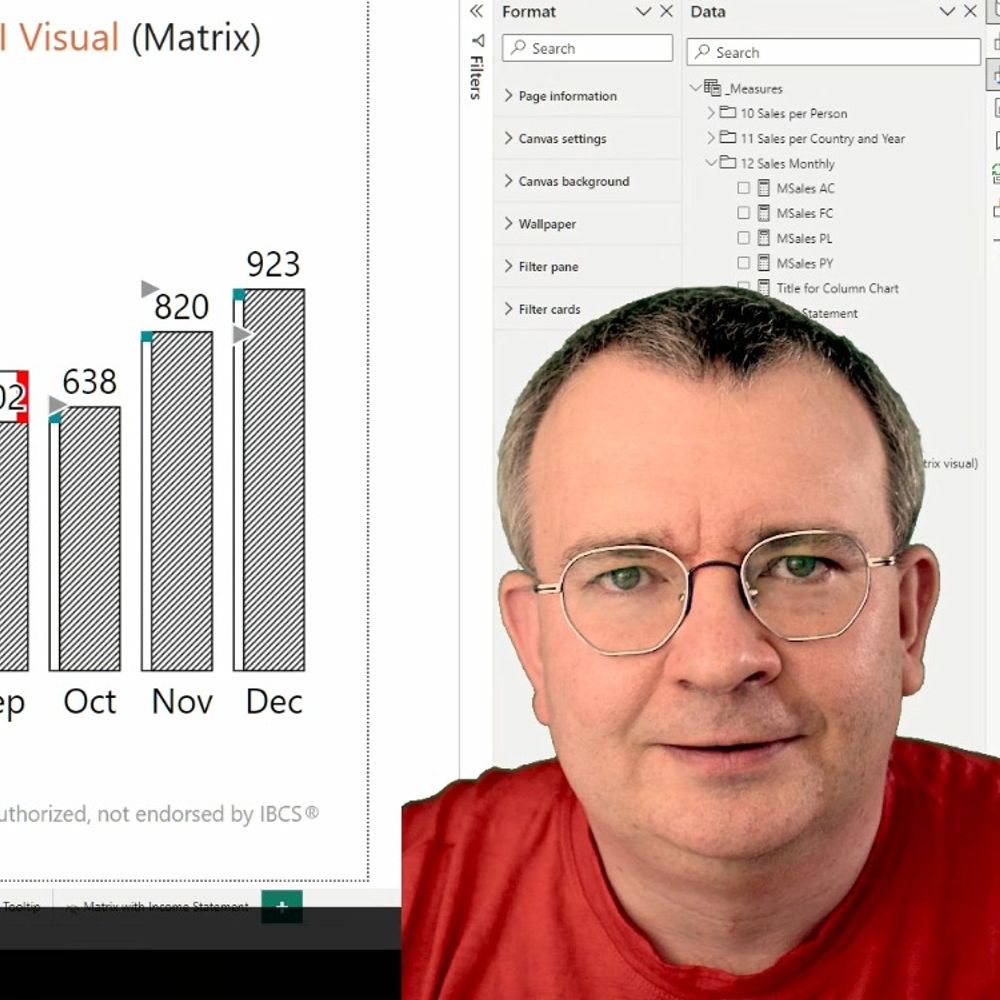
30.11.2023 21:12 โ ๐ 0 ๐ 0 ๐ฌ 0 ๐ 0
I wonder whether plunger plots are disliked for the same reason pie charts: people just using them incorrectly and in an ill-fitting scenario.
23.11.2023 05:08 โ ๐ 3 ๐ 0 ๐ฌ 0 ๐ 0
German #geographer and #demographer in #Melbourne. I love and share #maps and #data that explain how the #world works.
Power BI Developer and Consultant
Data Explorer, Visualizer, Explainer
IBCSยฎ Certified Analyst
Journalist/technologist, @financialtimes.com Visual Investigations
๐London
โ๏ธ peter.andringa@ft.com
๐ Signal: @peterandringa.01
ft.com/news-tips
Data, analysis, visualization, #CensusMapper, transportation cyclist.
๐Vancouver, BC
Engineering Fellow at JMP, focused on #DataViz, preferring smoothers over fitted lines. Creator of JMP #GraphBuilder and #PackedBars chart type for high-cardinality Pareto data. #TieDye #LessIsMore
A bit of everything, recreational math, mechanical engineer, programmer, statistics, dataviz.
Assistant Professor in the Visualization cluster at TU Eindhoven, NL โจ๐ฉโ๐ปโ๏ธ (she/her) https://sarahschoettler.com
Data scientist and visualization nerd at NASA | Ph.D. computational astrophysics | devoted dog dad in my free time | alexbgurvi.ch
Professor for Data visulisation at the university of applied sciences upper Austria. Teaching Excel, Tableau, PowerBI. Research fields: Logistics, Data Literacy, OER, Data Culture,
Data visualization designer
krisztinaszucs.com
Data visualization researcher. Associate Prof of CS at the University of Utah. Lab website: https://vdl.sci.utah.edu. Co-founder of
datavisyn: https://datavisyn.io
Assistant Professor of Information Systems at Loyola University Chicago. Founder/principal researcher at the UX & Biometrics Lab (https://www.uxbiometriclab.com/). First Tableau User Conference Attendee. Data Vis/UX/NeuroIS/Biometrics
Data Analyst at The information Lab
Tableau, SQL, Python, R, PBI, Alteryx and more
data viz nerd | lover of ๐ and libraries | ๐ณ๏ธโ๐ she/her
Data visualisation engineer in Australia.
Author of Practical UI Patterns for Design Systems.
Creator of Typey Type for Stenographers.
๐ https://didoesdigital.com
Visualization toolmaker. Founder of Observable. Creator of D3. Former NYT Graphics. Pronounced BOSS-tock.
Americas editor, @graphics.reuters.com. Once: FiveThirtyEight, CUNY adjunct. Almost Canadian.
Graphics Editor at The New York Times ๐บ๐ธ| former Reuters ๐ธ๐ฌ | South China Morning Post ๐ญ๐ฐ | La Nacion ๐จ๐ท
From Singapore ๐ธ๐ฌ Head & Co-Founder, Kontinentalist. Data storyteller. Chevening Scholar 23โ, MSc Data, Inequality and Society at University of Edinburgh ๐ด๓ ง๓ ข๓ ณ๓ ฃ๓ ด๓ ฟ
๐ Information Designer and Data Analyst freelancer ๐ I used to publish books ๐ผ now I roller skate a lot โ๏ธ Immigrant ๐Carioca em Lisboa
#dataviz posts in EN, everything else in PT