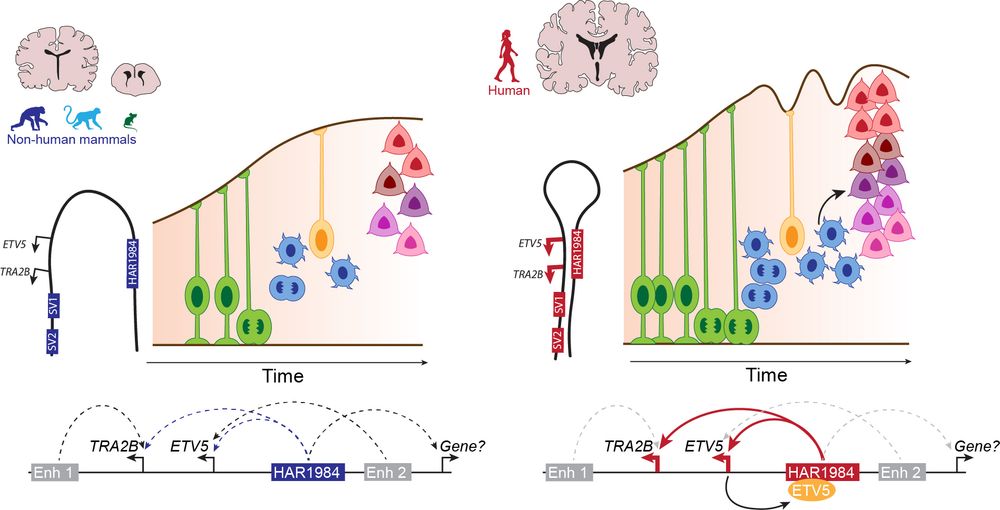
Sharing our newest study led by the incredibly talented @federicamosti.bsky.social investigating new molecular mechanisms of human brain development. We discover a human-specific enhancer HAR1984 that influences chromatin looping to promote cortical size and folding! www.biorxiv.org/cgi/content/...
10.08.2025 13:19 — 👍 54 🔁 16 💬 1 📌 2
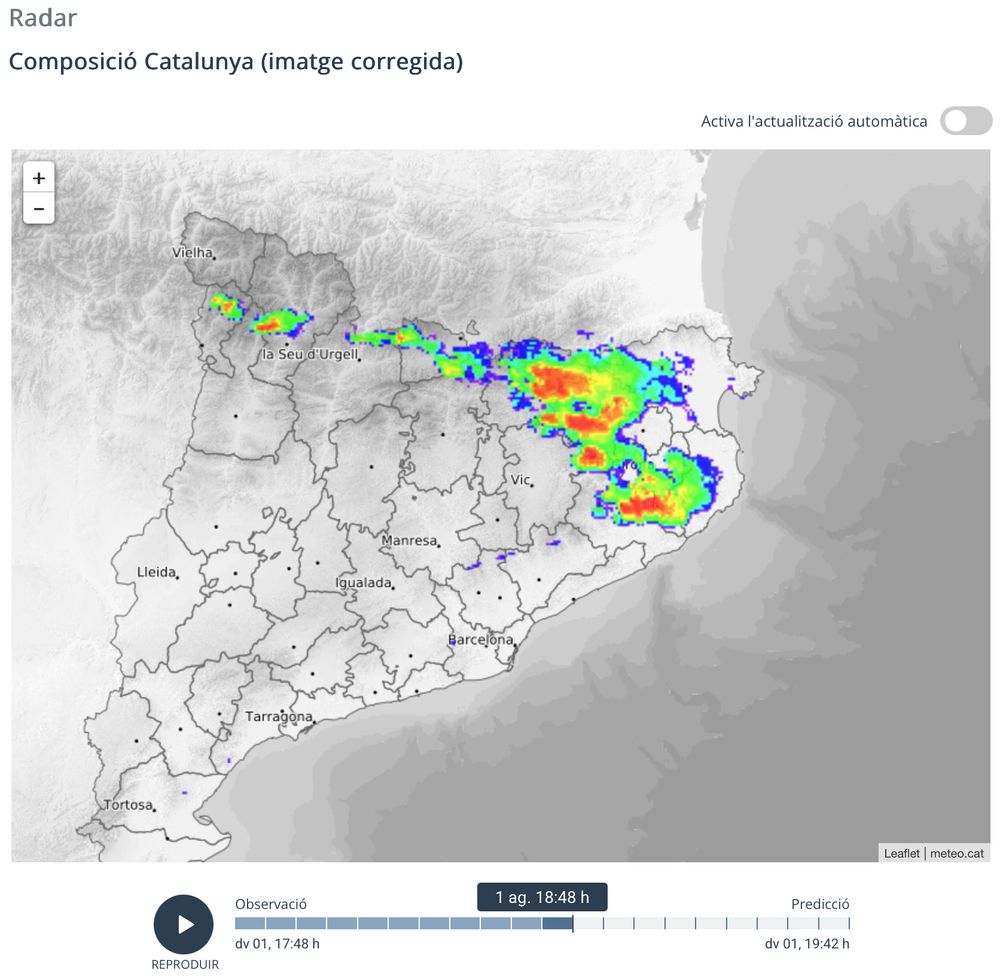
El típic tuit d'estiu. La "Garrotxa" is different.
01.08.2025 17:01 — 👍 0 🔁 0 💬 0 📌 0
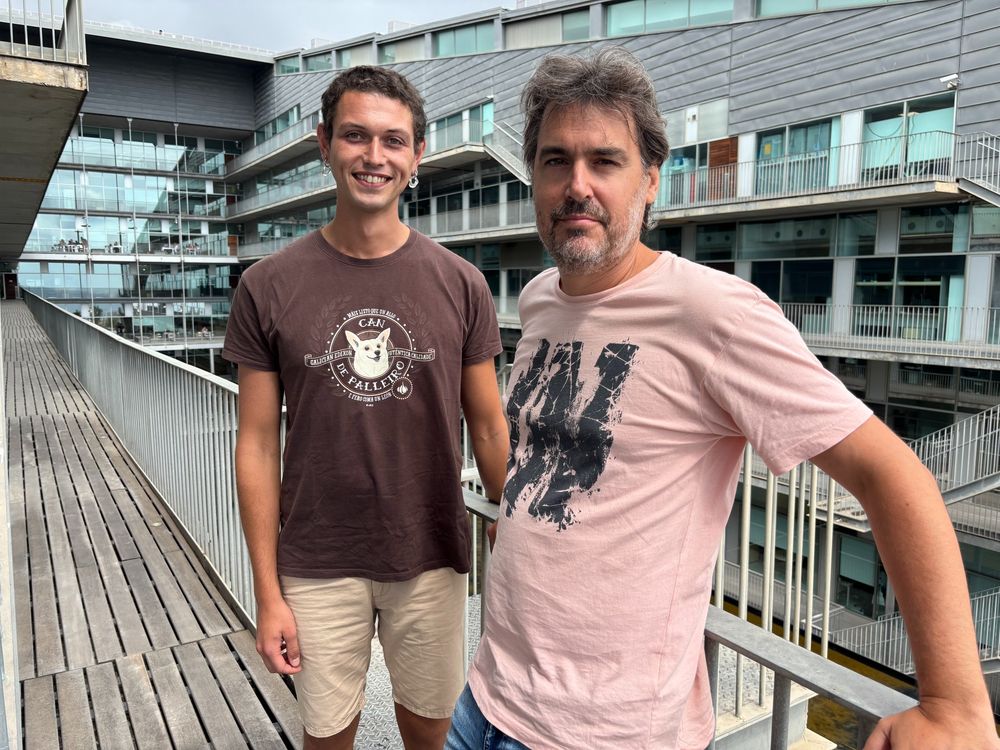
Linking alterations in precursor cells of brain 🧠 formation with the origin of #neuropsychiatricdiseases
#bioinformàtica #neuropsiquiatria #salutmental #autisme #Alzheimer #TalentMAR @santperelab.bsky.social @yaleneuro.bsky.social @hospitaldelmar.bsky.social
www.researchmar.net/news/742/lin...
25.07.2025 07:09 — 👍 8 🔁 6 💬 1 📌 0
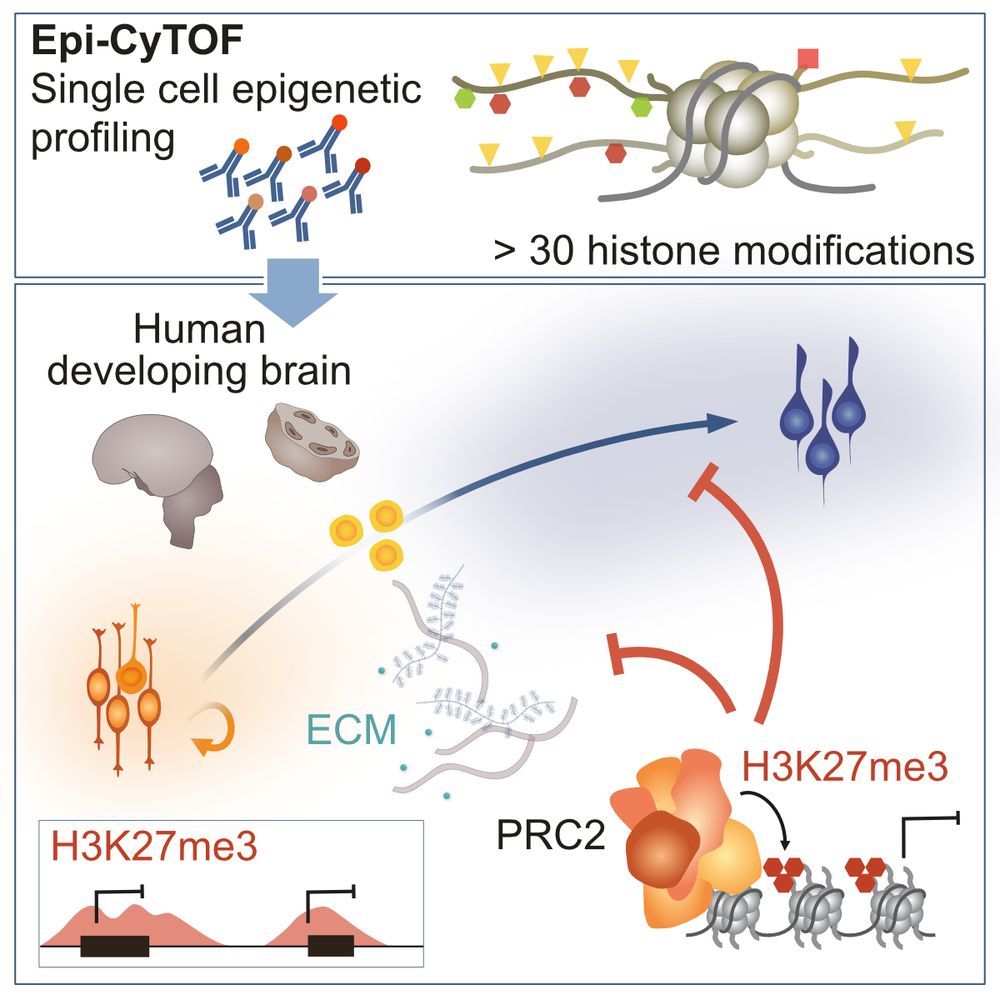
How do epigenetic modifications contribute to human #neocortex #development? Excited to see our work out in #Neuron. We applied Epi-CyTOF and identified a novel role for PRC2 in regulating #ECM.
@crtd-tud.bsky.social @cp-neuron.bsky.social
www.sciencedirect.com/science/arti...
A thread below 👇
23.07.2025 11:32 — 👍 22 🔁 6 💬 3 📌 0
How to represent genomes in 3D?
In this paper (and video), we propose Geometric Diagrams of Genomes (GDG)—a visual grammar that aims at emulating the effect ribbon diagrams (Richardson et al 1981) had in protein structural biology. Time will tell.😅
👉🏼 genomebiology.biomedcentral.com/articles/10....
27.06.2025 08:13 — 👍 35 🔁 14 💬 2 📌 0
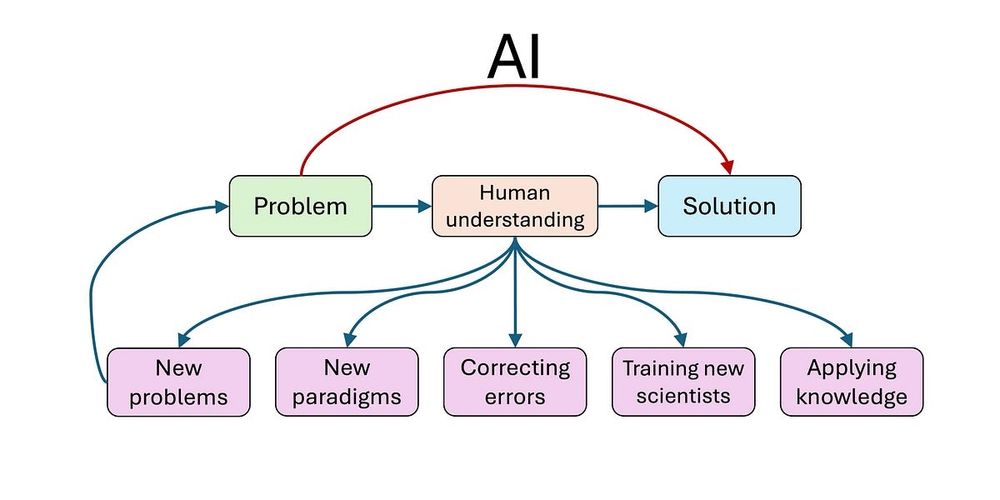
Could AI slow science?
Confronting the production-progress paradox
Fabulous post by @randomwalker.bsky.social & Sayash raising the same concern many of us have about whether we're on the right track with how we're using AI for science. Everyone should read it, take a deep breath & think through the implications.
www.aisnakeoil.com/p/could-ai-s...
17.07.2025 16:05 — 👍 156 🔁 71 💬 7 📌 11
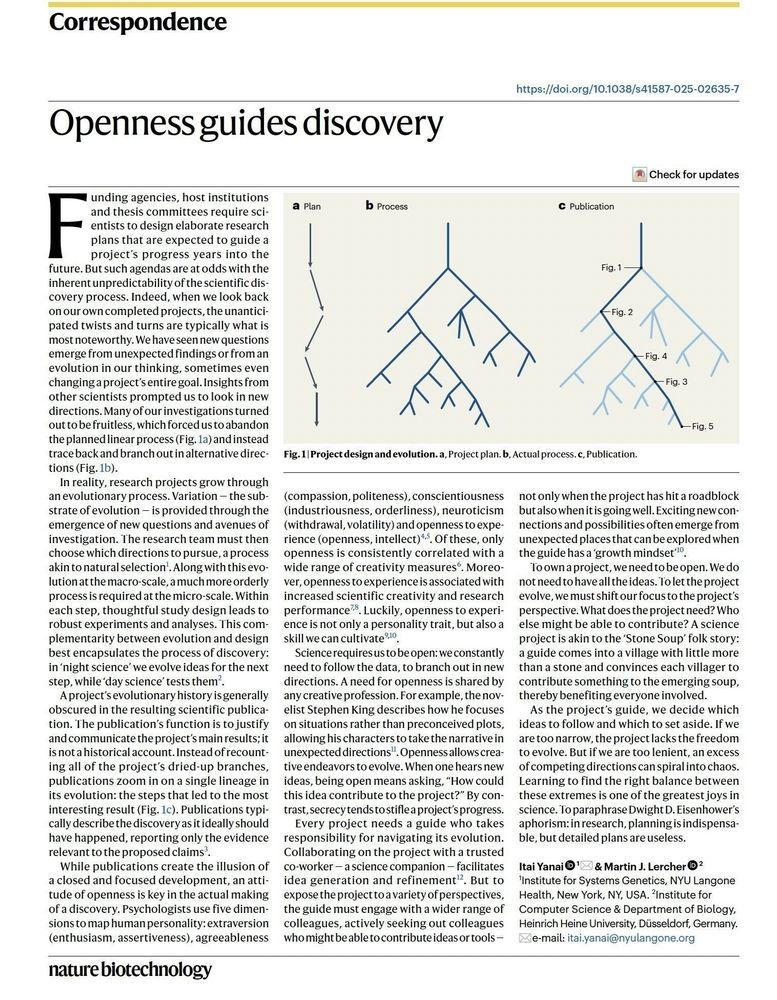
'Night science' is what you do when you're not sure what's the question.
03.07.2025 08:17 — 👍 33 🔁 9 💬 0 📌 2
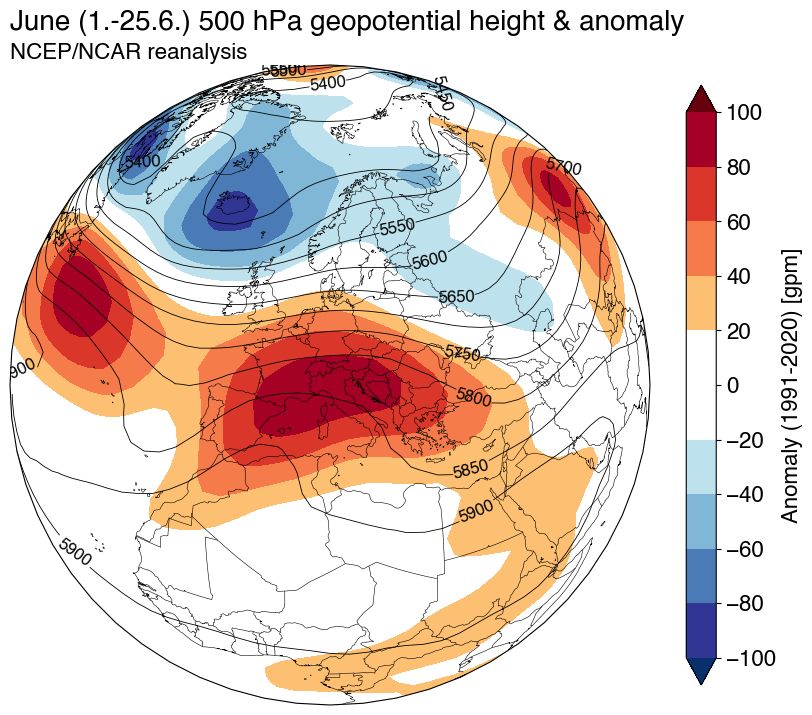
500 hPa geopotential height and its anomaly for 1-25.6. from NCEP/NCAR reanalysis.
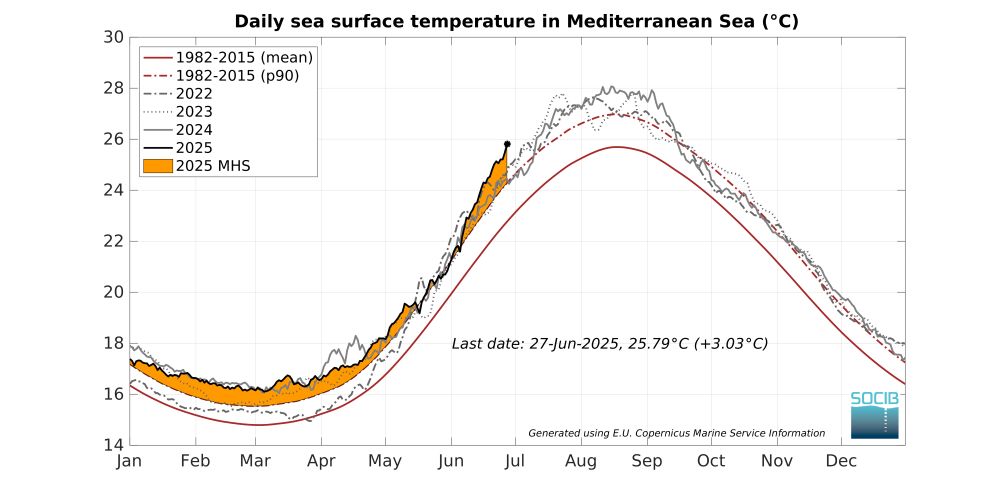
Daily sea surface temperature in Mediterranean Sea. The current values are above the recent climatology, meaning record-warm sea surface temperatures.
The Mediterranean is now warmer than it typically was in August during the recent 1982–2015 climate period.
And it’s no wonder when you look at the atmospheric circulation: a strong upper-level ridge has parked over the western Mediterranean, allowing the marine heatwave to develop.
28.06.2025 10:28 — 👍 42 🔁 11 💬 1 📌 0
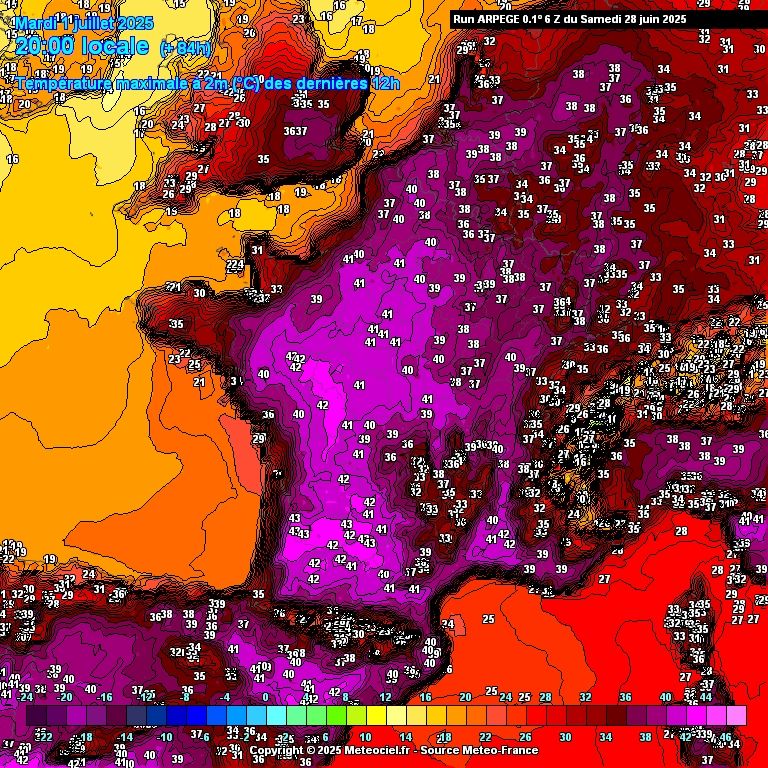
Magnitude of current heatwave is incredible!
The forecast for tuesday shows an unprecedented area with temp. > 40°C 😱
Never before has it been so hot over such a large area (and so early!) 🔥
The vertigo of having to live like this for the rest of your life...
Data @meteofrance.com
28.06.2025 16:07 — 👍 357 🔁 217 💬 22 📌 44
Excited to launch our AlphaGenome API goo.gle/3ZPUeFX along with the preprint goo.gle/45AkUyc describing and evaluating our latest DNA sequence model powering the API. Looking forward to seeing how scientists use it! @googledeepmind
25.06.2025 14:29 — 👍 217 🔁 82 💬 5 📌 10
Less guns. More pipettes.
24.06.2025 16:42 — 👍 10 🔁 1 💬 0 📌 0
Finlàndia s'està mediterranitzant ...
19.06.2025 18:57 — 👍 1 🔁 0 💬 0 📌 0
A meme-style comic panel with three parts. Left: A stylized enhancer with a mutation, surrounded by colored blocks representing functional motifs, a neural network diagram, chromatin accessibility signal traces, and a sequence motif. Two cartoon mouse embryos below show different LacZ reporter activity patterns. Top right: A hand hovers anxiously between two red buttons labeled “Experiments” and “AI,” with the caption “HOW DO ENHANCERS REALLY WORK?” Bottom right: A sweating superhero wipes his forehead, looking stressed about the difficult choice.
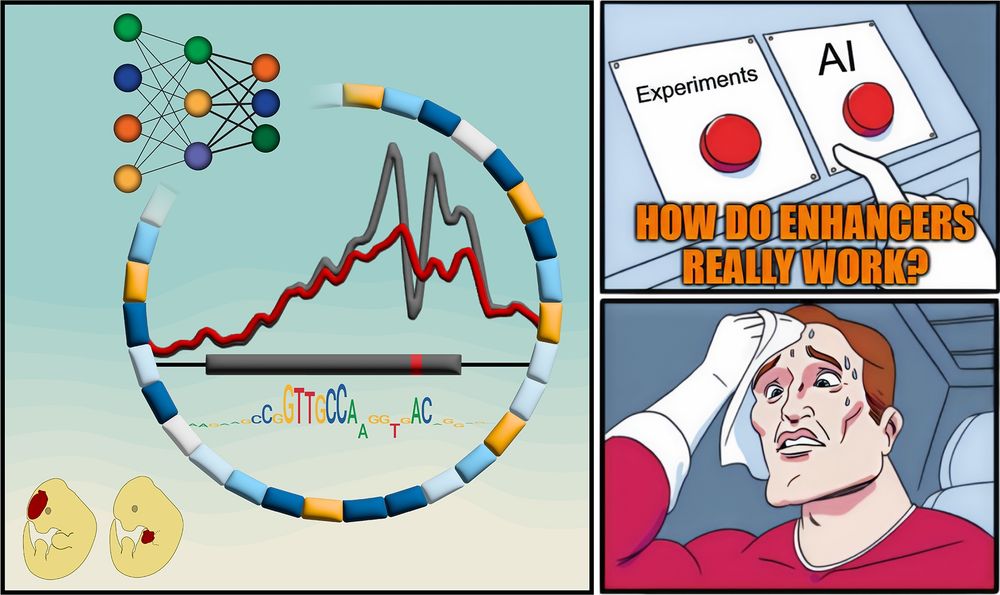
Textbooks: “Enhancers are just a bunch of TFBSs”
But how do they REALLY work?
New paper with many contributors here @berkeleylab.lbl.gov, @anshulkundaje.bsky.social, @anusri.bsky.social
A 🧵 (1/n)
Free access link: rdcu.be/erD22
18.06.2025 17:55 — 👍 161 🔁 77 💬 2 📌 5
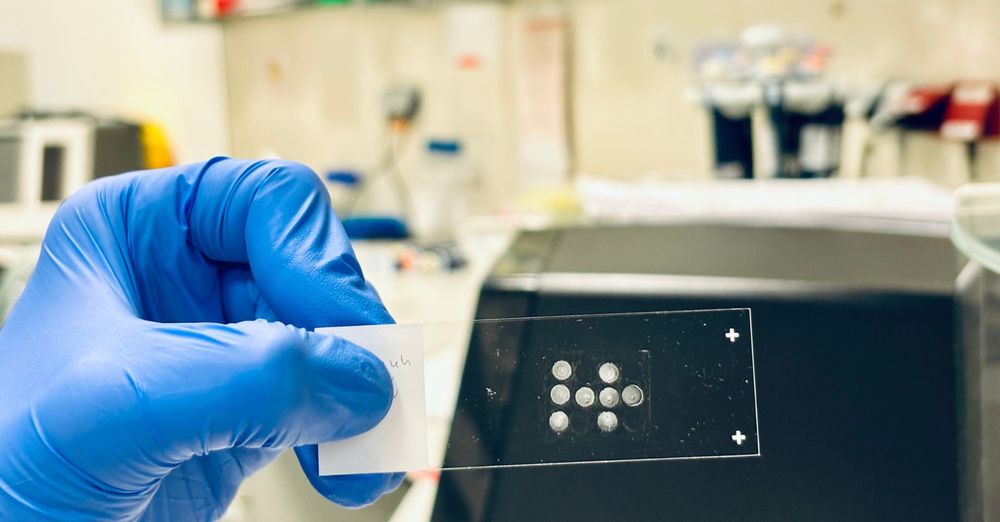
📢New paper out in @cellcellpress.bsky.social!
🔝CNAG revolutionizes single-cell analysis with STAMP — a technique to profile individual cells without sequencing
🔬Developed by an international team from #CNAG, @stjuderesearch.bsky.social, and the University of Adelaide
📎 www.cnag.eu/news/cnag-re...
17.06.2025 15:39 — 👍 9 🔁 3 💬 1 📌 0
Check out our new review with @takashi-namba.bsky.social featured on the cover of Trends in Neurosciences 👇
10.06.2025 17:25 — 👍 5 🔁 4 💬 0 📌 0
As expected, the Sea Surface Temperature Anomaly around western Europe was record high last month (again!).
07.06.2025 12:24 — 👍 93 🔁 46 💬 6 📌 4
=
FINANCIAL TIMES
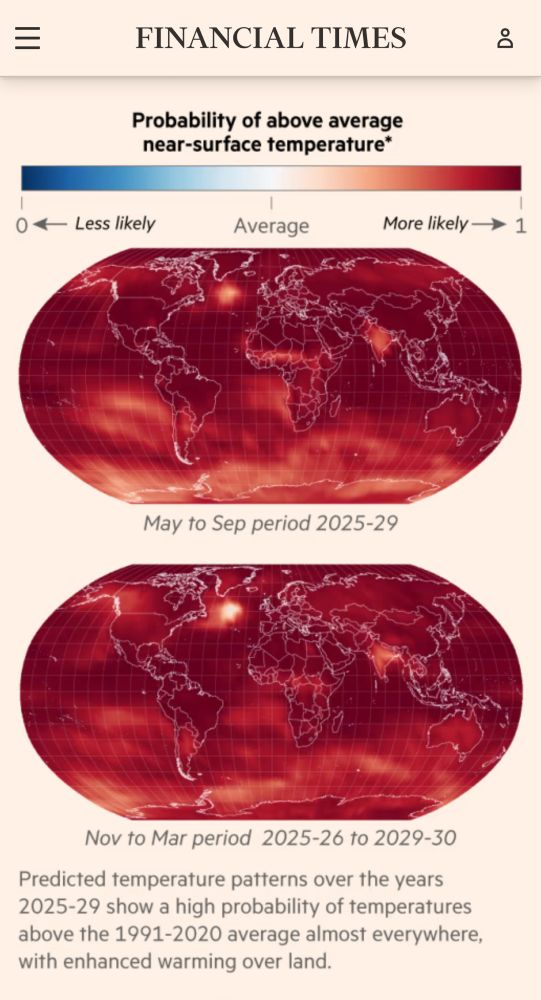
Probability of above average near-surface temperature*
0 4— Less likely
Average
More likely →> 1
May to Sep period 2025-29
Nov to Mar period 2025-26 to 2029-30
Predicted temperature patterns over the years 2025-29 show a high probability of temperatures above the 1991-2020 average almost everywhere, with enhanced warming over land.
Global average temperature is expected to rise to almost 2C above preindustrial in the next five years, according to the WMO, with falls in crop yields and more than a third of the world’s population being exposed to extreme heat.
People, I'm sorry but we have to deal with this. Later is too late.
28.05.2025 11:06 — 👍 1157 🔁 665 💬 48 📌 140
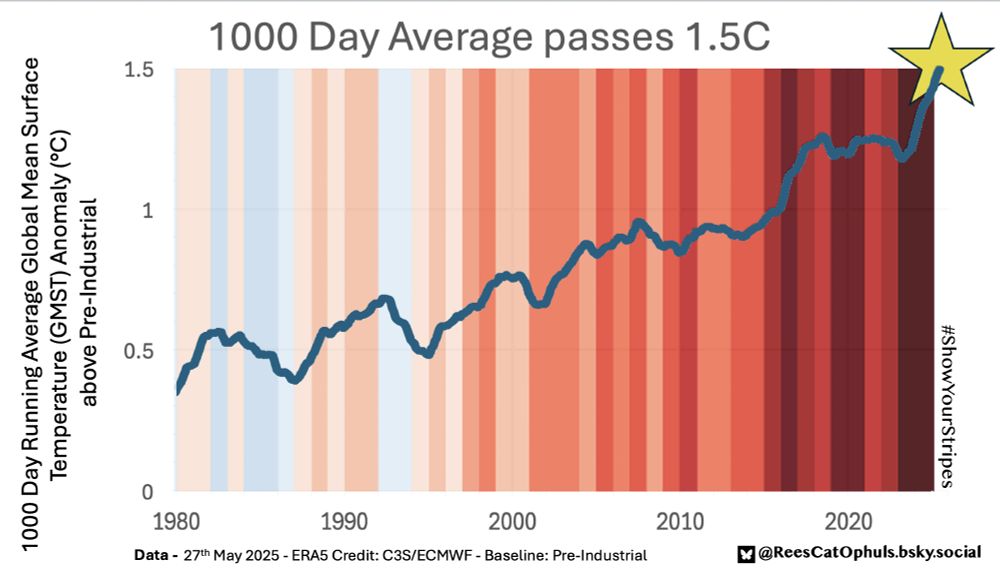
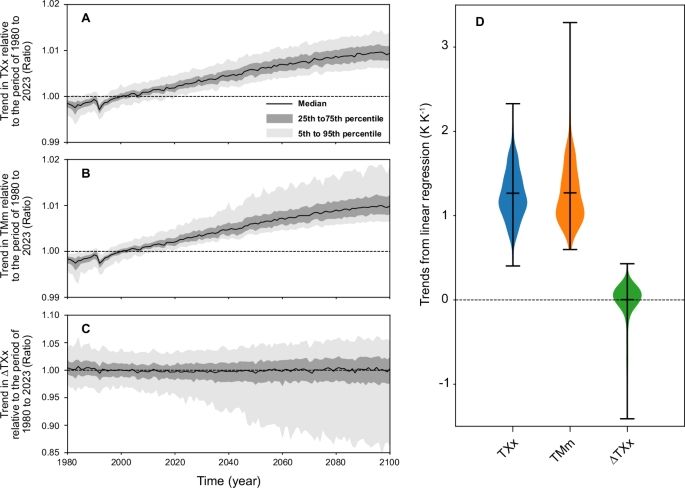
Graphic: 1000-day running average Global Mean Surface Temperature (GMST) anomaly (Copernicus ERA5 data) relative to Pre-Industrial.
Graph is 1980 to May 25th 2025.
Background shows Ed Hawkin's "Show Your Stripes" lines
Source:
https://sites.ecmwf.int/data/climatepulse/data/series/era5_daily_series_2t_global.csv
How to get anomaly relative to Pre-Industrial (1850-1900):
https://parisagreementtemperatureindex.com/copernicus-1850-1900-baseline-daily-gmst/
Sanity Check Sources:
Below are links to Copernicus's website, with gives GMST anomalies for various months/years. If you average them (properly, taking into account number of days that each value represents) ... and add May 2025 values then you get a 1000-day running average crossing 1.5C on 25th May 2025
https://climate.copernicus.eu/surface-air-temperature-september-2022
September 2022 is around 1.2°C above the 1850-1900 level
https://climate.copernicus.eu/surface-air-temperature-october-2022
Oct 2022 is around 1.2°C above the 1850-1900 level
https://climate.copernicus.eu/surface-air-temperature-november-2022
Nov 2022 is around 1.2°C above the 1850-1900 level
https://climate.copernicus.eu/surface-air-temperature-december-2022
Dec 2022 is around 1.2°C above the 1850-1900 level
https://climate.copernicus.eu/copernicus-2023-hottest-year-record
2023 was 1.48°C warmer than the 1850-1900 pre-industrial level
https://climate.copernicus.eu/global-climate-highlights-2024
2024 was ... 1.60°C warmer than the pre-industrial level
https://climate.copernicus.eu/surface-air-temperature-january-2025
Jan 2025 was 1.75°C above the pre-industrial level
https://climate.copernicus.eu/surface-air-temperature-february-2025
Feb 2025 was 1.59°C above the estimated 1850-1900 average
https://climate.copernicus.eu/surface-air-temperature-march-2025
Mar 2025 was 1.60°C above the estimated 1850-1900 average
https://climate.copernicus.eu/surface-air-temperature-april-2025
Apr 2025 was 1.51°C above the estimated 1850-1900 average
1000 Day Running Average crosses 1.5C
Details in Alt Text
#ShowYourStripes @copernicusecmwf.bsky.social
28.05.2025 07:21 — 👍 44 🔁 26 💬 3 📌 5
Terminal Genome Viewer (tgv), written in Rust github.com/zeqianli/tgv
27.05.2025 17:37 — 👍 104 🔁 27 💬 3 📌 5
Evolution, Genetics, Cognitive Science, Language
Developmental neurobiologist using cerebral #organoids to study brain size and evolution. Opinions my own.
Bioinformatics Scientist / Next Generation Sequencing, Single Cell and Spatial Biology, Next Generation Proteomics, Liquid Biopsy, SynBio, Compute Acceleration in biotech // http://albertvilella.substack.com
Interested in gene regulation, epigenetics, neocortex development and evolution
PhD student in the Götz lab - Helmholtz Center Munich.
Interested in adult neurogenesis & heterogeneity of neural progenitor cells🧠🔬
Book lover 📚📚
World citizen, Time and Variation in Brain Development, football, cheese, wine, single malt!
Intergovernmental Panel on Climate Change
Official account of the United Nations Environment Programme
https://www.unep.org/
Visiting Fellow, Oxford Martin School & Leverhulme Centre for Nature Recovery naturerecovery.ox.ac.uk Chair, UK Joint Nature Conservation Committee jncc.gov.uk Former Deputy/Acting Executive Secretary, Convention on Biological Diversity cbd.int #KMGBF
Metge, científic, escriptor, músic. I altres coses.
www.macip.org
Politòleg. Associate Professor. Universitat Pompeu Fabra. Research Fellow LSE.
Postdoctoral researcher at the Institute for Molecular Medicine Finland (FIMM), HiLIFE, University of Helsinki. @fimm-uh.bsky.social
Research, news, and commentary from Nature, the international science journal. For daily science news, get Nature Briefing: https://go.nature.com/get-Nature-Briefing
👨🏻🏫🇫🇮 PhD candidate at University of Helsinki
⚕️ Working at DSGE Lab, FIMM institute
biostatistics | ML in medicine | public health
Executive Director EMBL. I have an insatiable love of biology. Consultant to ONT and Cantata (Dovetail)
Official account of the Max Planck Society. Devoted to basic #research in #physics #astronomy #chemistry #biology #earthsciences #materialscience #mathematics #socialsciences and the #humanities; Imprint: https://www.mpg.de/imprint
Statistician, Computational Biologist
R | Bioconductor | Images are data
https://www.huber.embl.de
Textbook: Modern Statistics for Modern Biology https://www.huber.embl.de/msmb/ (with @sherlockpholmes.bsky.social)