A chart showing how the share of the global population between different poverty lines has changed since 1990. Extreme poverty (defined as being below the International Poverty Line of $3 a day) has decreased from 43% in 1990 to 10% today. Poverty has also decreased at other thresholds. The data source is the World Bank. The chart is licensed CC BY to Our World in Data.
To track progress towards ending extreme poverty by 2030, the United Nations relies on the World Bank to estimate the share of people living below a certain threshold, called the International Poverty Line (IPL).
28.08.2025 13:56 — 👍 50 🔁 16 💬 2 📌 2

A line chart showing the global number of people living in extreme poverty. Extreme poverty is defined as living below the International Poverty Line (IPL), which is $2.15 per day in 2017 prices (shown as a red line on the chart) and $3 per day in 2021 prices (shown as a blue line).
125 million people who would not have been counted as extremely poor before June 2025 (when the IPL was raised to $3 per day) are now included.
This data is adjusted for inflation and for differences in living costs between countries. The data source is the World Bank (2024 and 2025). The chart is CC BY Our World in Data.
✍️ New article: “$3 a day: A new poverty line has shifted the World Bank’s data on extreme poverty. What changed, and why?” 🧵
11.08.2025 15:52 — 👍 63 🔁 20 💬 1 📌 2
OWID maps recently got a revamp. A key improvement: it’s now much easier to zoom and explore on mobile. Select a country or region, then pinch and pan to dive in 🪄
Fantastic work by @sophiamersmann.bsky.social and the team!
In this video @parriagadap.bsky.social gives a quick demo
04.07.2025 20:34 — 👍 12 🔁 2 💬 0 📌 0
It's very cool to see how they show up in the sky. We were tracking with the Aurora app, but we were unlucky the first day (cloudy) and on the second day they showed up. They were not in their biggest intensity, but we could see pale greens and different shapes.
23.03.2025 09:30 — 👍 1 🔁 0 💬 1 📌 0
I saw in Iceland on Friday!
23.03.2025 08:59 — 👍 1 🔁 0 💬 1 📌 0
I look at democracy data for a living, and the US indeed seems to be in a constitutional crisis right now - but this move by Polity makes me take it less seriously, not more.
Here’s why:
12.02.2025 19:13 — 👍 35 🔁 18 💬 1 📌 4

A world map illustrates the share of the population living in multidimensional poverty, defined as deprivation in health, education, and living standards. The map employs varying shades of purple and pink to indicate the percentage of the population affected by multidimensional poverty in different countries.
In many countries, more than half of the population faces poverty in multiple dimensions.🧵
ourworldindata.org/data-insights
Data insight w/ @parriagadap.bsky.social
14.01.2025 12:04 — 👍 2 🔁 1 💬 1 📌 0

Miremos los datos de los "mejores puntajes" con una perspectiva diferente al tradicional "ranking"
Si ordenamos de menor a mayor a todos los estudiantes recién egresados que rindieron la prueba de Lenguaje + Matemática según su puntaje y los agrupamos en 10 grupos, tenemos 10 deciles.
1/
09.01.2025 03:31 — 👍 108 🔁 84 💬 15 📌 11

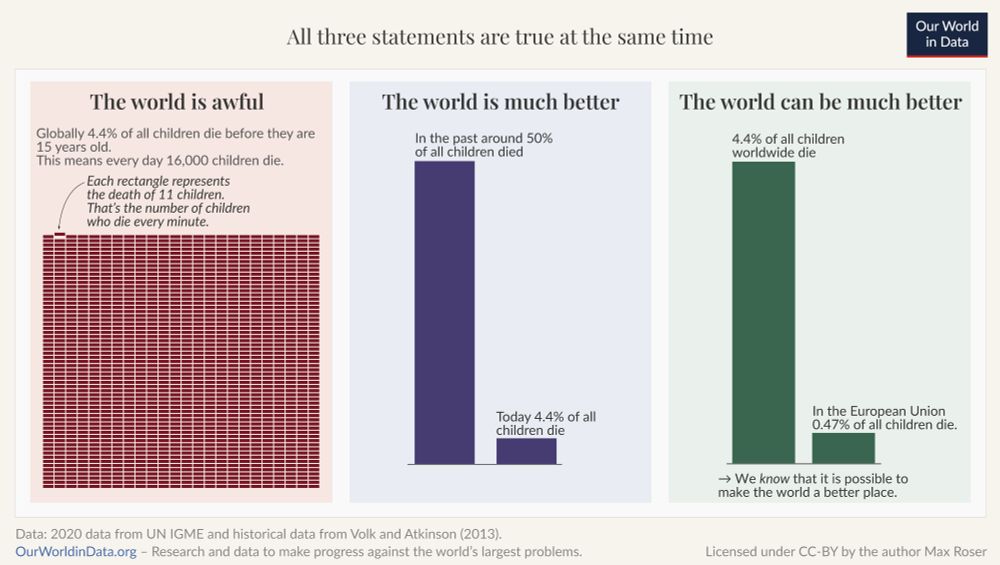
A chart in three parts showing data on child mortality to make the points that "The world is awful. The world is much better. The world can be much better. All three statements are true at the same time."
The world is awful. The world is much better. The world can be much better.
All three statements are true at the same time. Understanding this is key to solving big global problems.
We believe data & research can help us understand both the problems we face & the progress that’s possible. 🧵
10.12.2024 13:05 — 👍 1234 🔁 415 💬 13 📌 40
At @ourworldindata.org, we’ve just launched new data download options and a Chart Data API to make it even easier to access and reuse the data on our site! Here’s a quick overview of what’s new: 🧵
21.11.2024 10:13 — 👍 180 🔁 48 💬 7 📌 7
Welcome to the official account of the School of Public Policy. The SPP equips you with the skills and ideas to transform people and societies. Follow for news, public events & more. lse.ac.uk/spp
Formerly @Vox.com
(I am not on twitter/X)
Making sense of it all. Become a member today. 👇
https://voxdotcom.visitlink.me/z3EPda
OPHI is a global research centre based at the University of Oxford working on multidimensional poverty measurement and analysis.
Economist at University of Barcelona (@ubeconomics.bsky.social) and working with @ophioxford.bsky.social | research on multidimensional poverty, subj wellbeing, labor | own views.
https://nsuppa.info
Professor, Harris School of Public Policy, Director, Stone Center for Research on Wealth Inequality and Mobility, University of Chicago
LIS is a research center facilitating cross-national microdata analyses.
LIS is home to the ex-post harmonised Luxembourg Income Study (LIS) & Luxembourg Wealth Study (LWS) Databases.
https://www.lisdatacenter.org/
Periodista, podcaster y profe. Leo revistas en la tempestad. Aquí no trabajo, solo vengo a alumbrar y opinar a la pasada... igual que ud.
The Department of Social Policy provides top quality international and multidisciplinary research and teaching on social and public policy challenges facing countries across the world.
➡️ www.lse.ac.uk/social-policy
Periodista. Veo tele. Cree www.mujeresbacanas.com.
Hoy escribo de y sobre género y la vida misma en The Clinic.
Husband, father and Mayor of the greatest city in the world. He/Him.
1) Income inequality; 2) Politics; 3) History; 4) Soccer.
Author of "Global inequality" and "Capitalism, Alone" (2019).
Stone Center, CUNY; LSE, London


