

The #income-#health gradient among working-age adults in the United States in areas with high vs. low economic opportunity
@oppforhealthlab.bsky.social
The #income-#health gradient among working-age adults in the United States in areas with high vs. low economic opportunity
@oppforhealthlab.bsky.social

Results show a marked relationship between increases in local wealth inequality and reduced mobility for children in the lower half of the income distribution.
27.02.2026 12:33 — 👍 4 🔁 3 💬 0 📌 0
⚠️ New WP ⚠️ with @ftorche.bsky.social: Can childhood exposure to local wealth inequality help explain growing class gaps in income mobility? Short answer: Yes! Read the full answer here: doi.org/10.31235/osf... #Demography #Sociology #EconSky
27.02.2026 12:33 — 👍 28 🔁 7 💬 1 📌 1
postdoctoral associate at Princeton ad
New Postdoctoral Research Associate positions at @Princeton's Office of Population Research!
17.02.2026 18:08 — 👍 21 🔁 29 💬 1 📌 0!!!!!!
12.02.2026 02:44 — 👍 1 🔁 0 💬 0 📌 0
Welcome to the Dynamic Democracy App This app lets you manipulate, explore, and download the Dynamic Democracy datasets with information on state policies and public opinion assembled by Devin Caughey and Chris Warshaw. Click on the triangle next to each category for more details. • State Policies: This dataset includes information on approximately 200 policies in place in at least one state between 1936 and 2024. • State Policy Ideology : Measures summarizing aggregate policy outputs in each state/year between 1936-2024. • Public Opinion: Measures summarizing state publics views on approximately 80 issues, covering 1936-2024. • Mass Ideology.: Measures of state publics' economic and cultural ideological preferences, 1936-2021. • Policy Proximity.: Measures of how closely state policies match public preferences.
🚨 the best state policy & public opinion database is now online. ~200 (!!!) state policies and 80 public opinion series on abortion, labor, taxes, environment, guns, education…
dynamicdemocracy.shinyapps.io
Massive public goods provision from @devincaughey.bsky.social & @chriswarshaw.bsky.social

New interactive map from @CenterOnBudget showing out-of-pocket premium increases in every congressional district due to premium tax credit enhancements expiring. Explore it here: www.cbpp.org/research/hea...
13.11.2025 22:14 — 👍 10 🔁 10 💬 2 📌 0
1/ New paper w/ @rourkeobrien.bsky.social, @clowenstein.bsky.social, and Elizabeth Bair showing how the Voting Rights Act had starkly different effects on #mortality by race and age -- and the potential importance of #status #threat in explaining these findings.
www.nber.org/papers/w34421
Yale Sociology is hiring an associate or full professor in quantitative sociology. Come work with me! Applications open tomorrow. Details available here:
apply.interfolio.com/174709

I never planned on writing a book. Few demographers do. But 9yrs ago, I unearthed a puzzling finding that upended everything I thought I knew about race and family structure. And I knew I had to share it with the world.
Check out this video to learn more: www.tiktok.com/t/ZP8BxtCBd/
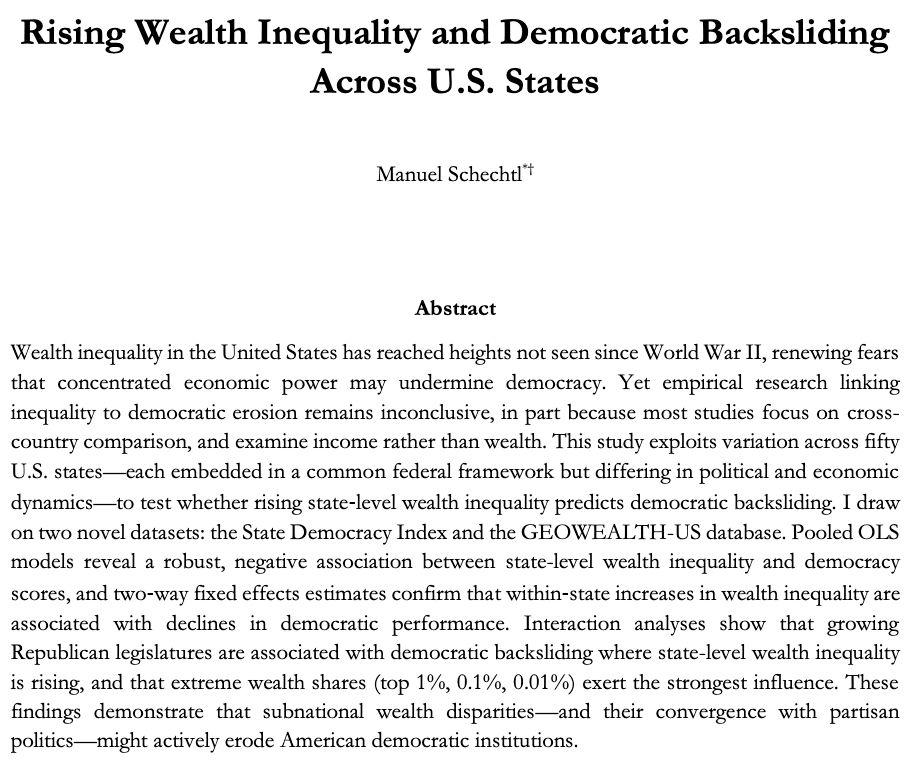
⚠️ New timely WP ⚠️ Rising wealth inequality and democratic backsliding at the US state-level #EconSky #Sociology #PolicySky
@stone-lis.bsky.social WP here: doi.org/10.31235/osf...
**Call for Papers**
The Advances in Social Genomics Conference Series (TAGC)
May 14-16, 2025
UW-Madison @uwmadison.bsky.social
Deadline for submissions: March 7, 2025
Funding available for presenters
Keynotes: Kelly Bakulski and Dan Belsky
isg.wisc.edu/events/the-a...
Thanks @glebeda.bsky.social for pulling this list together!
Consider this a bat signal for population health scientists everywhere... let's GOOOOO. go.bsky.app/FP7rYaJ
Thanks Janet! 🙏
14.01.2025 12:22 — 👍 0 🔁 0 💬 0 📌 0
The GC Wealth Project - an invaluable source for data and research on wealth and wealth-related policies - continues to grow. Check out the latest expansion and update!
@stone-lis.bsky.social @morellisal.bsky.social 👇👇👇
Sure! The estimate is small, esp net of covars; tho if there was a massive change to fiscal structure those measures (e.g., dispersion of HH poverty) would change as well.
Depends on spending LEVEL, too -- centralizing an area with low spending would do little to reduce spatial variation...
thanks!! hope you are well!
09.01.2025 18:57 — 👍 0 🔁 0 💬 0 📌 0👋 yep: 1SD in FC index associated with 10% SD change in mobility COV (so 0.1 * .04)
09.01.2025 18:30 — 👍 1 🔁 0 💬 1 📌 0
Child poverty in the U.S. is four times as likely to lead to adult poverty than in Denmark and Germany, and twice as likely than in the UK and Australia. Why? I write about our findings on "the intergenerational persistence of poverty" today in The Atlantic:
www.theatlantic.com/ideas/archiv...
🙏
07.01.2025 17:27 — 👍 0 🔁 0 💬 0 📌 0Thanks, Frank! And...agreed!
07.01.2025 16:45 — 👍 1 🔁 0 💬 0 📌 0ah thank you Sasha, very kind! 🙏
07.01.2025 16:23 — 👍 0 🔁 0 💬 0 📌 0
Overall we argue that the 'fiscal structures' we inherit from the past are key to understanding contemporary variation in social outcomes.
Especially in the U.S. which has a remarkably complex system of public finance + unlike other federal countries, lacks a national fiscal equalization policy.
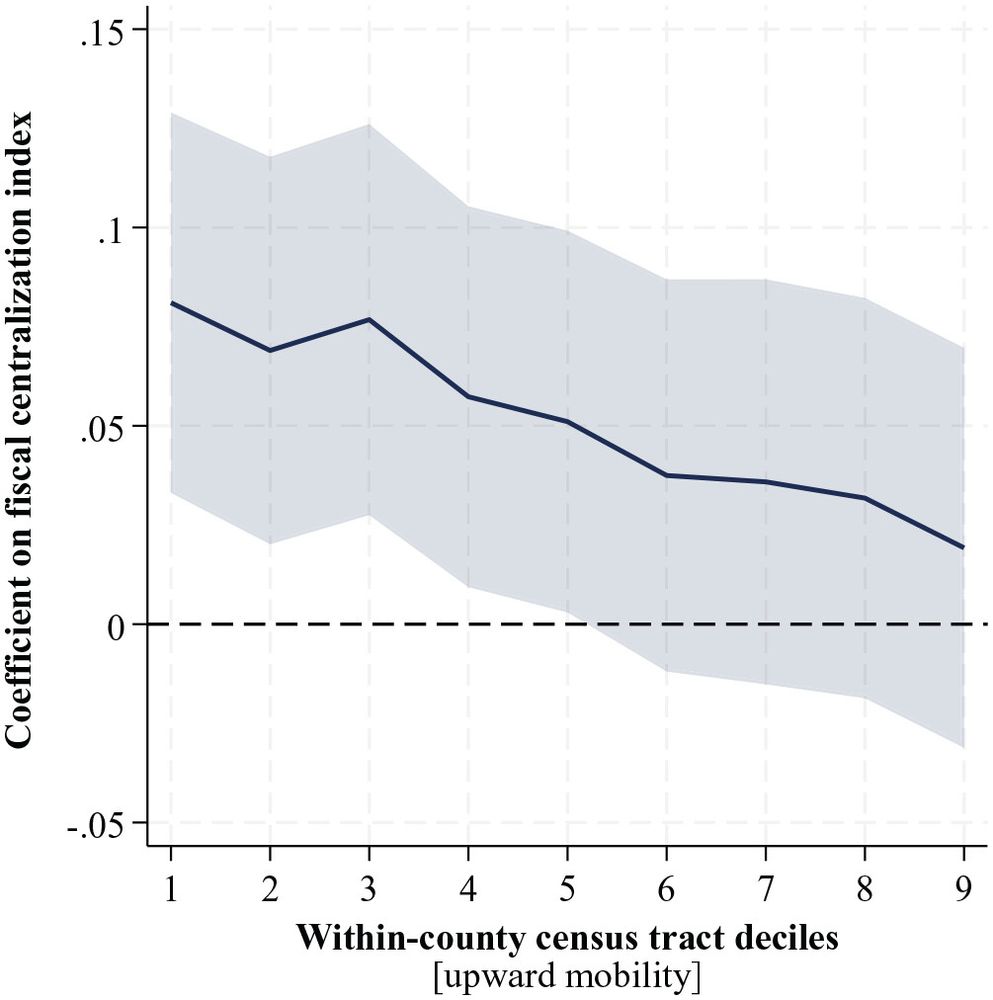
We go on to show that fiscal centralization reduces spatial inequality in mobility outcomes by "leveling up" the worst performing census tracts in a county.
07.01.2025 16:17 — 👍 8 🔁 0 💬 1 📌 0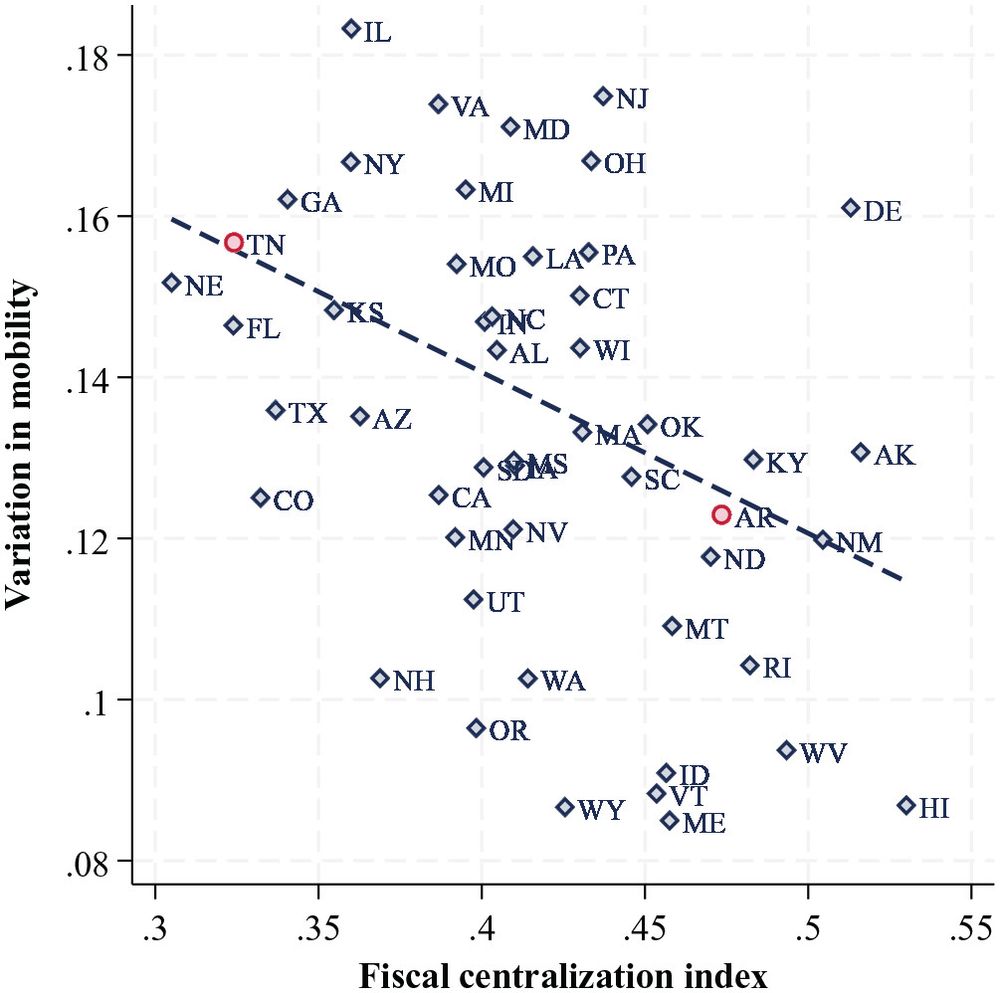
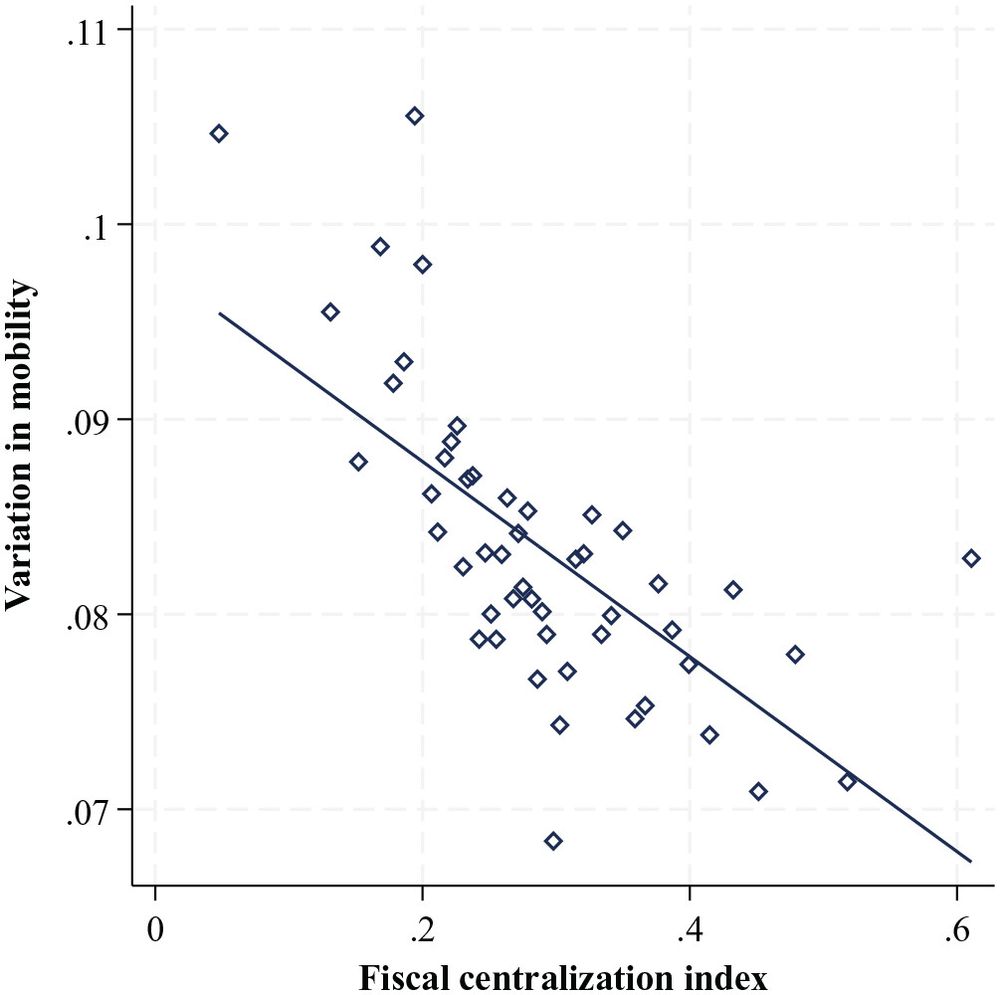
We find there is indeed less place-based inequality in economic mobility outcomes in more centralized fiscal structures.
This association is apparent at both the state and local (county) levels.
We use data from Opportunity Insights to estimate the degree of cross-census-tract inequality (variation) in the economic mobility outcomes of low-income (p25) children within each state and within each county.
We measure Fiscal Centralization for each state and each county using a novel index.
In the study we hypothesize that more centralized fiscal structures will exhibit less spatial inequality (variation) in the economic mobility outcomes of low-income children.
Why? Many reasons. One: where government is more centralized, less variation in intensity of public sector across places.
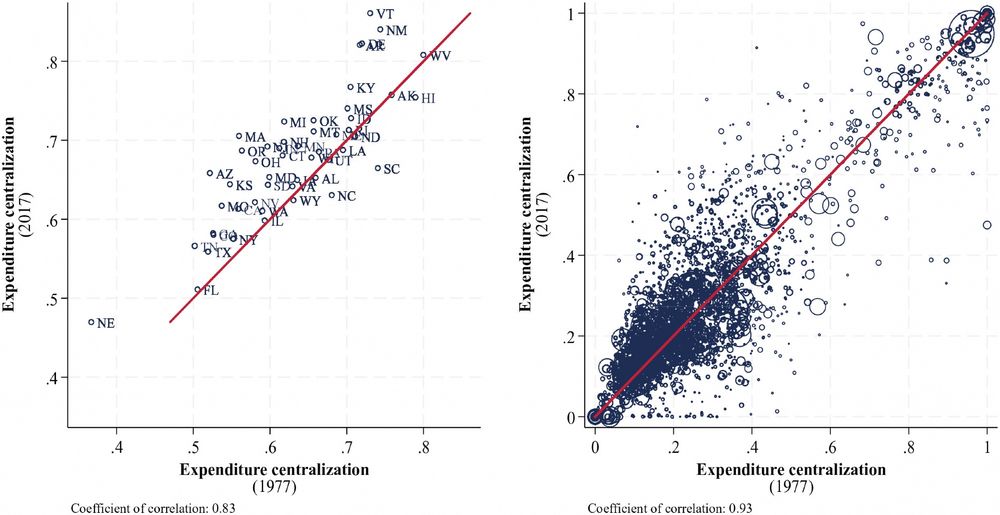
County area fiscal centralization is similarly sticky.
Here we show state and county centralization has changed little from 1977 to 2017, despite rise of inequality between households and between places.
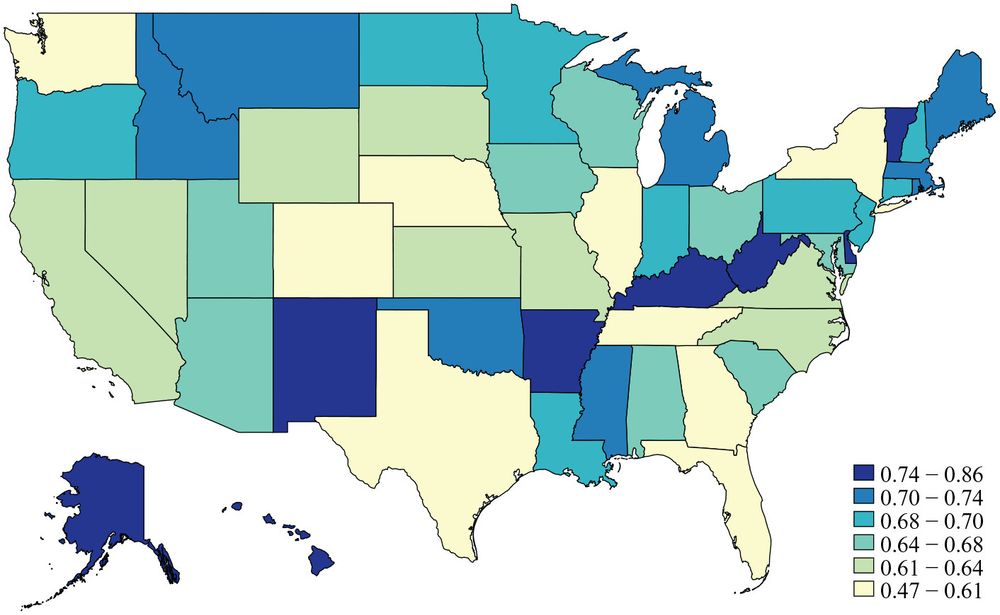
Notice wide variation in the fiscal centralization of the 50 states - does not map on to contemporary differences in politics or sociodemographics or economies.
For example, stark difference in the centralization of neighboring states AR and TN we trace to origins in 18th & 19th century
State fiscal centralization is the fraction of all fiscal action in a state performed by the state gov vs counties/cities/towns/districts.
County area fiscal centralization is the fraction of all fiscal action in a county area performed by the county government vs cities/towns/districts.