Watercolor painting with two aerial views of Mount St. Helens. At upper right, the pre-1980 snowcapped cone rises above green, forested ridges and a blue Spirit Lake. Filling most of the image, the post-eruption scene shows a low, blasted crater, brown landslide hummocks, and a dark, debris-filled lake.
Dee Molenaar / U.S. Geological Survey (USGS)
#MSH45 | Watercolors
One of the most powerful “before and afters” of Mount St. Helens isn’t a photo at all, it’s this watercolor.
Legendary PNW mountaineer Dee Molenaar painted the graceful pre-1980 cone and Spirit Lake basin alongside the torn-open crater and devastated landscape that followed.
09.12.2025 20:46 — 👍 90 🔁 32 💬 2 📌 1
Thanks! I used Quick Terrain Modeler for the 3D layer rendering. I didn’t warp the terrain at all.
24.07.2025 00:08 — 👍 3 🔁 0 💬 1 📌 0
Thank you Daniel—I appreciate it!
23.07.2025 05:05 — 👍 0 🔁 0 💬 0 📌 0
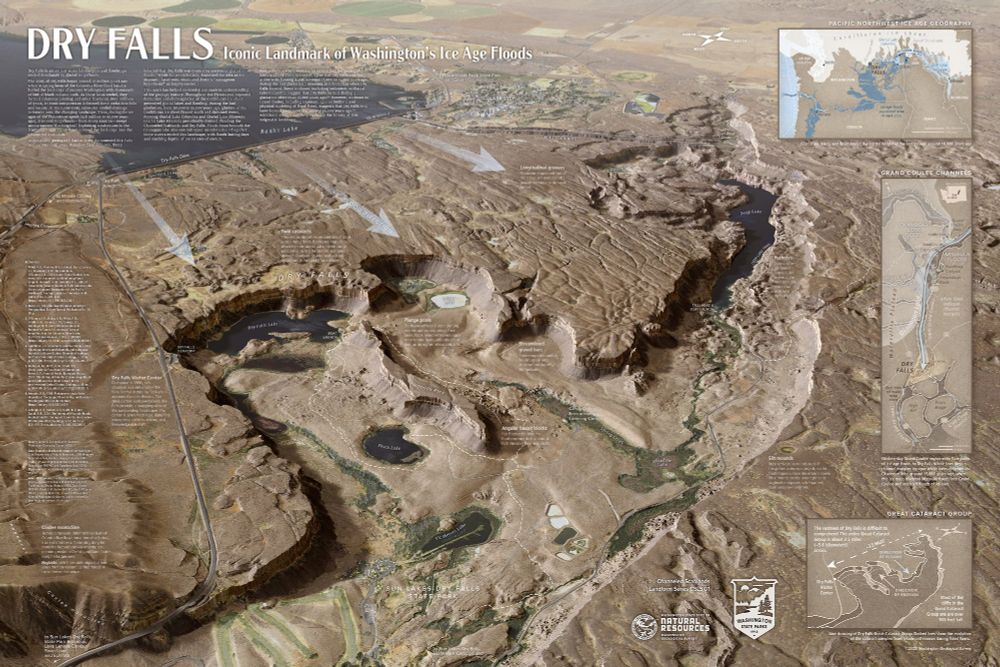
Map of Dry Falls in Washington State's Channeled Scablands
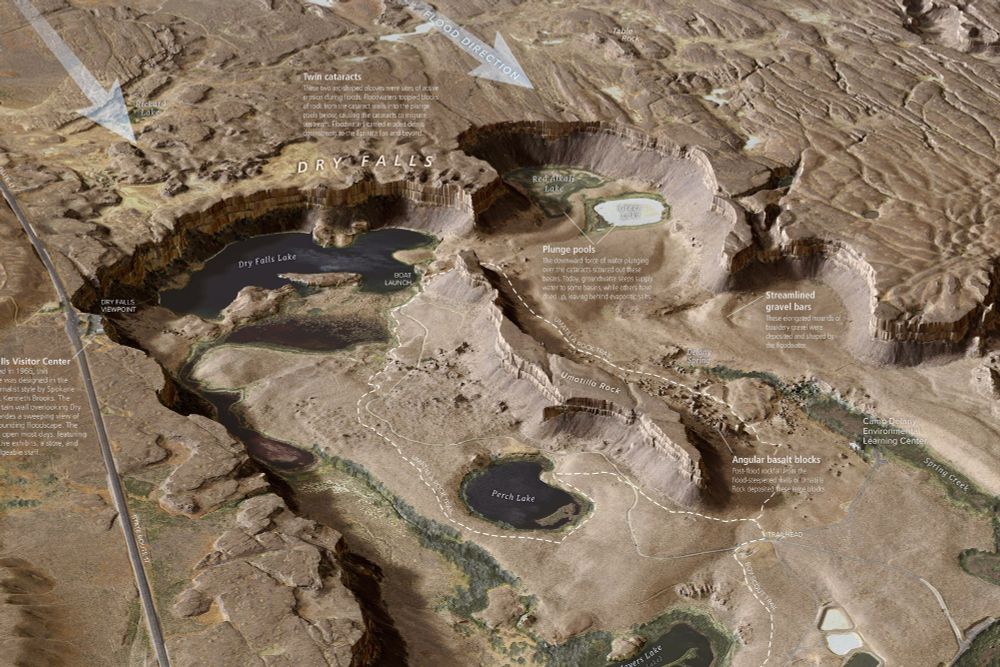
Detailed view of Dry Falls map from Washington State's Channeled Scablands
New, super-detailed Dry Falls interpretive map from the Washington Geological Survey. #iceagefloods #missoulafloods #channeledscablands #geomorphology washingtonstategeology.wordpress.com/2025/07/15/n...
23.07.2025 04:26 — 👍 57 🔁 15 💬 4 📌 3
YouTube video by Nick Zentner
Daniel Coe & Joel Gombiner - Washington Geological Survey
@joelgombiner.bsky.social and I had a conversation with Nick Zentner yesterday about our upcoming WGS #DryFalls map. Looking for feedback before publishing. #iceagefloods #missoulafloods #geomorphology youtu.be/v01cycrCgno
29.05.2025 16:15 — 👍 9 🔁 1 💬 0 📌 0
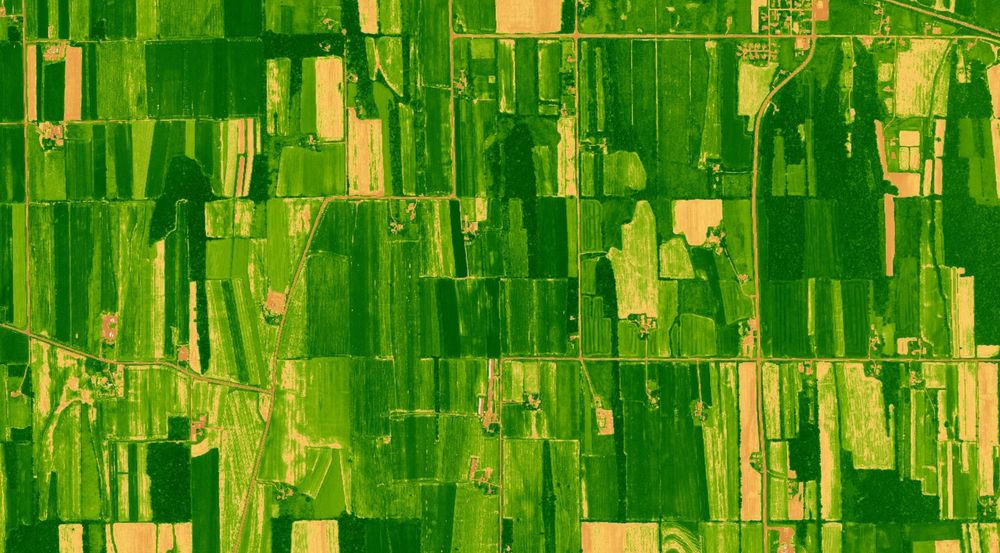
Agricultural land with many long narrow fields shaded various colors from green to yellow, indicating the normalized difference vegetation index of vegetation greenness. Fields are oriented north-south parallel to drumlins and ice sheet flow direction.
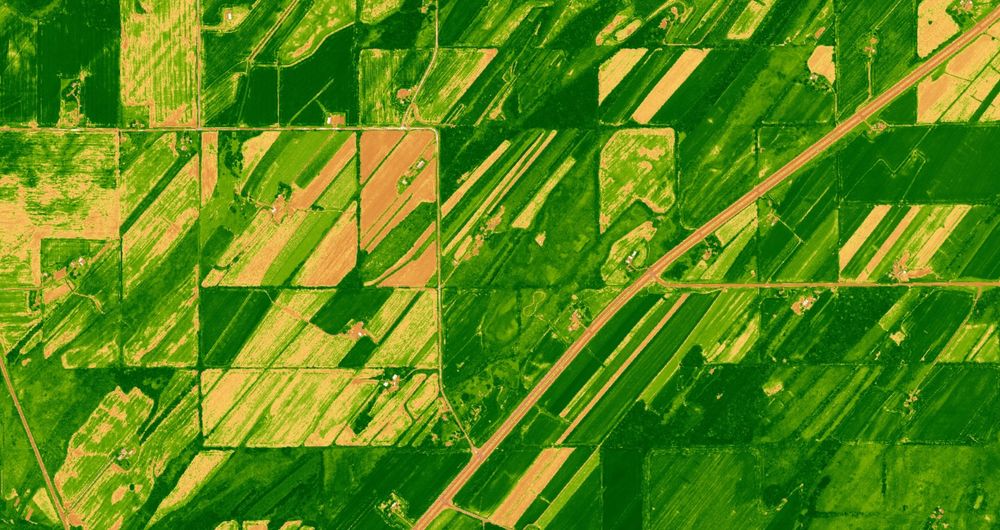
Agricultural land with many long narrow fields shaded various colors from green to yellow, indicating the normalized difference vegetation index of vegetation greenness. Fields are oriented northeast-southwest parallel to drumlins and ice sheet flow direction.
Drumlinized land use, shaded by NDVI. Fields with various degrees of vegetation greenness, oriented parallel to drumlin long axes reflecting two different ice flow directions across the Green Bay Lobe, southern Wisconsin.
03.04.2025 01:07 — 👍 56 🔁 8 💬 4 📌 0
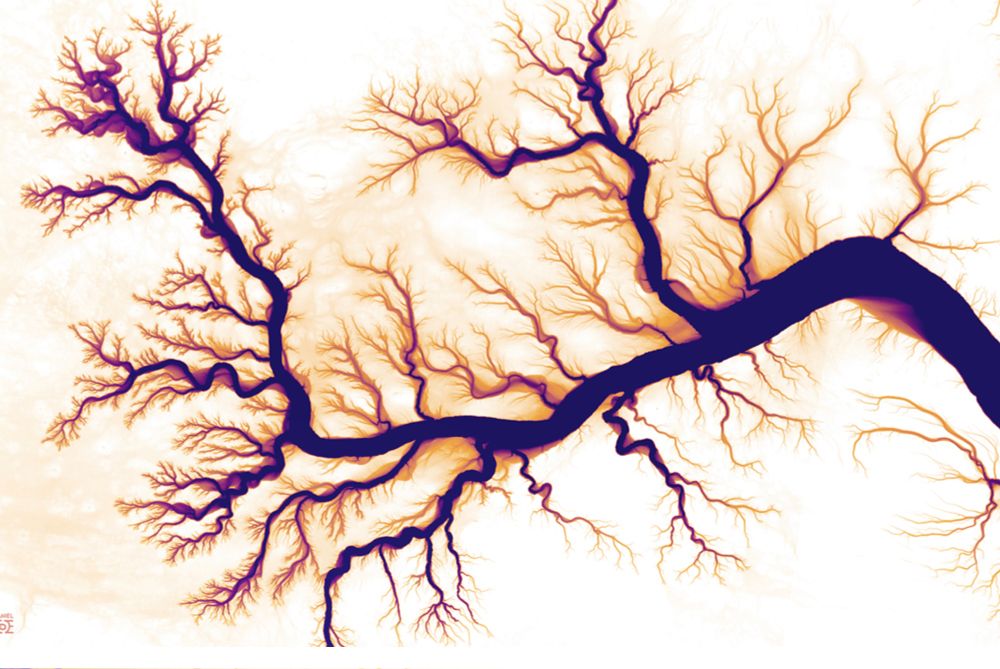
The colors are a DTM blended with an REM. The scarp looks amazing with just the DTM colors applied but the REM brought out the river details as well.
19.01.2025 16:54 — 👍 2 🔁 0 💬 0 📌 0
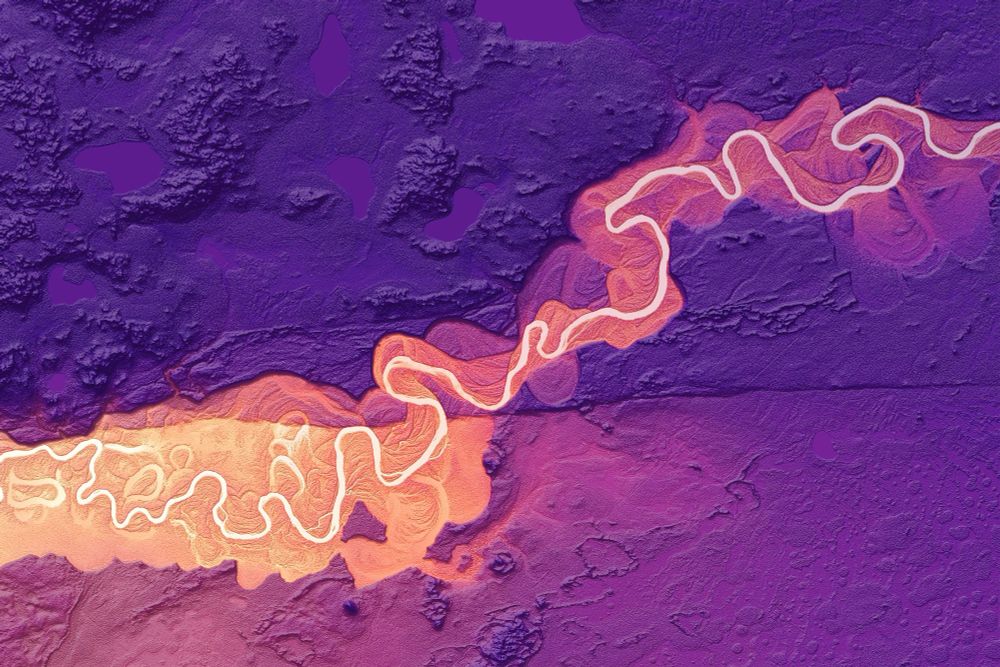
Lidar-derived color elevation image of the Castle Mountain Fault scarp cutting across the Little Sustina River.
Castle Mountain Fault scarp cutting across the Little Susitna River about 50km north of Anchorage, #Alaska. #lidar #geomorphology #faultscarp
19.01.2025 08:01 — 👍 95 🔁 29 💬 4 📌 2
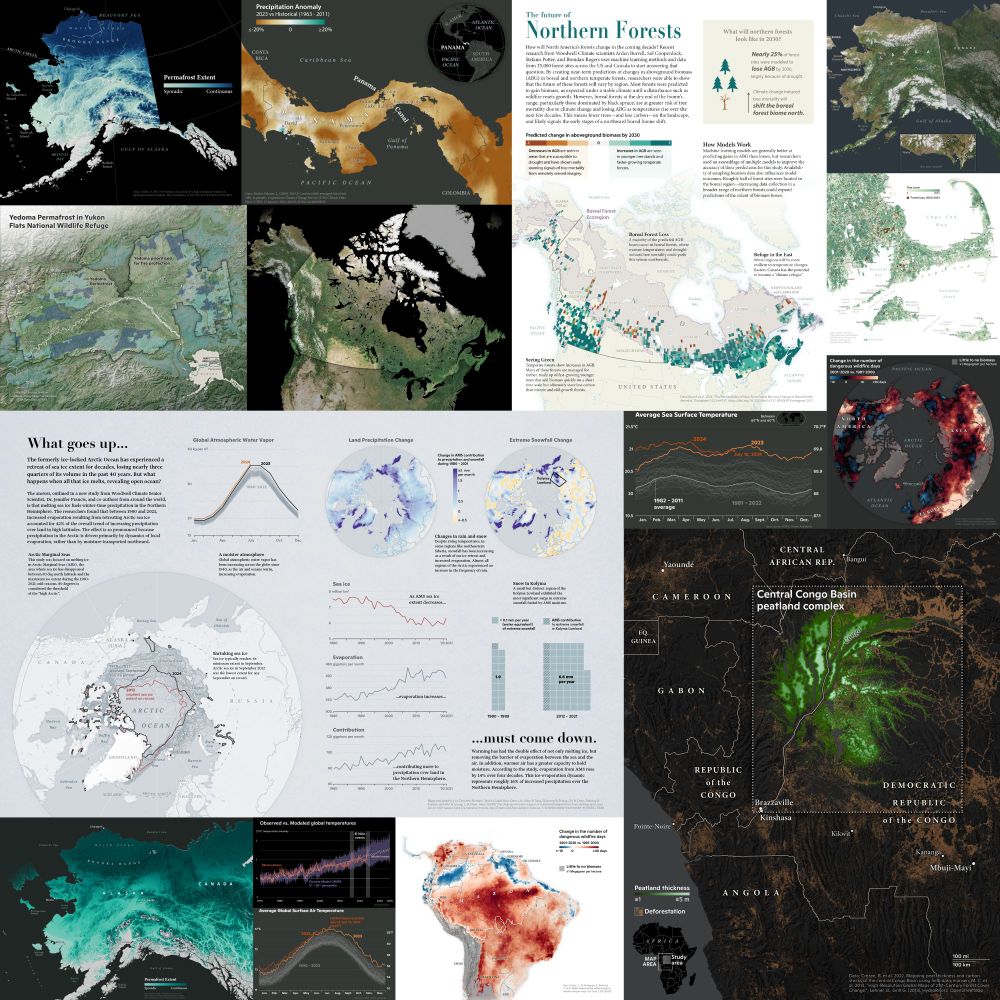
A collage of maps that Christina made in 2024. Topics include permafrost, boreal forests, wildfire, peatlands, and drought.
A few of the maps and graphics I made in 2024. What climate maps do you want to see next year?
31.12.2024 18:45 — 👍 102 🔁 22 💬 9 📌 1
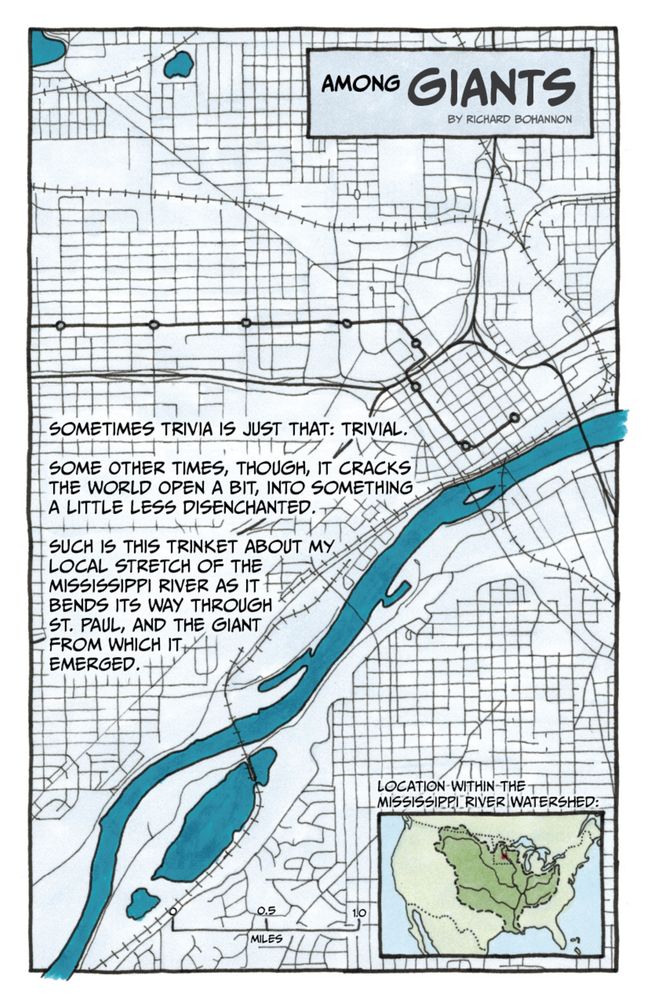
Sometimes trivia is just that: trivial.
Some other times, though, it cracks the world open a bit, into something a little less disenchanted.
Such is this trinket about my local stretch of the Mississippi River as it bends its way through St. Paul, and the giant from which it emerged.
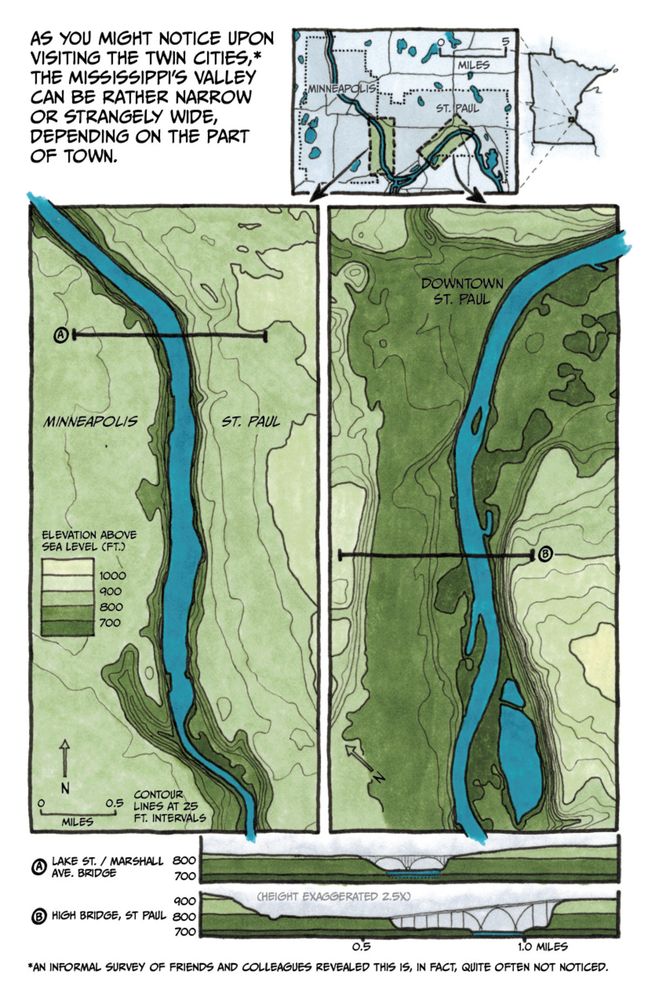
As you might notice upon visiting the Twin Cities, the Mississippi’s valley can be rather narrow or strangely wide, depending on the part of town.
(An informal survey of friends and colleagues revealed this is, in fact, quite often not noticed.)
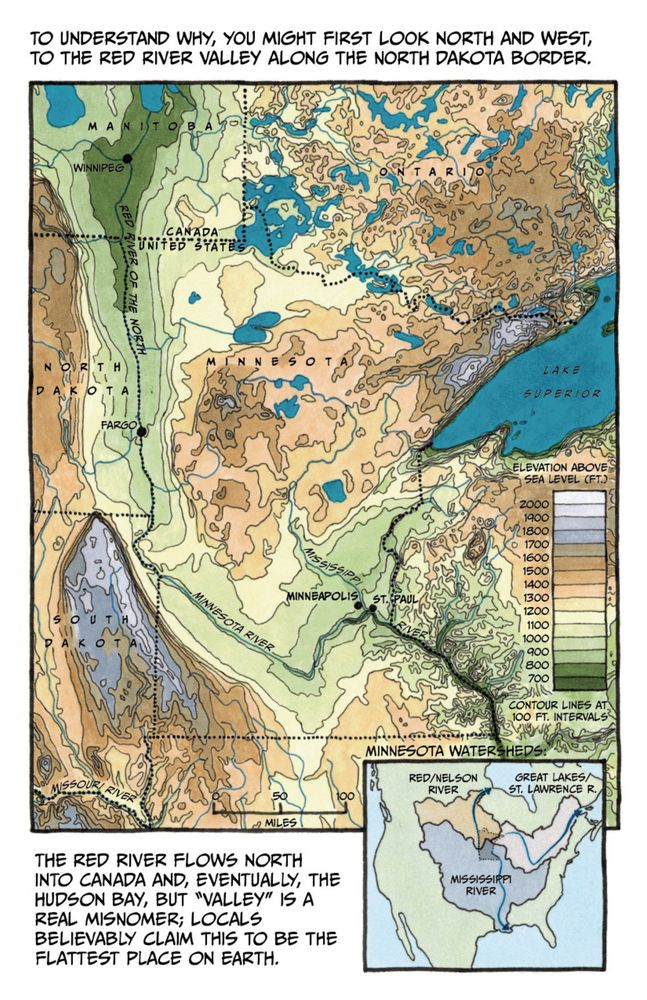
To understand why, you might first look north and West, to the Red River Valley along the North Dakota border.
The Red River flows north into Canada and, eventually, Hudson Bay, but “valley” is a real misnomer; locals
believably claim this to be the flattest place on earth.
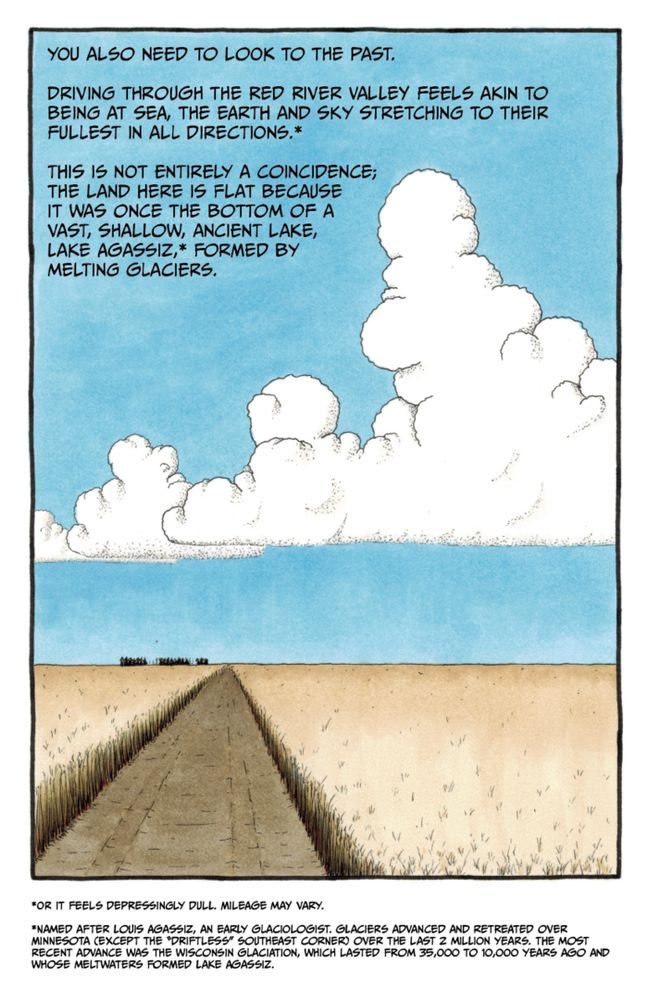
You also need to look to the past.
Driving through the Red River Valley feels akin to being at sea, the earth and sky stretching to their fullest in all directions.*
This is not entirely a coincidence; the land here is flat because it was once the bottom of a vast, shallow, ancient lake, Lake Agassiz, formed by melting glaciers.
(*Or it feels depressingly dull. Mileage may vary)
Among Giants: A Brief Hydrological History of the Upper Midwest: https://streets.mn/2024/12/20/among-giants-a-brief-hydrological-history-of-the-upper-midwest/
20.12.2024 13:00 — 👍 152 🔁 38 💬 12 📌 15
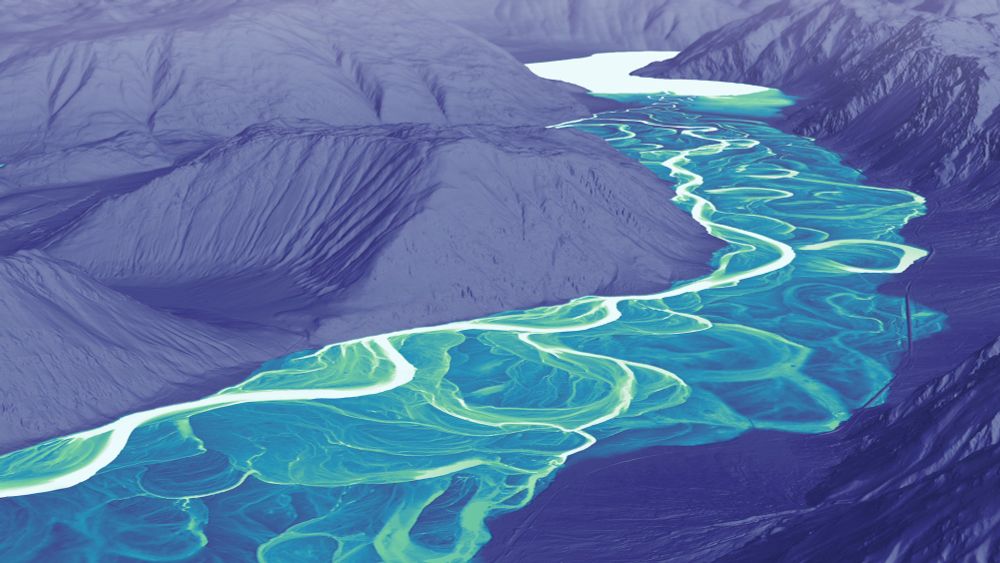
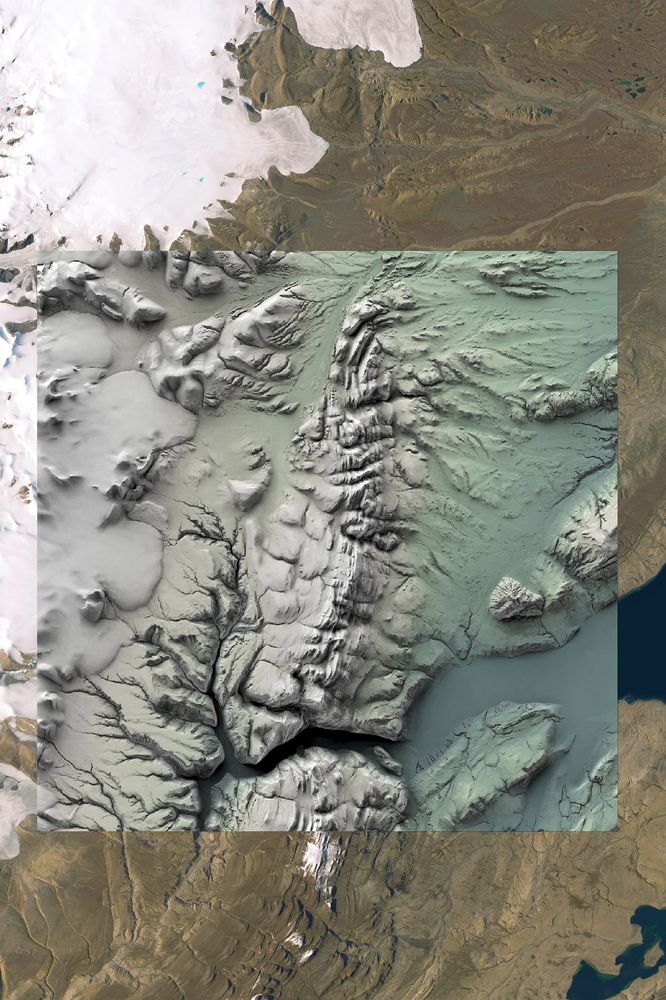
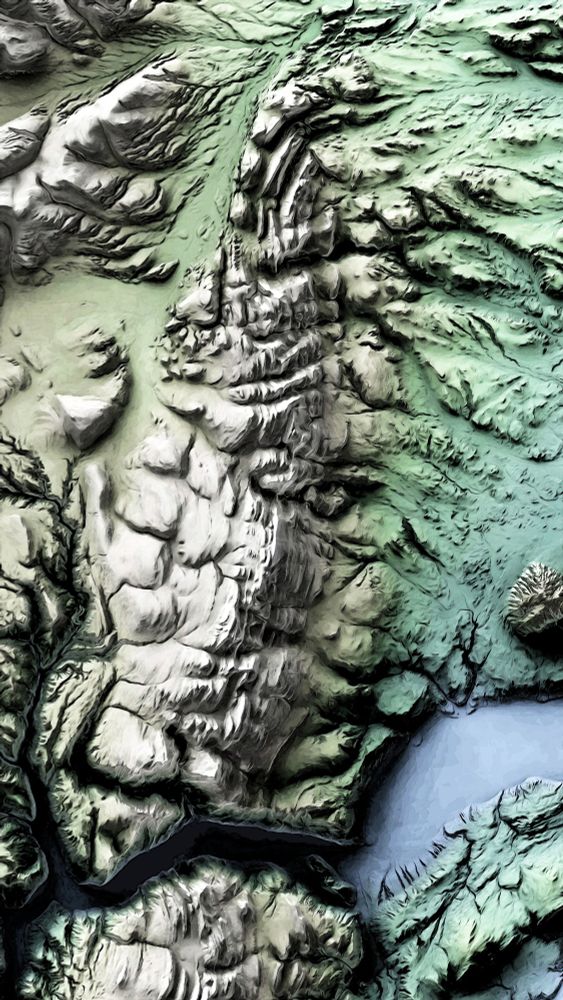
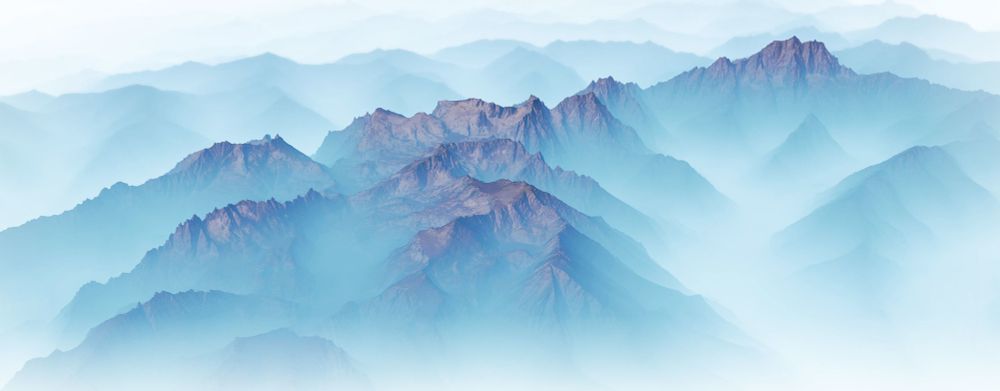
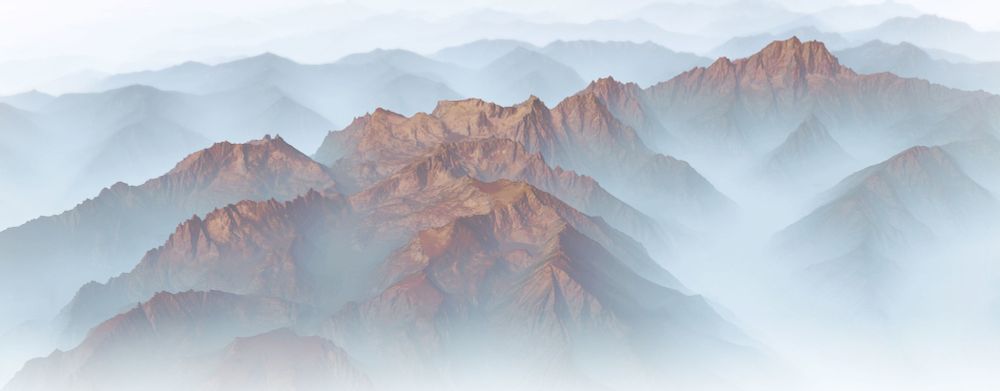
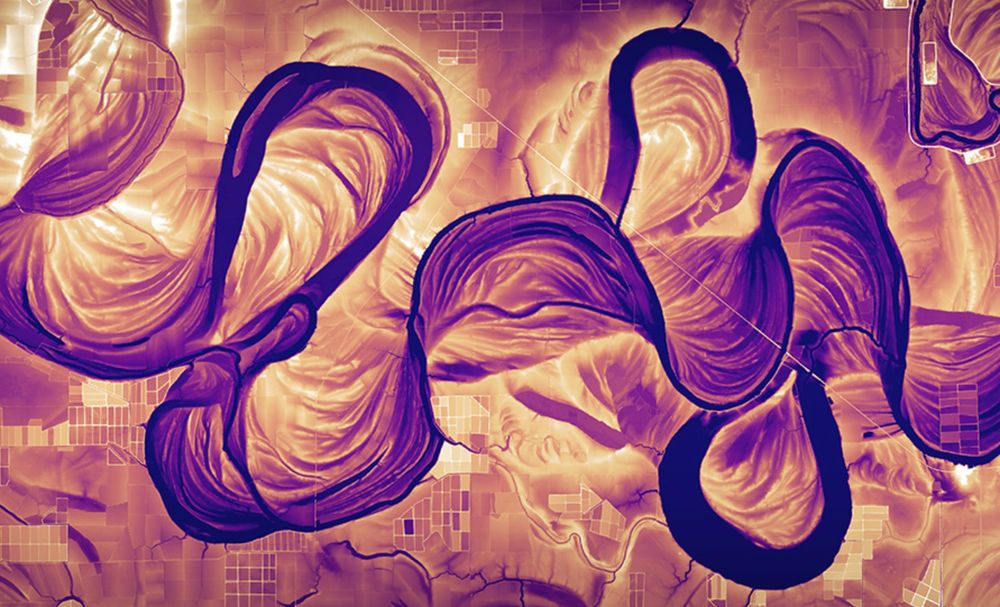
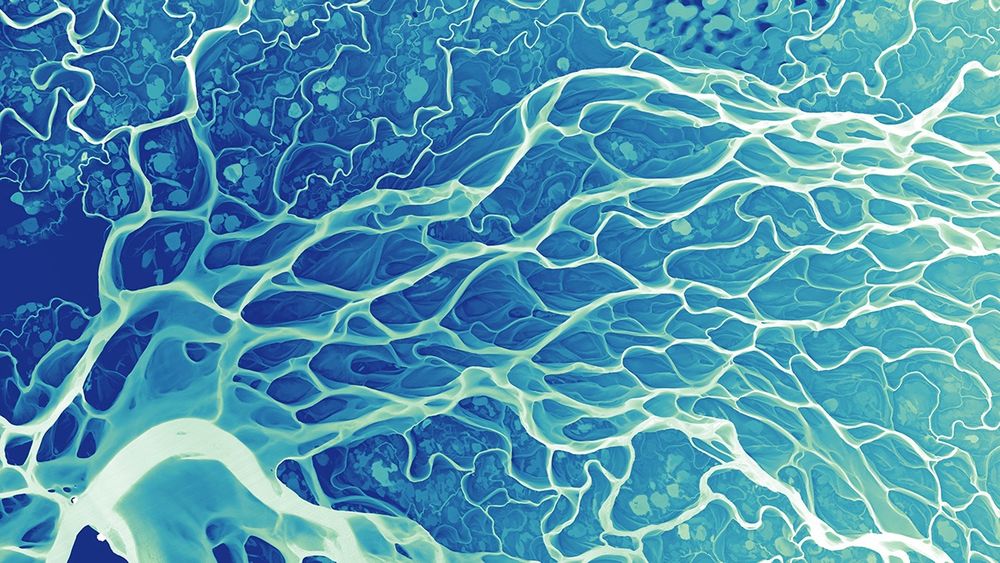
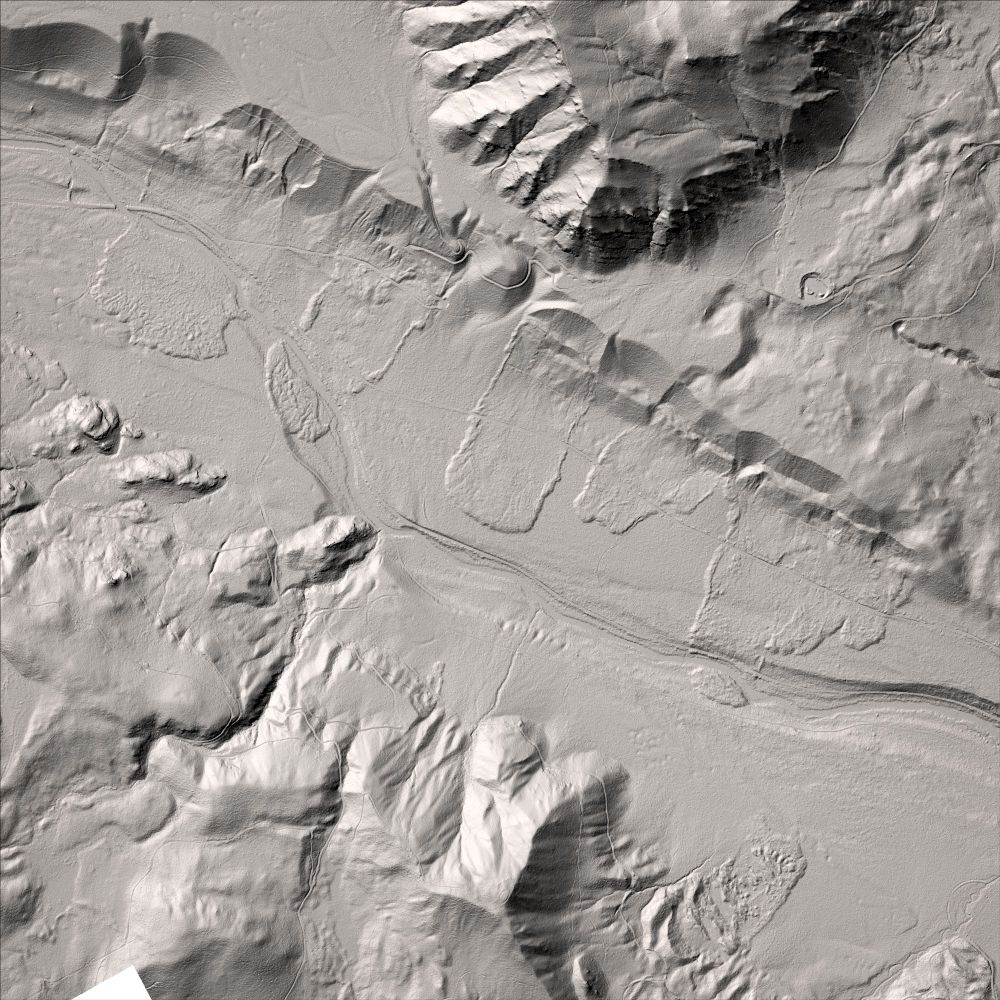
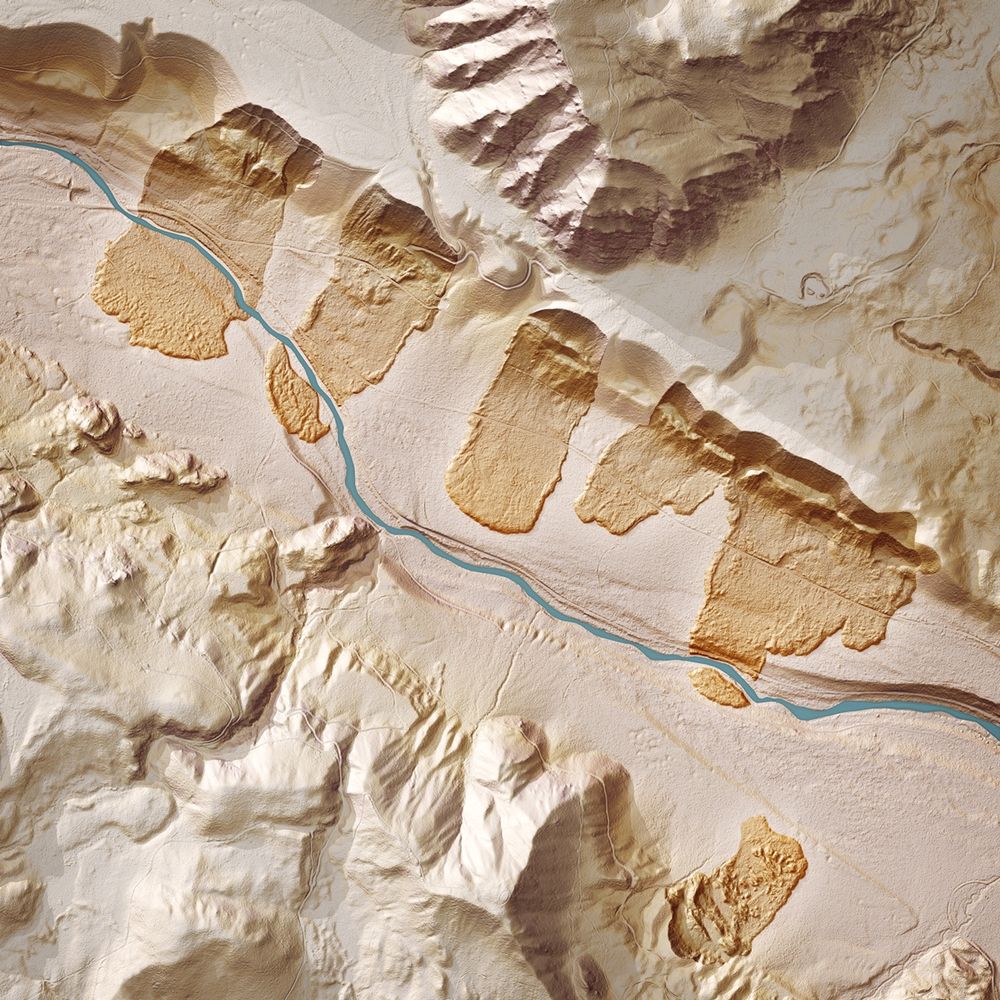
Perspective-view, lidar-derived relative elevation image of the Similkameen River with shaded relief.
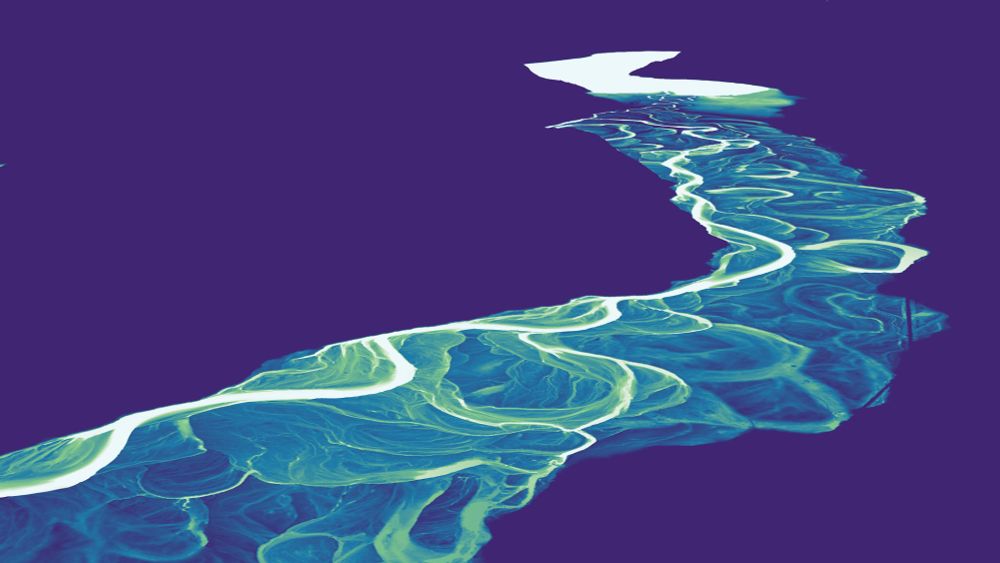
Perspective-view, lidar-derived relative elevation image of the Similkameen River.
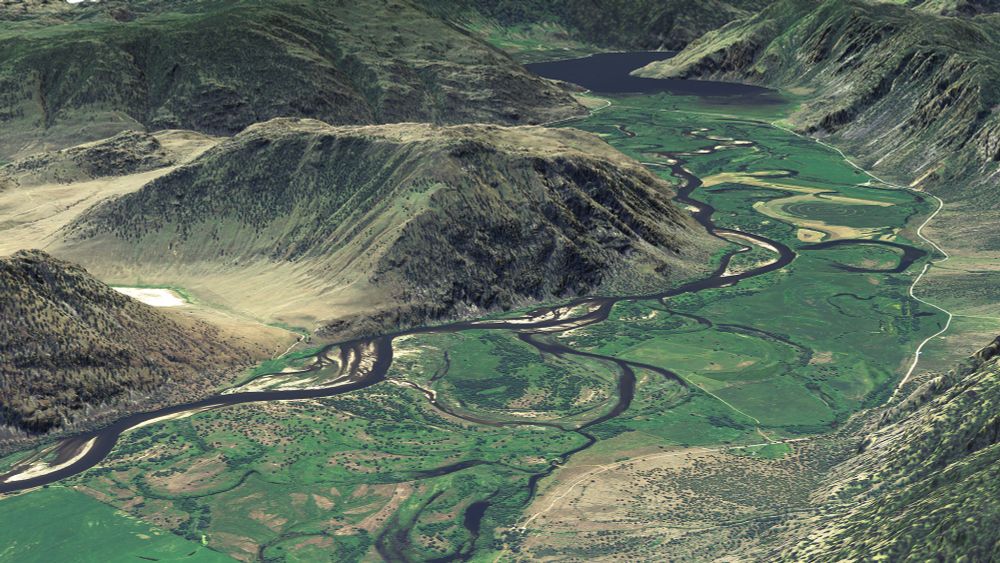
Perspective-view, NAIP aerial imagery of the Similkameen River with shaded relief.
#Lidar relative elevation images and draped imagery of the Similkameen River #floodplain near the BC/WA border looking toward Little Chopaka Mtn and Palmer Lake. Made for the WA Geological Survey. #PNW #geography #geomorphology www.flickr.com/photos/wasta...
20.12.2024 21:06 — 👍 45 🔁 3 💬 2 📌 2
YouTube video by Andrew Middleton
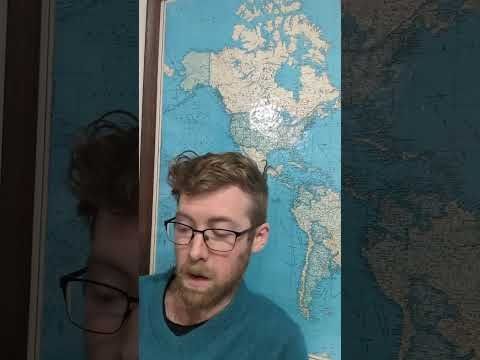
I Won a Map Store what happened next will shock you
Here we go, a brief story of how I became the owner.of New England's oldest map store. youtu.be/wFI-lnikjJM?...
17.12.2024 23:58 — 👍 216 🔁 42 💬 14 📌 19
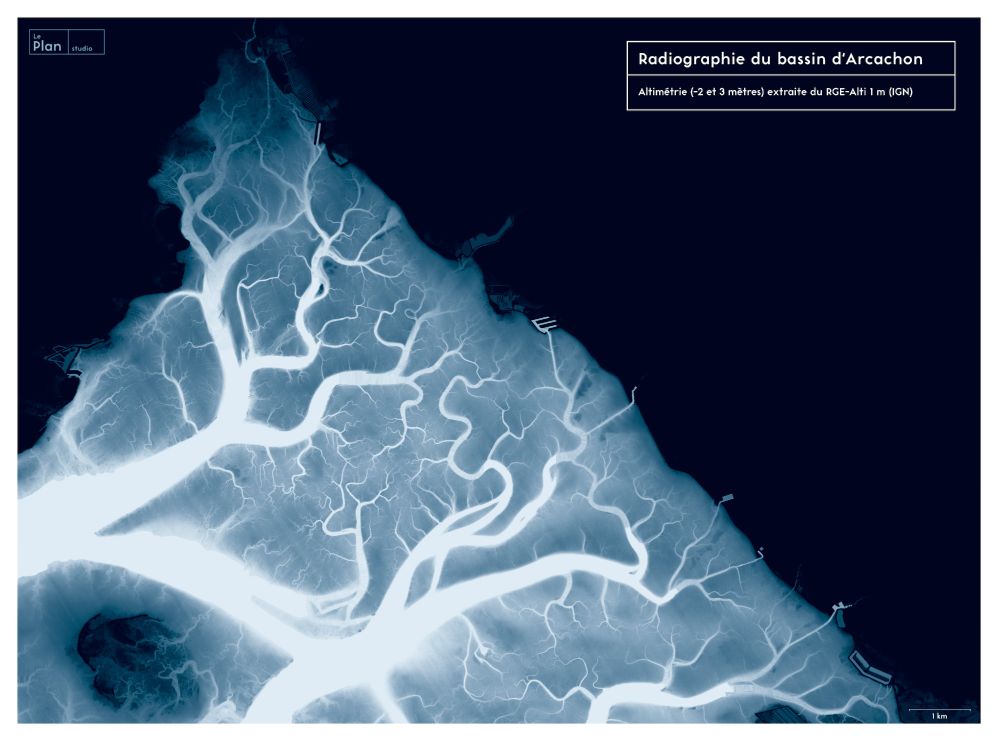
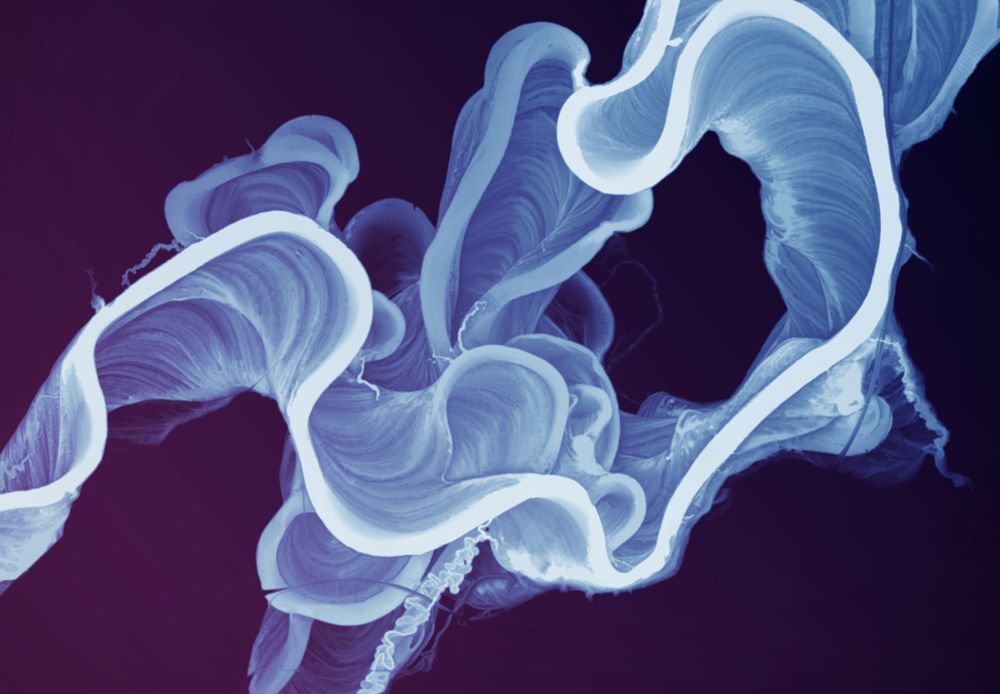
#30DayMapChallenge - Day 6 : Raster
"X-Ray of the Arcachon Bay" (France). DEM from IGN (RGE-Alti 1m)
06.11.2024 07:03 — 👍 21 🔁 8 💬 0 📌 0
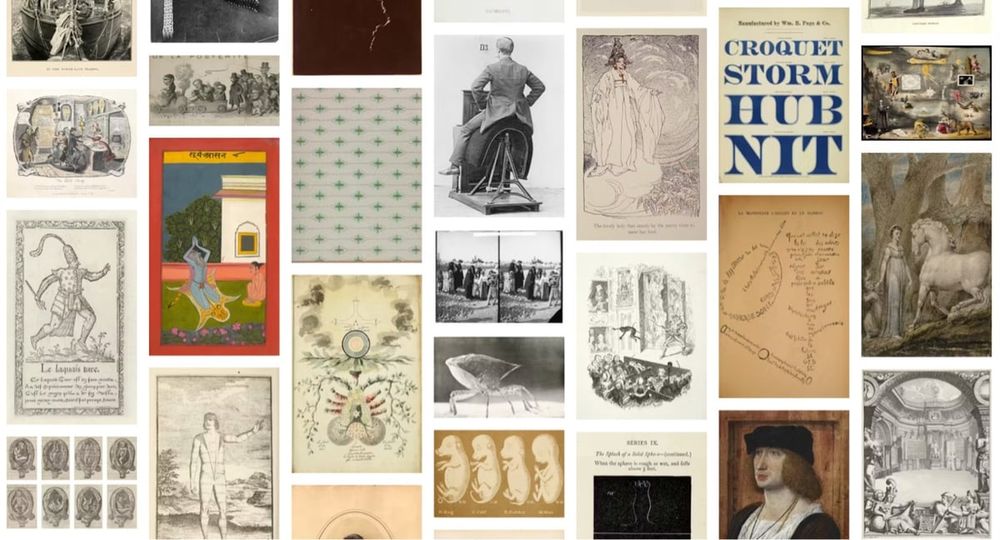
Hello! The Atlas of Design shows off some of the world’s most beautiful and intriguing cartographic design. Every two years, we publish a new volume of full-color maps, selected from worldwide competition and judged by an expert panel. Happy to be part of Bluesky!
#maps #cartography #books #design
09.12.2024 19:13 — 👍 27 🔁 8 💬 0 📌 1
Thanks! I used an application called Quick Terrain Modeler and a bit of Photoshop for these.
09.12.2024 15:20 — 👍 2 🔁 0 💬 0 📌 0
HT to @chaneyswiney.com's Peakscapes series for providing inspiration for these!
08.12.2024 01:02 — 👍 6 🔁 0 💬 0 📌 0
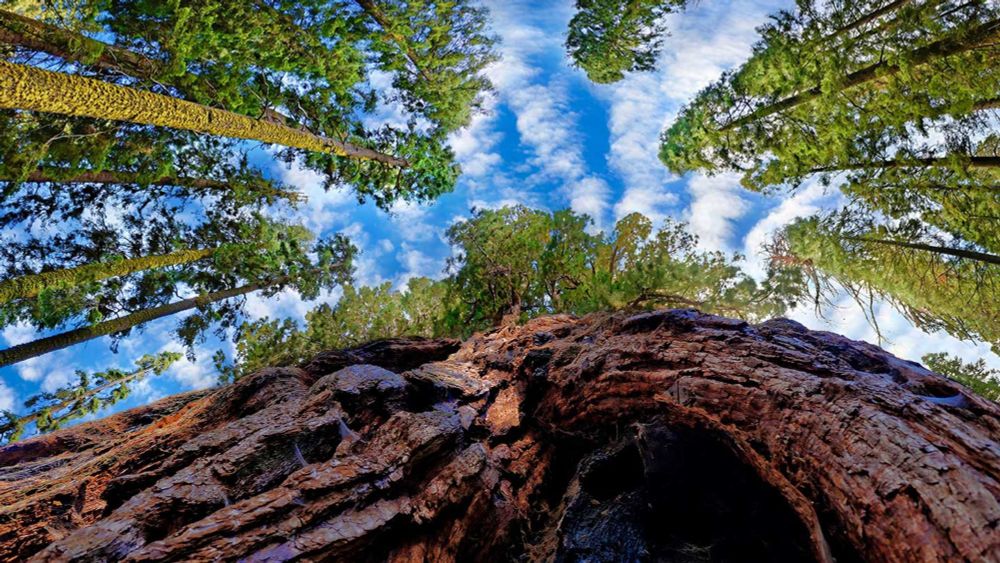
Why trees are failing to adapt to climate change
Certain fungi give trees nutrients and water, but heat and drought are putting both at risk.
For @sciencenews.bsky.social: Trees and the fungi they depend on are being torn apart, a new study finds. As climates get warmer and drier, many trees should be migrating north—but some aren't.
That could be because their fungal friends can't make the journey.
www.sciencenews.org/article/clim...
06.12.2024 17:28 — 👍 5 🔁 1 💬 0 📌 0
Thanks-these examples were manually delineated.
08.12.2024 00:30 — 👍 3 🔁 0 💬 0 📌 0

Independent Map Sellers
A shopping guide offered by the Independent Map Artists
Also, my little online shop is but one of many cartography shops! @pinakographos.bsky.social and I recently launched mapartists.org with 30-something (and growing!) independent map sellers. Let your favorite cartographers cover all your gifting needs!
26.11.2024 17:56 — 👍 6 🔁 2 💬 0 📌 2
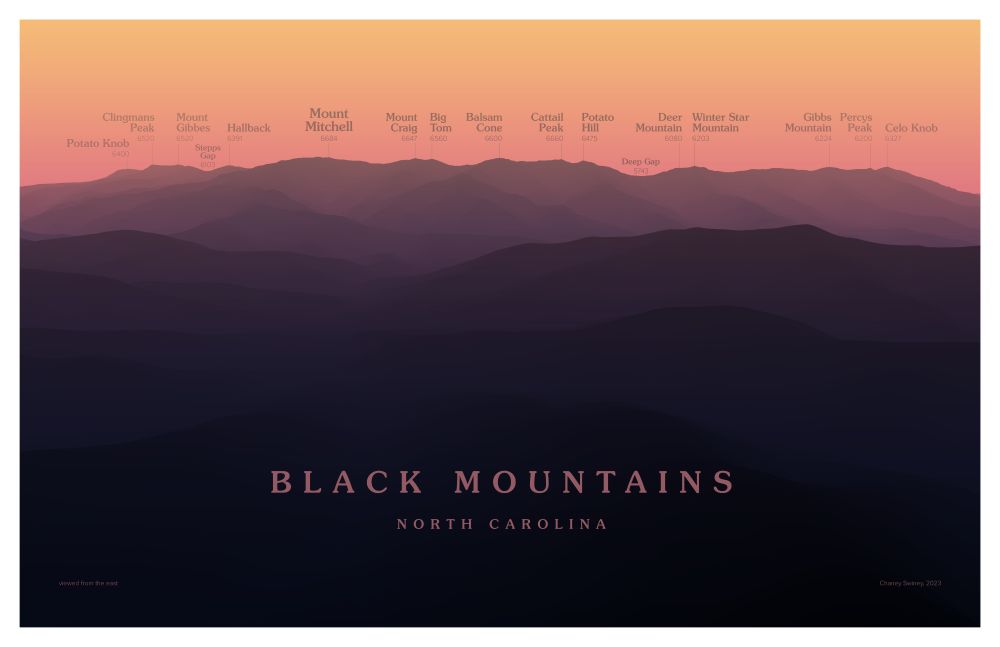
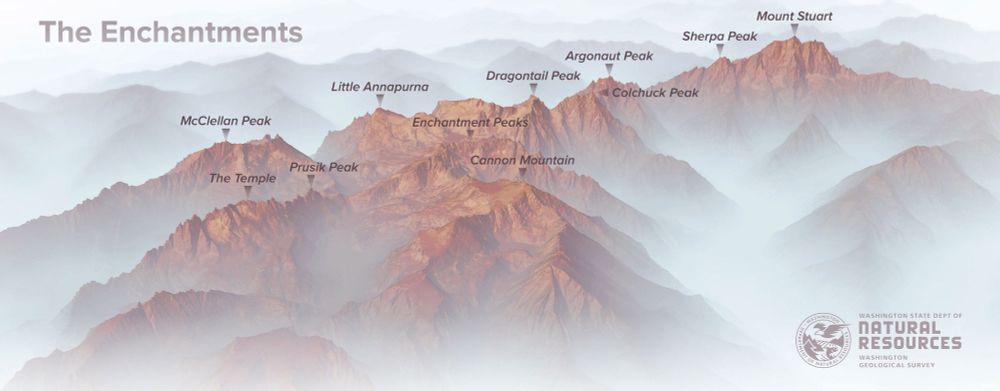
Image of the Black Mountains in North Carolina, cast in a gradient reminiscent of sunset hues: orange at the top to dark purple at the bottom. Summits are labeled with their names and elevations.
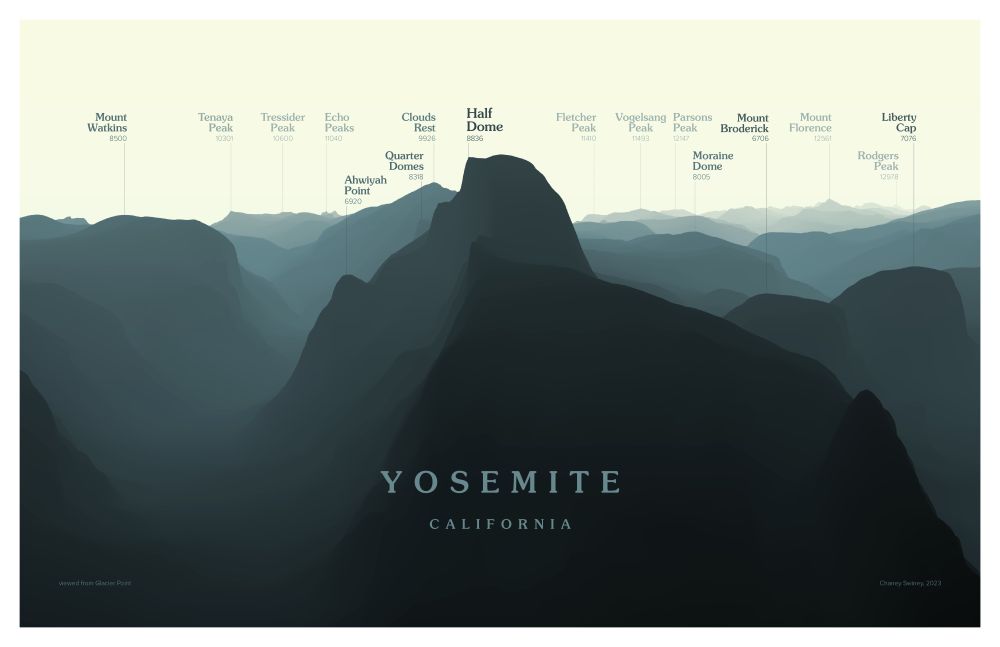
Image of Half Dome and its surroundings in Yosemite National Park, cast in a gradient of yellowish blue. Summits are labeled with their names and elevations.
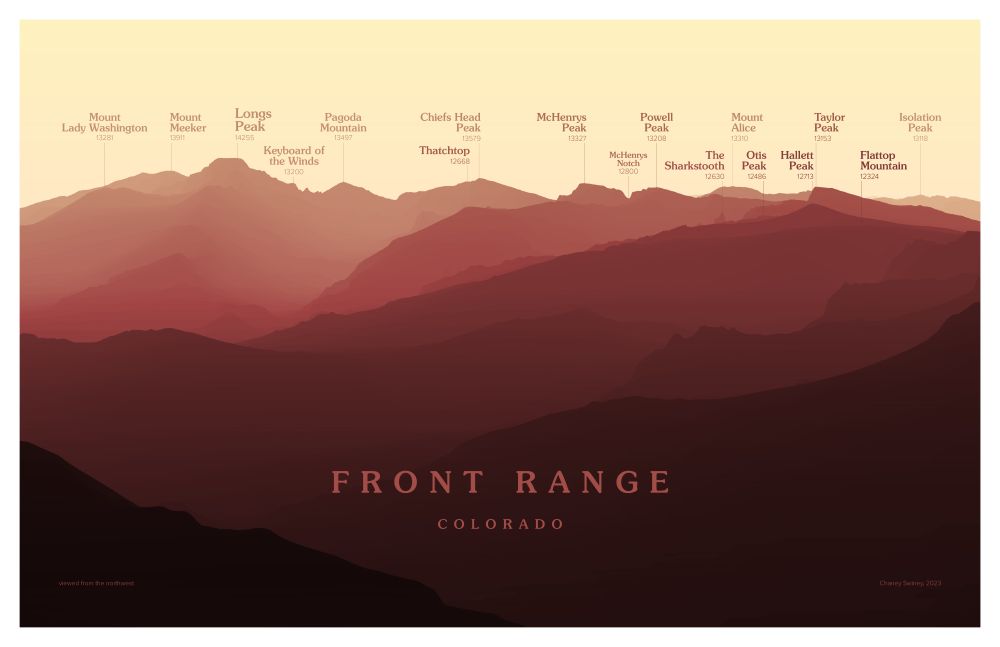
Image of the Front Range in Rocky Mountain National Park, cast in a gradient of yellow to red. Summits are labeled with their names and elevations.
A favorite recent project: Peakscapes. I love the layered looks you get in the #mountains, and I always want to be able to name everything in view. These designs provide a cleaner, more idealized view of the landscape than a photo can.
Are they #maps? Or geographic art? I'm not sure.
05.12.2024 15:48 — 👍 82 🔁 20 💬 5 📌 2
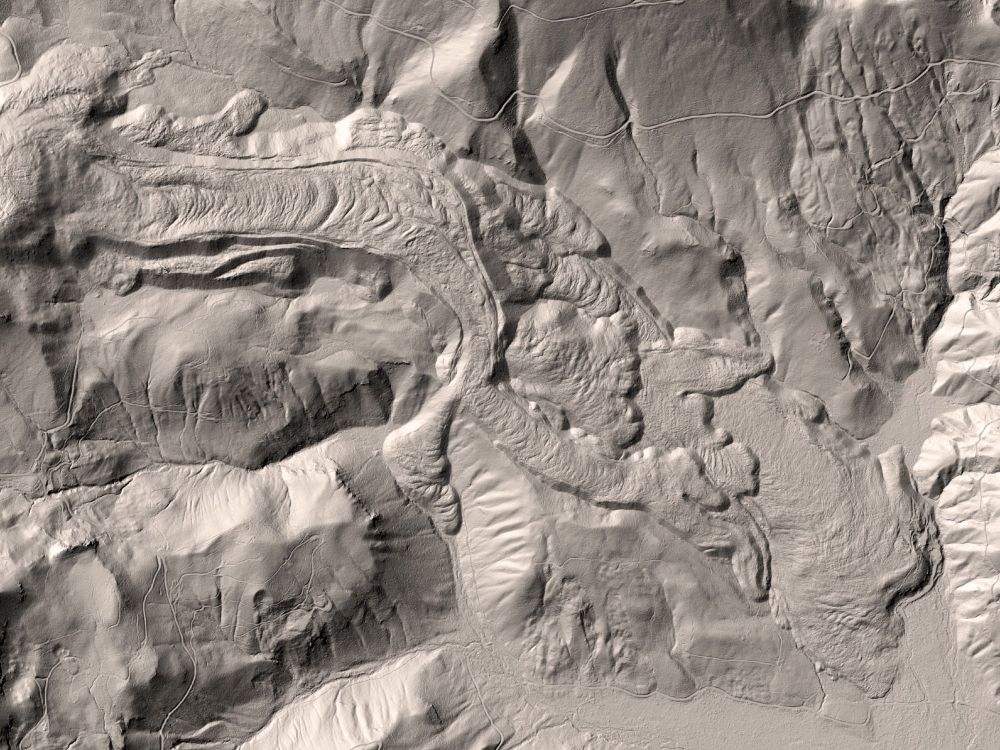
Plain hill shaded image of long-runout landslides in the Cedar River Valley revealed by lidar. These forested landslides are not visible in aerial photographs, but become apparent when viewed with bare-earth lidar.
Image by Daniel E. Coe, Washington Geological Survey
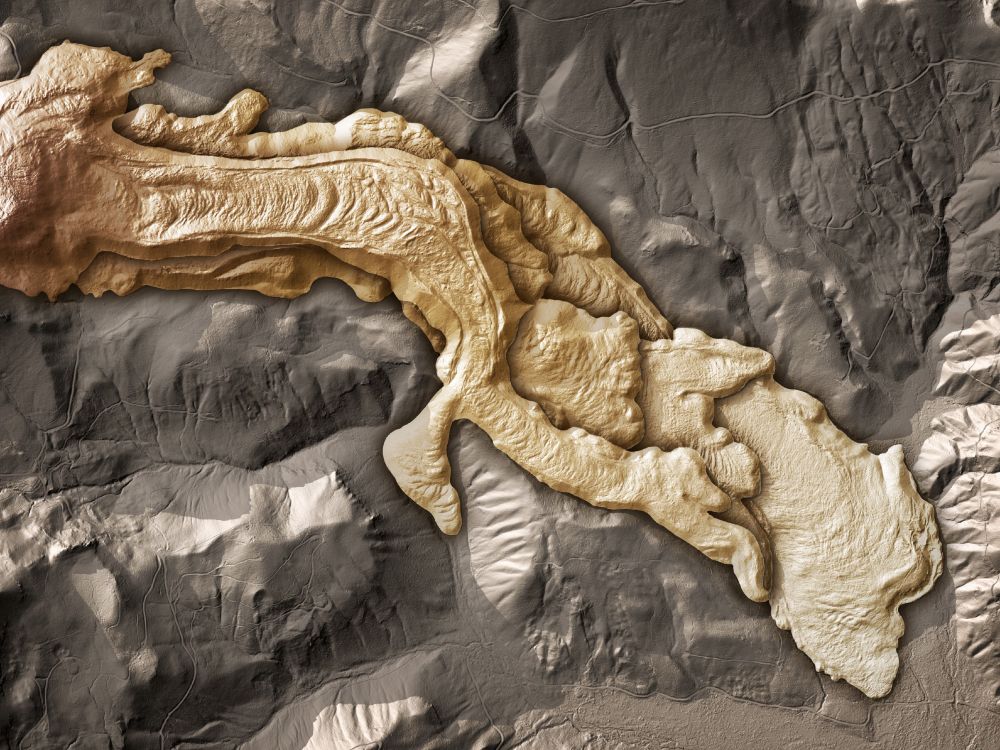
Colorized hill shaded image of long-runout landslides in the Cedar River Valley revealed by lidar. The color highlights the landslides, revealing there relationship to the river and valley walls.
Image by Daniel E. Coe, Washington Geological Survey
Gray hill shaded map of the Lava Flows from West Crater in Skamania County. The flows are hard to separate from the surrounding landforms. This volcano most recently erupted lava about 8,000 years ago.
Image by Daniel E. Coe, Washington Geological Survey
Colorized hill shaded map of the Lava Flows from West Crater in Skamania County. This volcano most recently erupted lava about 8,000 years ago. The colors (and additional shading) highlight the lava flows and show how they are superimposed on one another.
Image by Daniel E. Coe, Washington Geological Survey
It’s amazing how one “simple” trick—color-coding landscape features in bare earth LIDAR data—can increase the readability of topography.
Image from the Washington Geological Survey (Washington State DNR)/Dan Coe
www.flickr.com/photos/wasta...
#dataviz 📊 #cartography🗺️
25.10.2024 17:35 — 👍 99 🔁 23 💬 3 📌 0
🍀 est. 1990 ✧ queer artist and designer from finland ✧ donkicorn who got them cats, shrimps, bugs, plants and odd shrek feelings ✧ they/he/it
🍀 contact: berneri@windowslive.com or DM!
✏️ main tags: #art / #doodle / #commission / #merch / #oc
Info about the Golden State’s earthquakes, geology, & minerals from scientists at the California Geological Survey (CGS), a division of #CalConservation.
Raised on Coast Miwok land, longtime resident on Ramaytush Ohlone land, writer, climate person, feminist, wanderer. Just started a newsletter at MeditationsInAnEmergency.com.
U.S. Senator from Washington State | Ranking Member @commerce.senate.gov | RS≠endorsement
U.S. Senator, Washington state | Senate Appropriations Vice Chair | Working every day to help people and solve problems
here to learn new things // geoscientist
Maps for the people and planet. #LandBack
linktr.ee/decolonialatlas
"high-no-koh-doh" | Fermentation Wizard | Creator of MIRU | Cofounder of Mimic Publishing: mimicpublishing.com | Link in bio: Hinokodo.com
#AllDataIsSpatial #DataIsPlural #KiwiInColorado | Spatial Data Scientist / Researcher | Sharing (Mainly) GIS, Spatial and Geology 'Stuff' | Personal Account, Not Specifically Related To My Employer
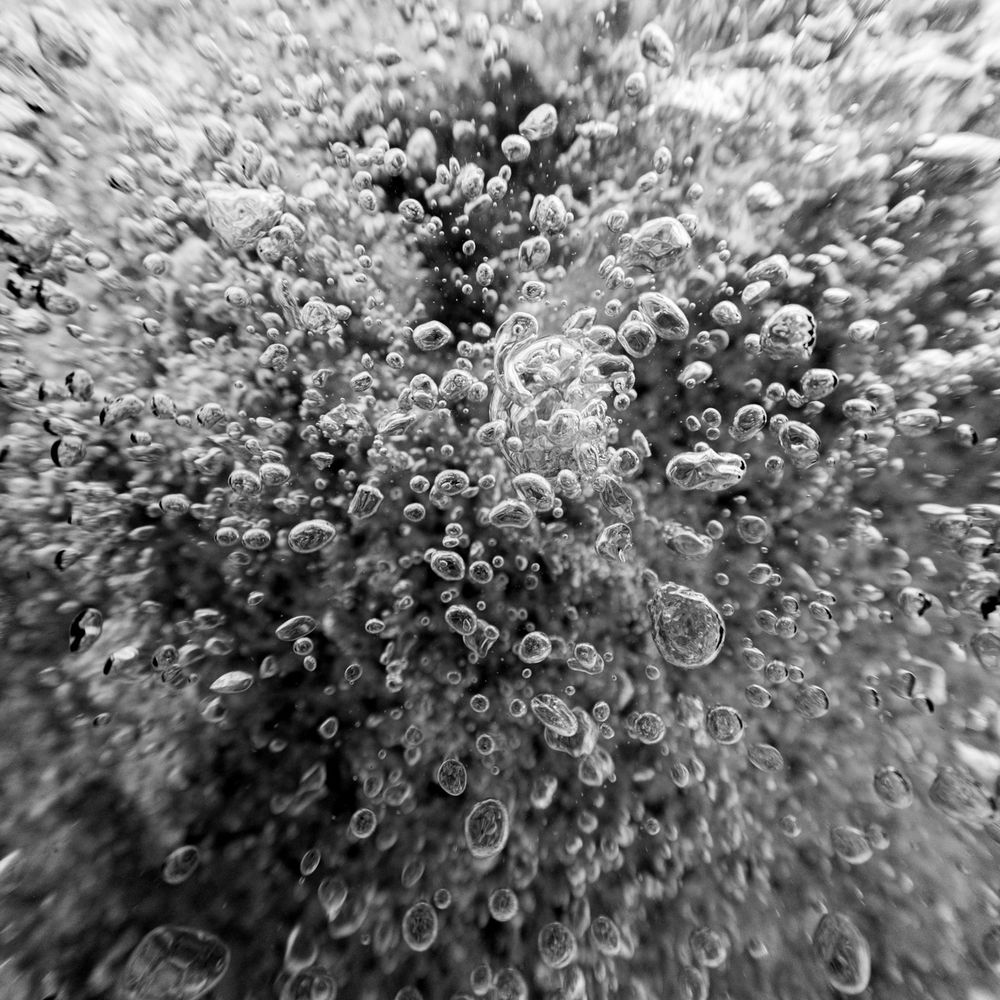
Have you ever stuck your head in a river? Imagine that, but as fine art.
Prints available:
🔗 https://riverbubbles.photography
🤵♂️ @rccone.me
#art #nature #photography #fineart #montana
Volcanologist, scicomm-er, Magma PI, Field Fiddler. She/her. Tweets, likes, retweets do not speak for or represent past/present employers.
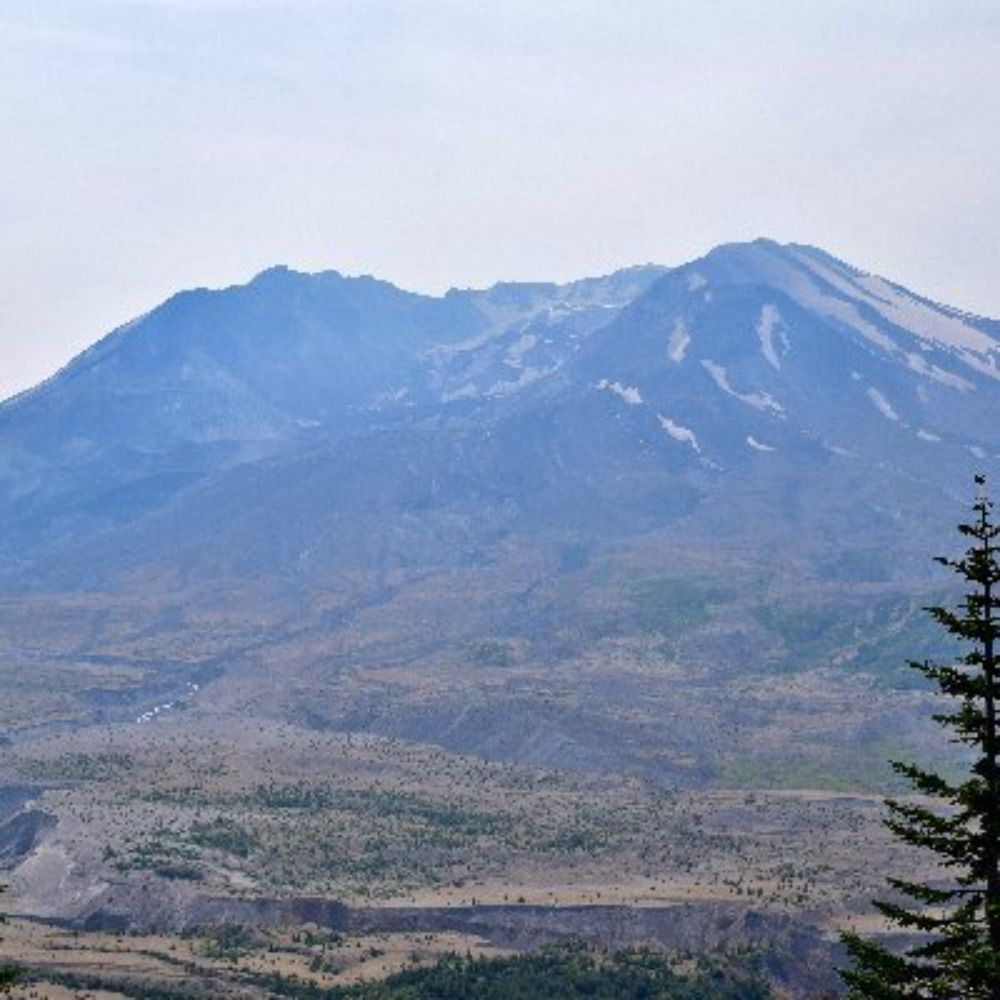
Former SciComms guy Chris here, chronicling Mount St. Helens' history: the mountain before 1980, its eruptive fury, and nature's stunning comeback.
Links: https://linktr.ee/sthelensin1980
Mapping+Excellence+Community
The BCS promotes the art & science of mapmaking and all aspects of cartography to a wide audience.
Winter Lecture 11th Dec
GeoFutures questionnaire during December
GeoFutures 25th March 2026
Journaliste-Cartographe @lemonde.fr
Concocte des cartes et des atlas chez Autrement, aux Arènes et chez Armand Colin
Ex compte Twitter : https://x.com/xemartinlaborde?s=21&t=TfSHTcYkiyL4elRNWbPcTw
Unrepentant Geographer & Polar Bear.
UU, Atheist, Humanist, Pluralist. Abortion is Healthcare.
Design School GIS & Data Librarian
Opinions here are my own. Reposts are not necessarily endorsement or agreement.
Mapmaker, mountaineer and GIS Coordinator of the Icelandic Met Office. Open Source Geospatial all the way!
Currently sponsoring:
QGIS | OSGeo | Even Rouault
Streets.mn fosters positive connections and inclusive conversations about better places in Minnesota.
Into maps, photography, and design.👋 I’m a cartographer & designer who loves making maps and interactive viz.
Maps and stuff: phoebelty.com
Cartographer, Finalist ArcGIS StoryMap Competition 2023, Owner Four Corners Mapping and GIS, Lover of rocks and maps and where they meet.
Posts about hiking and maps. Blog at hkuril.com.