This one has spent a *long* time in the oven, so credit to Nikolai Piskunov (lead author), @nplinnspace.bsky.social (check out her paper on the real WASP-107b data here: bsky.app/profile/npli...), and the CRIRES+ Consortium.
Thanks for reading!
17.09.2025 15:05 — 👍 3 🔁 0 💬 0 📌 0
Not a lot of plots here I'm afraid as they're best read in context lest I *really* bloat this thread, so I'll point you to the paper. I know I'm a little biased, but for a paper with this many equations (it is a methodology paper after all) it's very readable and we try to put our work in context!
17.09.2025 15:05 — 👍 3 🔁 0 💬 1 📌 0
Summary: 1) New method to do exoplanet transmission spectroscopy that looks at the same data in a new way. 2) Some advantages to traditional methods, some disadvantages too—both very complementary. 3) TODO: future work fully testing the method on real data of benchmark hot Jupiter systems.
17.09.2025 15:05 — 👍 4 🔁 0 💬 1 📌 0
The paper is largely based on simulated observations, but we did test on 2 nights of real data (WASP-107 b, a surprising complicated system) and saw comparable performance to 2 simulated nights. It's tricky to interpret though, as we don't actually *know* what WASP-107b's spectrum looks like!
17.09.2025 15:05 — 👍 3 🔁 0 💬 1 📌 0
And it works remarkably well! Check the paper to see our results plots, but we see good reconstruction of the stellar and telluric features, and the planet reconstruction gets better with each additional transit we add.
17.09.2025 15:05 — 👍 3 🔁 0 💬 1 📌 0
This works better the more transits/spectra we have, as each new transit 'shuffles' the Doppler shifts of the three components relative to each other making for a more constrained/less degenerate optimisation problem. Put another way, overlapping spectra in transit #1 are distinct in transit #2.
17.09.2025 15:05 — 👍 3 🔁 0 💬 1 📌 0
We use these known Doppler shifts to construct models of each component (star, telluric, planet) and use those to reconstruct our observations (some N spectra taken over a transit). These models are constructed from the data and RV shifts alone (i.e. no physical star/planet atmosphere models).
17.09.2025 15:05 — 👍 3 🔁 0 💬 1 📌 0
Which is where our new inverse method comes in. What if instead of *detrending* the data, we tried *disentangling* it instead?
To do so, we take advantage of the 3x distinct and resolved Doppler shifts/frames I mentioned earlier—something only possible from the ground.
17.09.2025 15:05 — 👍 3 🔁 0 💬 1 📌 0
This isn't 100% true though, and such 'detrending' methods can and do destroy planet signal along with the stellar and telluric features—especially for less-massive planets on longer period orbits. They also don't 'converge' in a mathematical sense, which is one of the downsides of their simplicity.
17.09.2025 15:05 — 👍 3 🔁 0 💬 1 📌 0
Typically the field approaches the problem with a PCA-like method, where we make the (broadly correct) assumption that, exposure-to-exposure, stellar and telluric features don't change in wavelength, but the planet does, so iteratively removing per-wavelength trends in time 'cleans' the data.
17.09.2025 15:05 — 👍 4 🔁 0 💬 1 📌 0
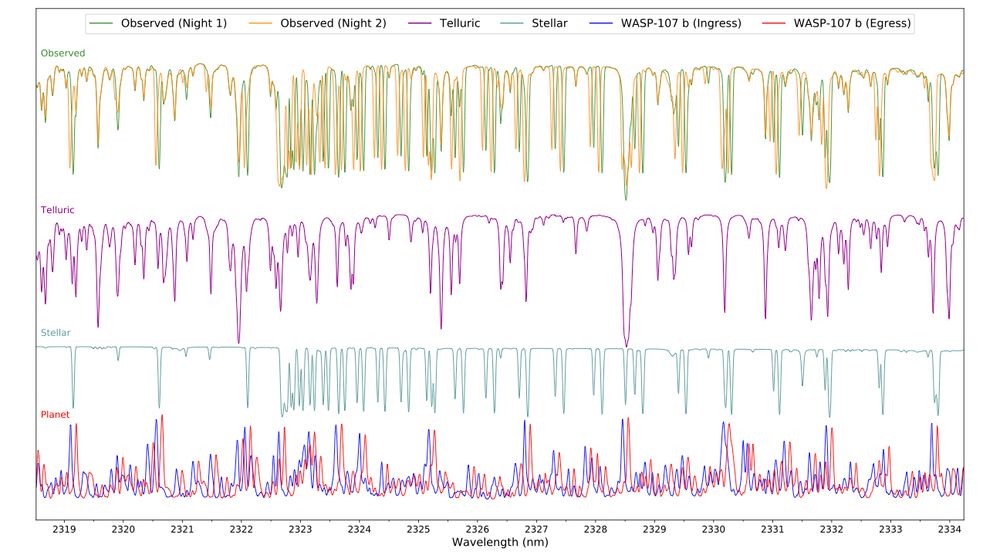
Visualisation of an example `observed' spectrum (corresponding to a CO molecular band) alongside its decomposed telluric, stellar, and exoplanetary components. From top to bottom: observed spectra (green and orange) shown for the central phase of two different transits; Telluric spectrum (purple); stellar spectrum (blue-grey) at the central phase of transit #1; and planet (WASP-107 b) 'blocking radius' at transit ingress (blue) and egress (red) on transit #1 showing the noticeable change in planetary Doppler shift of ~12.6 km/s over the transit duration--over which time the star only shifts by ~0.4 km/s. These Doppler shifts are only visible with a high-resolution spectrograph, and those are currently only available on ground-based telescopes.
To step back, what do we observe? A spectrum has 3 parts: star, telluric (Earth's atmosphere), and planet. The first two dominate the signal, and all three have different Doppler shifts.
Space-based observations don't have tellurics ✅, but aren't high-res enough to resolve these Doppler shifts ❌.
17.09.2025 15:05 — 👍 4 🔁 0 💬 1 📌 0
@bot.astronomy.blue signup
17.09.2025 13:32 — 👍 0 🔁 0 💬 0 📌 0
TLDR:
1) Lots of chemical info to exploit in the optical—of interest for 🪐 host chemistry.
2) Beware of naively trusting M/K dwarf physical model spectra—they aren't (currently) a good match to reality & this affects recovered stellar properties.
3) I've helpfully quantified some of this mismatch!
23.02.2024 16:02 — 👍 7 🔁 0 💬 0 📌 0
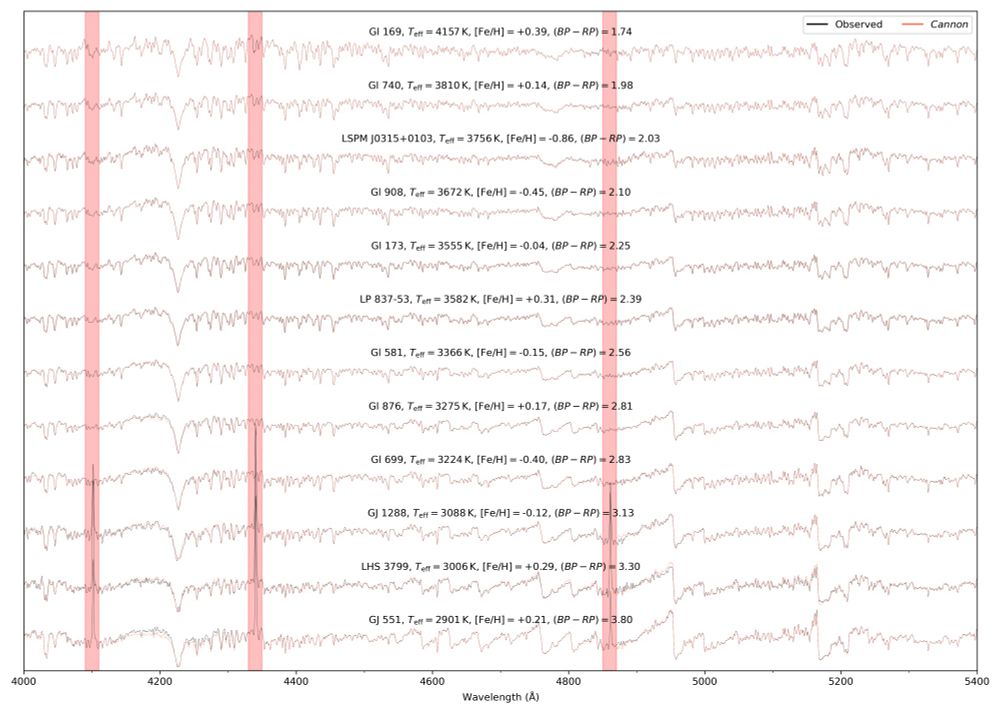
Observed low resolution blue spectra of benchmark M/K dwarfs ordered from warmest (top, smoothest) to coolest (bottom, most wiggly) as compared to a data-driven/machine learning (ML) model. The spectra match remarkably well!
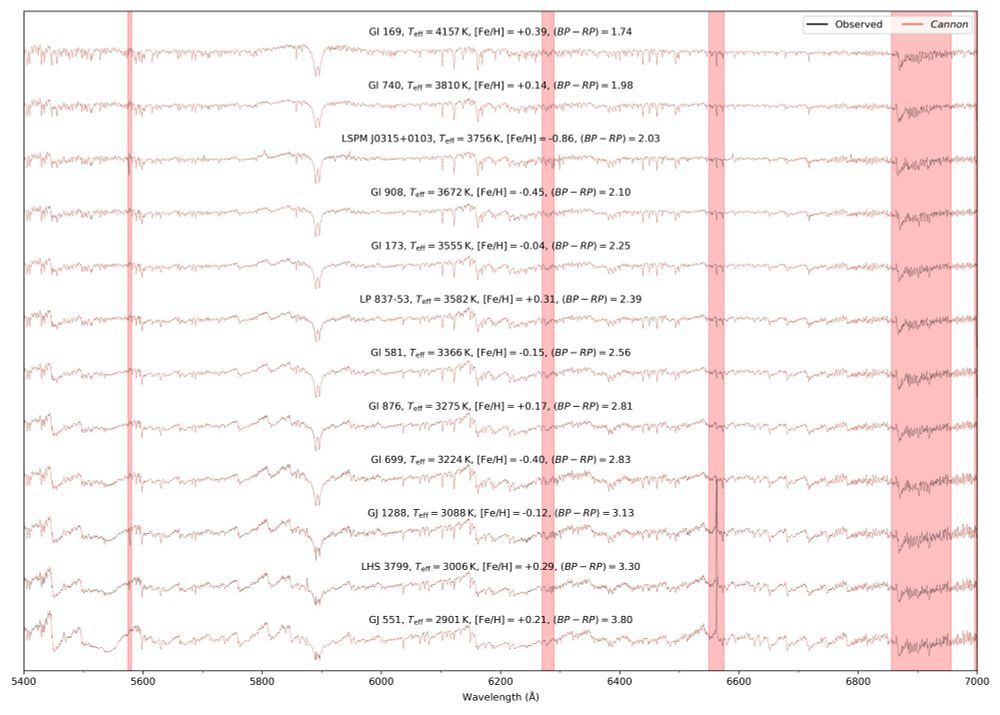
Observed medium resolution red spectra of benchmark M/K dwarfs ordered from warmest (top, smoothest) to coolest (bottom, most wiggly) as compared to a data-driven/machine learning (ML) model. The spectra match remarkably well!
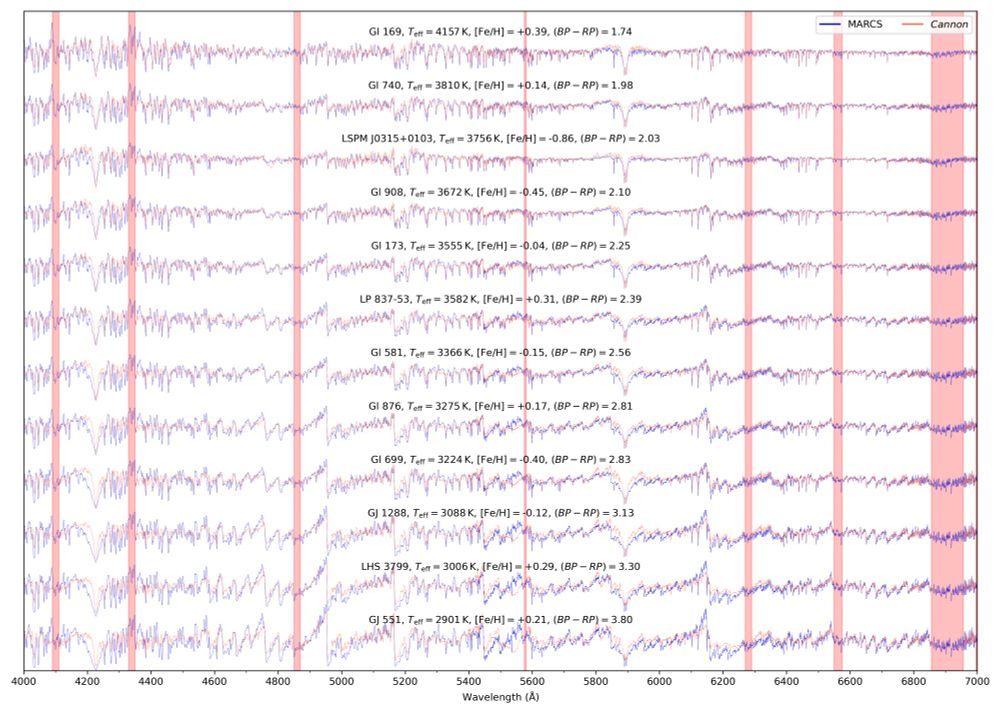
Observed blue+red spectra of benchmark M/K dwarfs ordered from warmest (top, smoothest) to coolest (bottom, most wiggly) as compared to theoretical spectra from physical models. The match is poor, pointing to missing physics or molecular data in the physical models.
<skeets into room at full speed>
Hi astro bluesky—it's paper day!
I dove into optical M/K dwarf spectra—rife with molecules as they are—& found success with a data-driven 🌈 model (i.e. ML) vs physical models.
1) 🟦🌈 recovery 😌
2) 🟥🌈 recovery 😌
3) Physical model vs ML 🙃
arxiv.org/abs/2402.14639 🔭
23.02.2024 15:56 — 👍 11 🔁 1 💬 1 📌 0
Illustrator ✨ she/her ✨
Portfolio: https://marissasketch.carrd.co
Prints: https://inprnt.com/gallery/marissasketch
Ko-fi: https://ko-fi.com/marissasketch
Science Fiction & Horror writer. Short stories & poetry published in Baubles From Bones, Shoreline of Infinity, The MacGuffin, Disturbed Digest and more. She/her. https://daniellefroom.neocities.org/
Art Director @supergiantgames.bsky.social
[ID/EN] Freelance illustrator & part-time gamer | 🚫NFT & genAI
✧TAGS NAVIGATION✧
Art only: #wepepedraws | #artcommission | #OC
Fandom: #dragonage | #bg3 | #criticalrole | #trigun
📧 wieke.wepepe@gmail.com
👇commission info & all links
http://wepepe.carrd.co
artist, writer 🍀 http://evasoulu.com 🍀 hijacked by the dog(s) 🍀 she/her 🍀 (commission info on my website) 🍀 DA / ME / FF14 / BG / SW
🚫 no A•I / n•ft 🚫
Ancient & military historian specializing in the Roman economy and military. PhD from UNC History. More impressive credential is that I have beaten both Dark Souls and Elden Ring.
Blogs at acoup.blog
Madeline Stephanie Thorson
makes games ~ Celeste, TowerFall, etc
🏳️⚧️ gender criminal
maddymakesgames.com
Prof developing fast algorithms, reliable software, and healthy communities for computational science. https://hachyderm.io/@jedbrown
https://PhyPID.org | aspiring killjoy | against epistemicide | he/him
"What I had not realized is that extremely short exposure to a relatively simple computer program could induce powerful delusional thinking in quite normal people" - Weizenbaum 1976
Weekly newsletter on AI and teaching and more(nl/en): www.felienne.nl
Self-funded PhD student (reading history in XVIII New Spain) & paid researcher (open science, research integrity, academic health systems) at Leiden University. Baking & reading aficionada. Managed by a Timneh. ORCID 0000-0002-5676-2122
Director of Research, @dairinstitute.bsky.social
Roller derby athlete
https://alex-hanna.com
Book: thecon.ai
Pod+newsletter: https://dair-institute.org/maiht3k
🇪🇬🏳️⚧️ She/هي
📸 @willtoft.bsky.social
Rep📘 @ianbonaparte.bsky.social
https://olivia.science
assistant professor of computational cognitive science · she/they · cypriot/kıbrıslı/κυπραία · σὺν Ἀθηνᾷ καὶ χεῖρα κίνει
Professor of Computational Cognitive Science | @AI_Radboud | @Iris@scholar.social on 🦣 | http://cognitionandintractability.com | she/they 🏳️🌈
Writer, web developer and consultant based in Hveragerði, Iceland. Lapsed Interactive Media Academic. Webby Tech Stuff and webby book stuff.
https://www.baldurbjarnason.com/
https://softwarecrisis.dev/
Book: https://thecon.ai
Web: https://faculty.washington.edu/ebender
Antifascist researchers in Australia.
Email: thewhiterosesociety@protonmail.com
Blog: https://thewhiterosesociety.writeas.com/
Anarchist, cat-lover, and avid reader.
https://www.patreon.com/slackbastard
Applied ecologist, conservation science, structured decision-making, spatial modelling, waterways research, she/her
#StayGrounded #NoFlyForWork #NoGenerativeAI
Proud to #PayTheRent
I love vaccines, animals, and my wife, who set up this profile.
https://sciencebasedmedicine.org/we-want-them-infected/