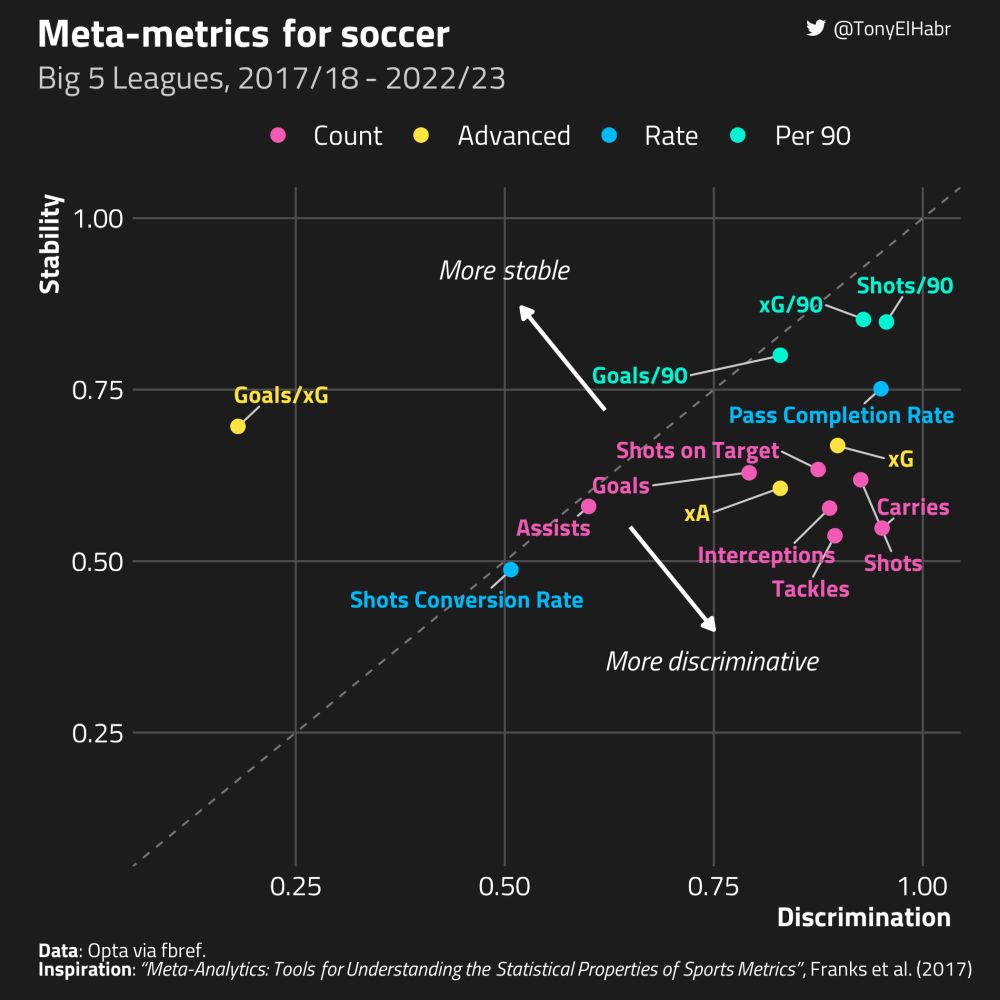
An interesting iteration on something I also wrote about a while ago tonyelhabr.rbind.io/posts/xg-rat...
22.10.2025 19:09 — 👍 7 🔁 1 💬 0 📌 0
per requested, an update to my gamestate xGD plots ahead of this weekend's MLS matches
18.10.2025 21:55 — 👍 12 🔁 2 💬 0 📌 0


reasons for changes from the prior version:
1. more data
2. the 8th and 9th place teams in the West have changed
18.10.2025 21:53 — 👍 2 🔁 0 💬 0 📌 1
San Diego’s xGD trend against playoff opponents seem to be pretty close to their overall trend.
In contrast, Inter Miami’s stands out as one of the team’s whose numbers drop off the most against stronger opponents.
04.10.2025 04:10 — 👍 3 🔁 0 💬 0 📌 0
I have to do some estimations for extra time from match event logs, which leaves some leeway for error. This is why I favor the fbref's listed xGD/90 figure when showing the overall xGD per team.
03.10.2025 20:41 — 👍 0 🔁 0 💬 0 📌 0
Your math is probably not bad. It's supposed to be Leading xGD * Leading Duration % + Trailing xGD..., which does come out to -0.03. To "square" things with fbref, I end up using what they list as total xGD/90 on the right-hand side, which was +0.03 at time of scraping. (Looks like it's +0.01 now.)
03.10.2025 20:40 — 👍 1 🔁 0 💬 1 📌 0


lmk if this is along the lines of what you're looking for. happy to iterate
03.10.2025 19:45 — 👍 24 🔁 4 💬 3 📌 4
absolutely! i’ll post a follow up when i can
03.10.2025 16:05 — 👍 2 🔁 0 💬 1 📌 0

MLS playoffs are coming soon, so here's my cheat sheet to digest how every team has performed this season
03.10.2025 15:05 — 👍 92 🔁 14 💬 7 📌 15
@cata-bush.bsky.social is actually insane for this… this seems really easy to use, has great aesthetics, and includes just about every kind of plot you can imagine
16.09.2025 16:10 — 👍 18 🔁 4 💬 0 📌 0

i believe the author’s name is Tyson Ni. (not sure if he is on bsky.)
i was made aware of these rankings from a @rwohan.bsky.social article
19.08.2025 18:27 — 👍 2 🔁 0 💬 1 📌 0
it was offseason for everyone, and now i'm rusty with my viz 😅
17.08.2025 15:28 — 👍 1 🔁 0 💬 0 📌 0
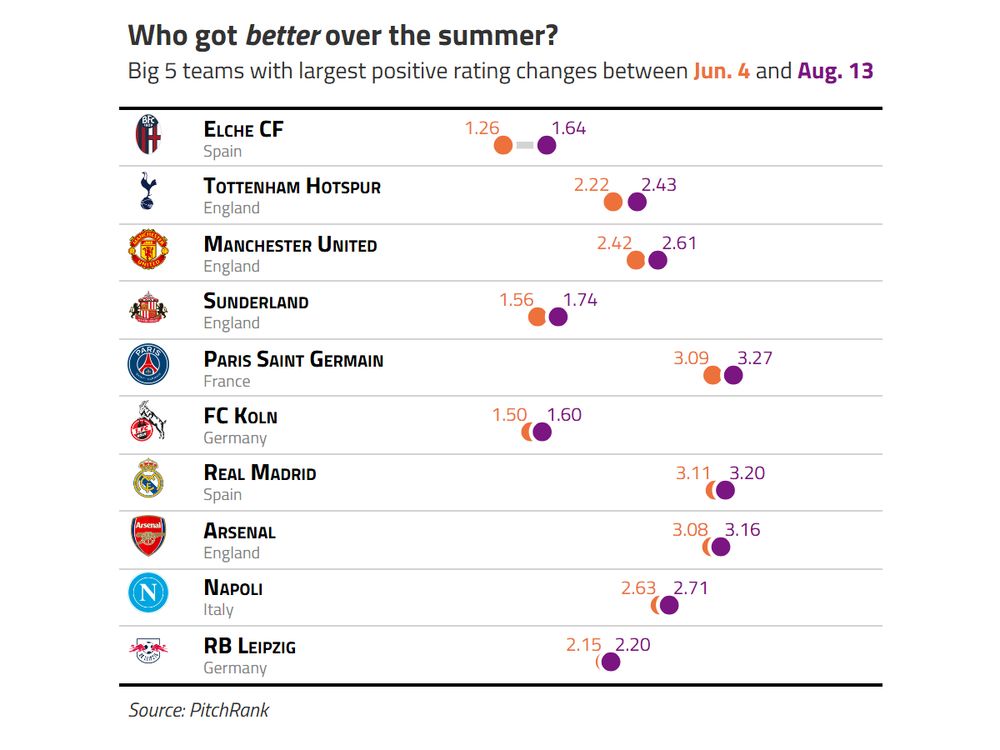

Which Big 5 teams improved the most over the summer in the eyes of odds-makers? And which teams fell out of favor?
(Ratings from PitchRank)
17.08.2025 14:15 — 👍 11 🔁 4 💬 3 📌 1
That's it, folks, #VizBuzz has come to an end and we've crowned @tonyelhabr.bsky.social champion 👑👑👑
The finals was FILLED with ties, which give me life, including a tie for second between @johnbedwards.io and the mighty @qntkhvn.bsky.social
It's the end of VizBuzz, but it lives in our ❤️
#databs
27.06.2025 02:55 — 👍 20 🔁 4 💬 2 📌 0
i feel like this points to a selection bias that pre-shot xG may not capture. players who are good with their weak foot are more likely to take more shots with it and balance out goals with misses, and those who are poor with their weak foot will only take shots with it in very favorable positions
31.01.2025 16:34 — 👍 6 🔁 0 💬 2 📌 0
30.01.2025 14:59 — 👍 11 🔁 0 💬 2 📌 0
An annual must read. Happy to see my own writing linked here.
30.12.2024 15:47 — 👍 16 🔁 1 💬 0 📌 0

memes in 2014 vs. 2024
06.12.2024 15:40 — 👍 7 🔁 0 💬 0 📌 0
xGD is live from Opta here (including the ongoing matches)
30.11.2024 16:48 — 👍 0 🔁 0 💬 0 📌 0
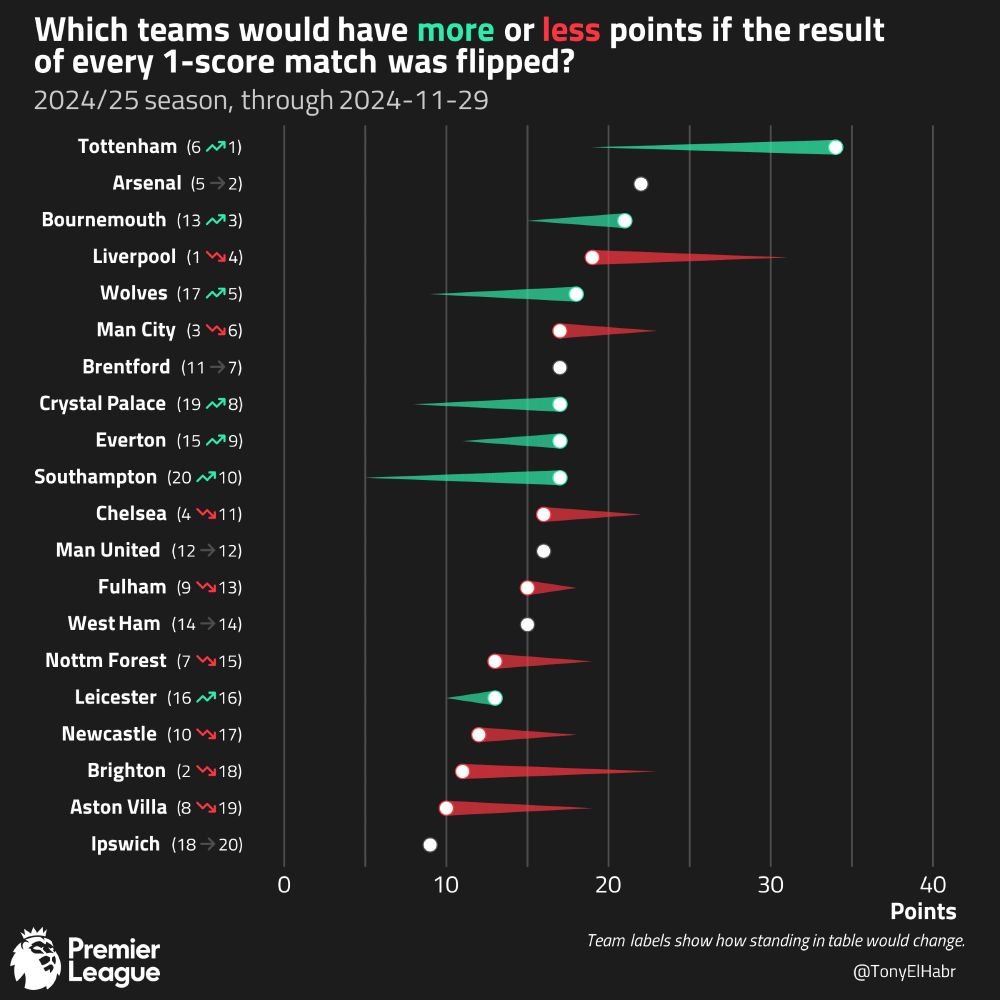
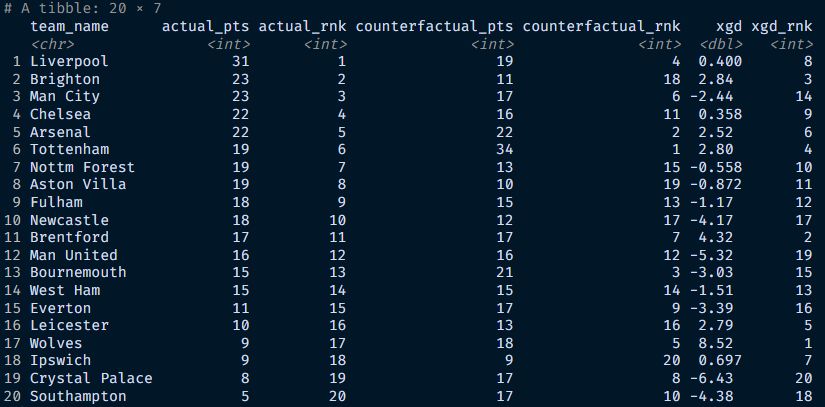
Comet / dumbbell plot showing the counterfactual standings for the English Premier League in the 2024/25 season if the result of every 1-score match was flipped, through 2024-11-29. Tottenham is at the top, Ipswich is at the bottom.
Fun hypothetical: How would the EPL table look right now if the result of every 1-score match was flipped?
Biggest risers:
1. Wolves: +9 pts, 17th -> 5th
2. Crystal Palace: +9 pts, 19th -> 8th
Biggest fallers:
1. Brighton: -12 pts, 2nd -> 18th
2. Aston Villa: -9 pts, 8th -> 19th
#rstats
30.11.2024 14:43 — 👍 24 🔁 5 💬 5 📌 1
 29.11.2024 01:21 — 👍 6 🔁 0 💬 1 📌 0
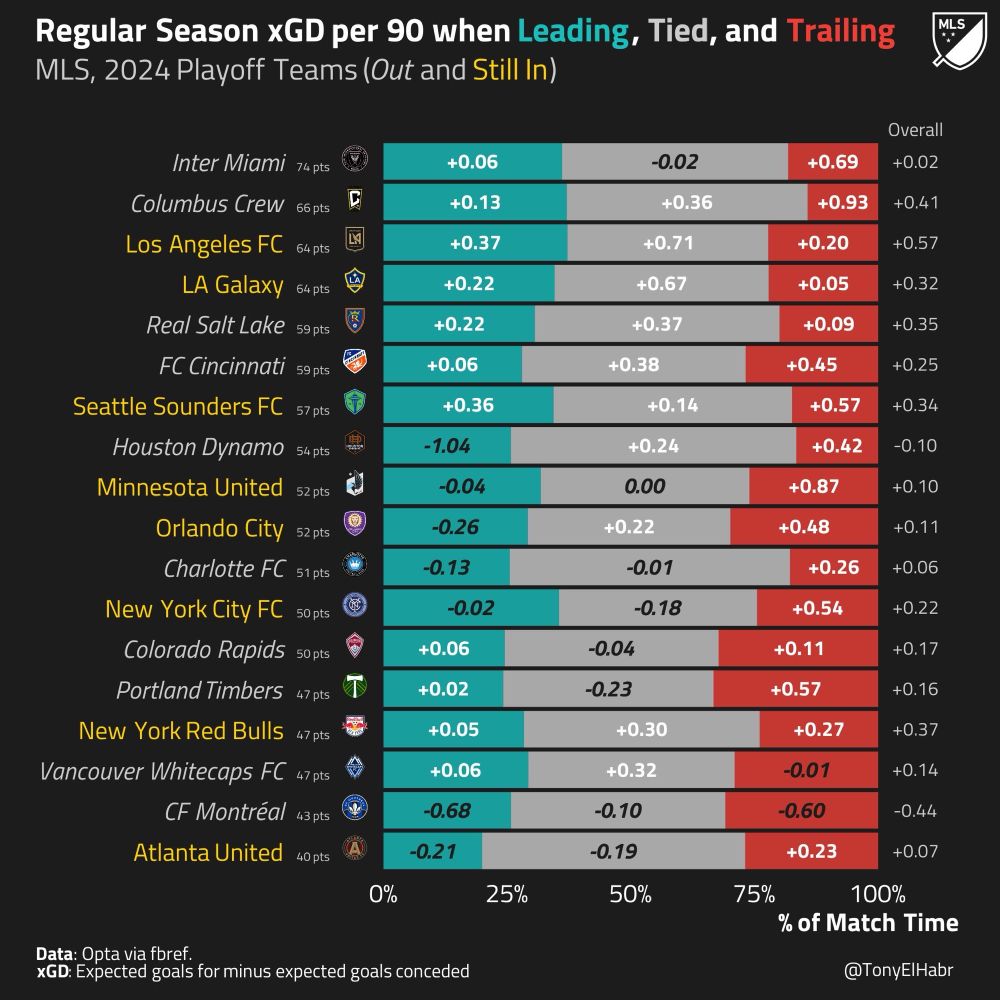
Game state xGD table of truth for the MLS 2024 playoff teams
23.11.2024 15:42 — 👍 40 🔁 4 💬 4 📌 4
❤️ the references to public studies on finishing
10.11.2024 16:05 — 👍 4 🔁 1 💬 1 📌 0

the great bsky migration may be enough to get me to blog again
31.10.2024 18:41 — 👍 14 🔁 0 💬 3 📌 0
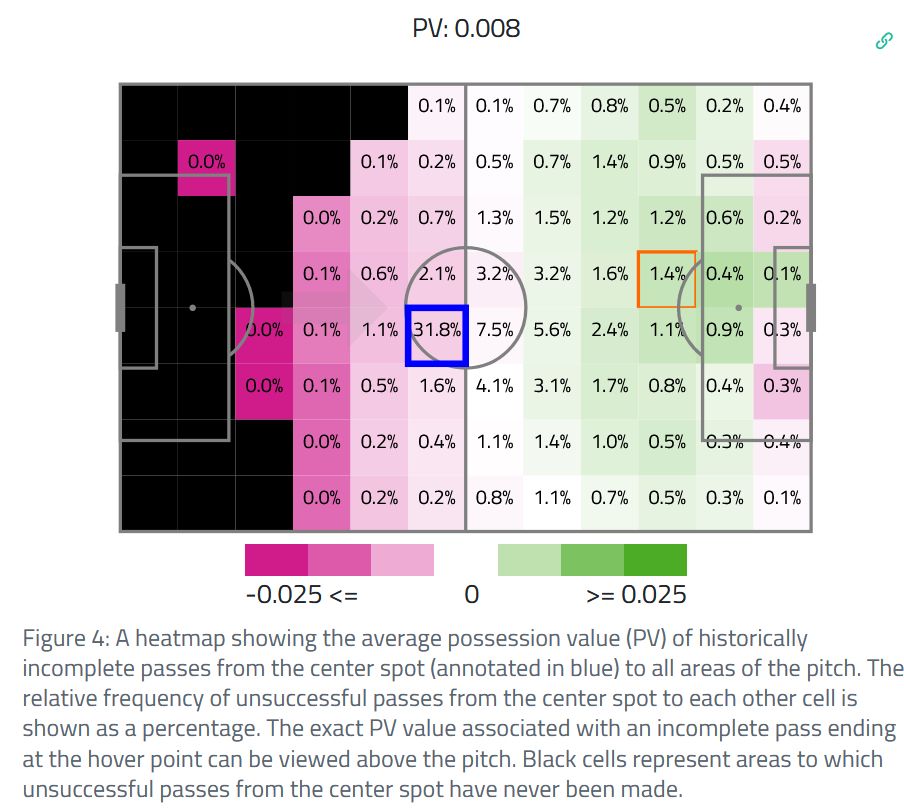
An 8x12 heatmap showing the average possession value (PV) of historically incomplete passes from the center spot (annotated in blue) to all areas of the pitch. The relative frequency of unsuccessful passes from the center spot to each other cell is shown as a percentage. The exact PV value associated with an incomplete pass ending at the hover point can be viewed above the pitch. Black cells represent areas to which unsuccessful passes from the center spot have never been made.
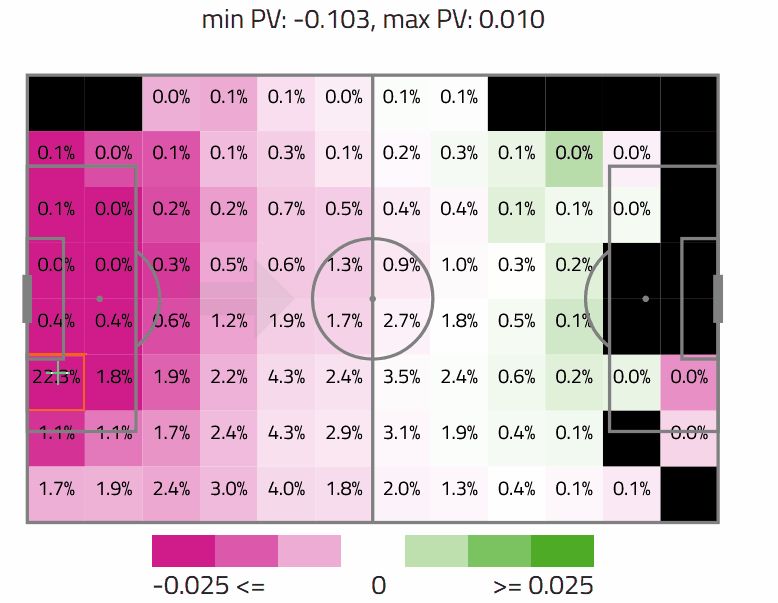
An 8x12 heatmap (gif) showing the average possession value (PV) of historically incomplete pass from the hover spot to all areas on the pitch. The relative frequency of successful passes from the center spot to each other cell is shown as a percentage. The heatmap updates as the user moves their mouse over cells on the heatmap.
Finally got around to trying out Observable JS in depth. It's really nifty! I used it to make some sick ⚽ plots in this post: tonyelhabr.rbind.io/posts/ball-p...
#rstats
21.04.2024 13:33 — 👍 3 🔁 0 💬 0 📌 1
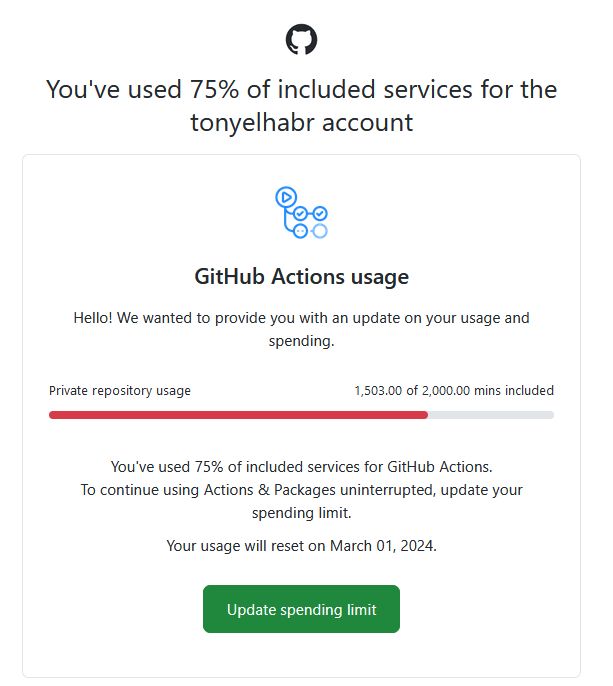
where is my GitHub achievement badge 😈
05.02.2024 14:05 — 👍 2 🔁 0 💬 0 📌 0
i'm about to have a bad time, aren't i
04.02.2024 13:58 — 👍 4 🔁 0 💬 1 📌 0
the synthetic data thing was really interesting. that might generally be a better framework for handling selection bias, particularly for Bayesian analysis. but i tend to dislike synthetic data generation + down/up-sampling, and i don't see how it would be better for models that take case weights 🤷
30.12.2023 19:03 — 👍 1 🔁 0 💬 0 📌 0
Somewhere in the middle of a Venn diagram of machine learning and football / soccer.
http://www.pena.lt/y/blog.html
Director of AI @ Skillcorner
Senior Data Scientist @ludonautics.bsky.social. Previously Lead Data Scientist @ Leicester City Football Club and Data Scientist @ the LEGO Group. For open source football analytics, see: http://github.com/eddwebster/football_analytics
Footy Photographer, Product Manager at Sports Reference, Gal of @galpalsports
PhD student @dtai-kuleuven.bsky.social, applying Machine Learning on sports data.
Designer who loves music, art and Austin FC.
Professor @ KU Leuven researching AI, machine learning, and sports. Co founder of runeasi
Independent journalist, SnapStream brand ambassador, and publisher of the Public Notice newsletter https://www.publicnotice.co/subscribe
I write often at: https://talking-tactics.com.
Write about football. Talk about football. Not a child.
Senior Staff Writer @Ringer
Co-Host Ringer Fantasy Football Show || Ringer NFL Draft Show
Fantasy Football and NFL Draft for ESPN
Cohost of Golic and Golic on FanDuel Sports Network | ND ‘12
@mikegolicjr on IG
https://www.youtube.com/MikeGolicJr57
I host a podcast called Football 301 that’s been described as “…entertaining with a slightly degenerate charm…”
It's always a good day for an elbow drop.
Is Butterbean OK?
early 30 something black man in brooklyn. covering NFL @ yahoo sports. football 301 podcast. free palestine. long live rosie.
ESPN NFL Draft Analyst & Insider // Draft Good Football Players™ // Media inquires — Lily.Blum@espn.com // Marketing: send2mattmiller@gmail.com
NFL and Philly sports at The Ringer/Spotify
ESPN Senior Writer and New York Times bestselling author.
Seth.Wickersham@espn.com
8 yr NFL OL | ‘pac12 2Day’ I Siriusxm373 I FoxSports I
Geoff Schwartz Is Smarter Than You' podcast. Just a Fat Kid Living a Dream. ✡️