
It's only a single study, this issue is very uncertain with research coming quite thick & fast with a wide range of findings, more observational data is needed, but.... fuck. www.theguardian.com/environment/...
29.08.2025 09:49 — 👍 22 🔁 15 💬 2 📌 0@lukasdata.bsky.social
Data scientist working on ecosystem fluxes @Grassland Sciences group, ETH Zurich, Switzerland. Helping with Swiss FluxNet, ICOS and open science.

It's only a single study, this issue is very uncertain with research coming quite thick & fast with a wide range of findings, more observational data is needed, but.... fuck. www.theguardian.com/environment/...
29.08.2025 09:49 — 👍 22 🔁 15 💬 2 📌 0
Here is a copy of our most recent state of the climate report. We are on the brink of an irreversible climate disaster. This is a global emergency beyond any doubt. Much of the very fabric of life on Earth is imperiled. . . . . . doi.org/10.1093/bios...
15.07.2025 19:41 — 👍 36 🔁 27 💬 1 📌 4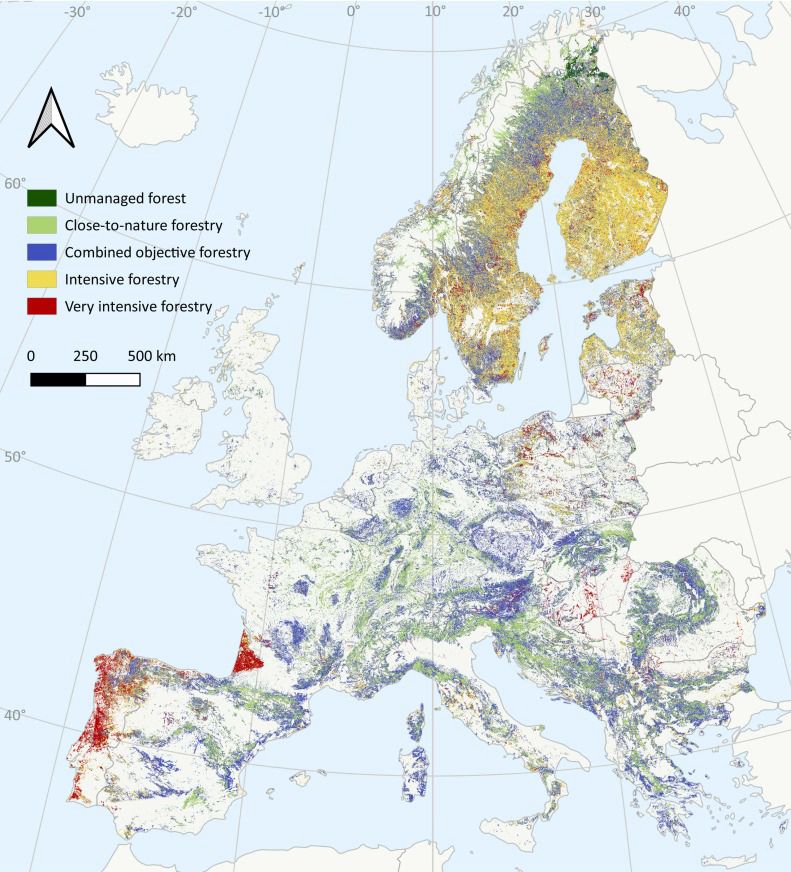
Map of Europe and their forest use. Very little (1%?) is not managed at all
Very cool paper!
It is shocking how few forest areas in Europe are not managed www.sciencedirect.com/science/arti...
Interpretable Machine Learning Reveals the Crucial Role of Water Availability in Regulating Thermal Optimality of Terrestrial Ecosystems 2025 JGeophysicalResearch: Machine Learning and Computation agupubs.onlinelibrary.wiley.com/doi/10.1029/...
@arman-ahmadi.bsky.social @fluxnet.bsky.social

Line graph time series of global land mean surface temperature anomalies for each January-May period from 1850 through 2025. There is a long-term increasing trend and large year-to-year variability. The mean surface temperature anomaly averaged for January-May 2025 was 2.05°C for global land areas. Anomalies are computed relative to a 1901-2000 climate baseline. Data from NOAA/NESDIS/NCEI NOAAGlobalTemp v6.0.0.
This is quite eye-opening to me anyways... temperatures averaged over land areas so far this year are statistically tied for the warmest on record!
Data from www.ncei.noaa.gov/products/lan...
And now here is visualization of these changes in temperatures over land areas for the last 100 years. Heating up over the long-term and now record warm.
17.06.2025 00:15 — 👍 146 🔁 60 💬 1 📌 4For more details visit
climate.copernicus.eu/climate-bulletins
climate.copernicus.eu/role-data-vi...
12.05.2025 10:30 — 👍 5 🔁 3 💬 0 📌 0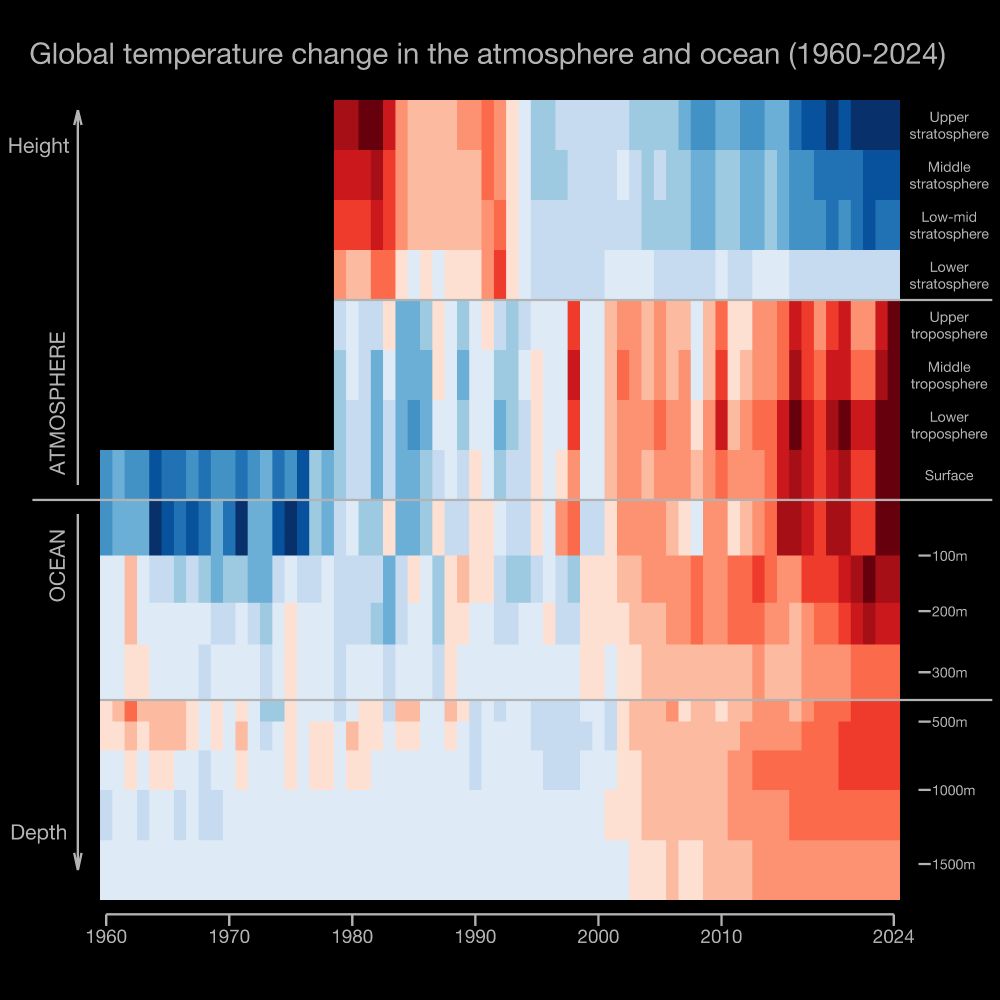
Updated Climate Visuals
(1) Warming stripes for atmosphere and ocean
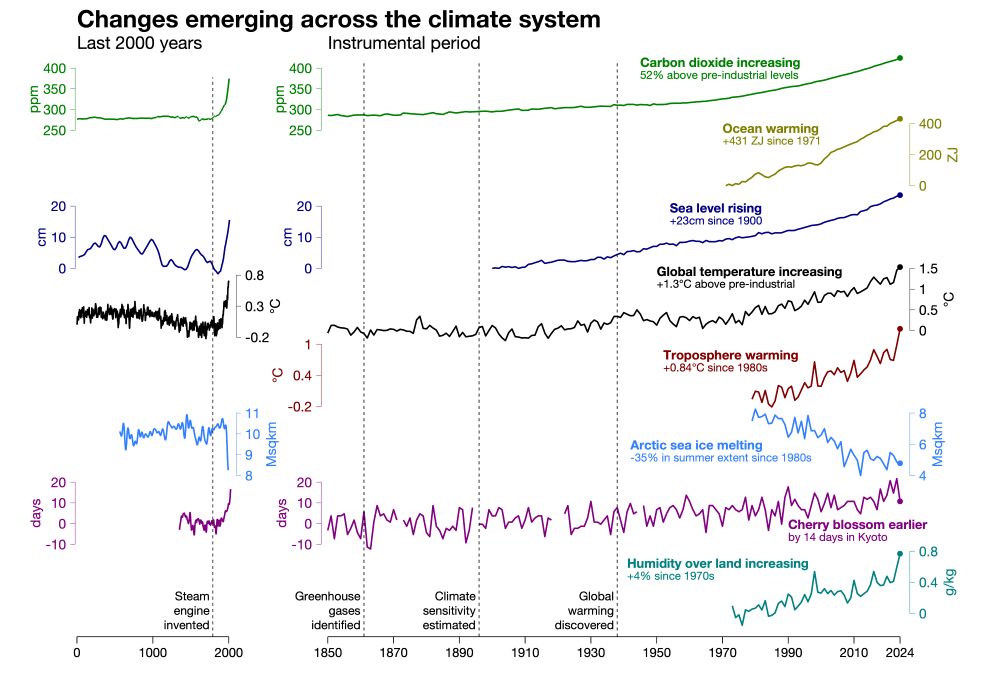
(2) Climate indicators (adding land humidity for 2024)
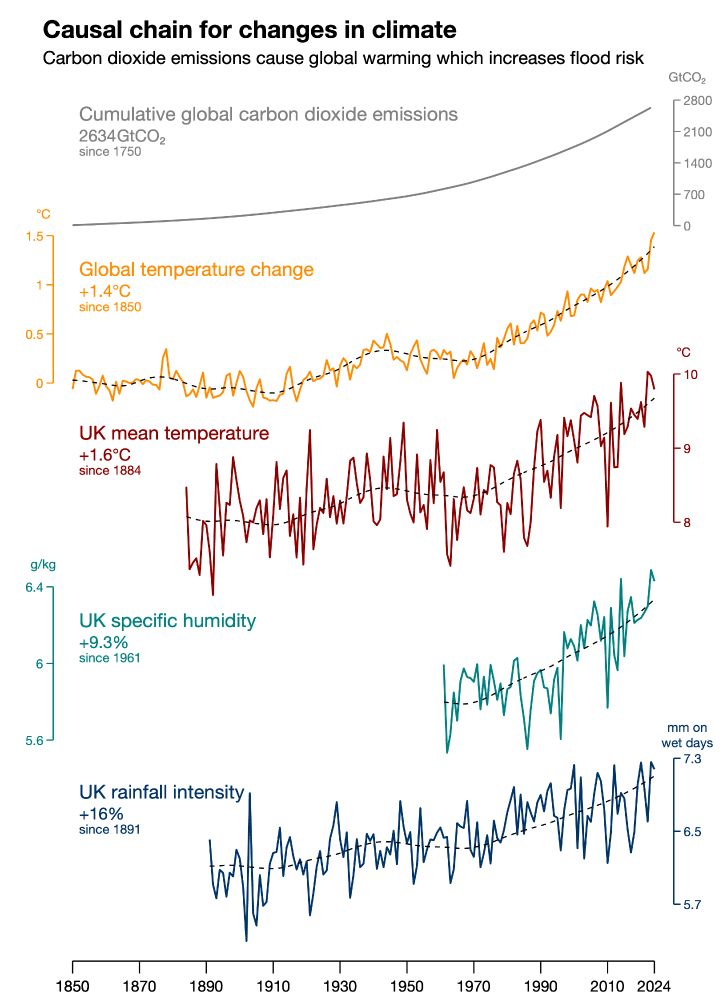
(3) UK climate indicators (adding some 2024 data)
ed-hawkins.github.io/climate-visu...
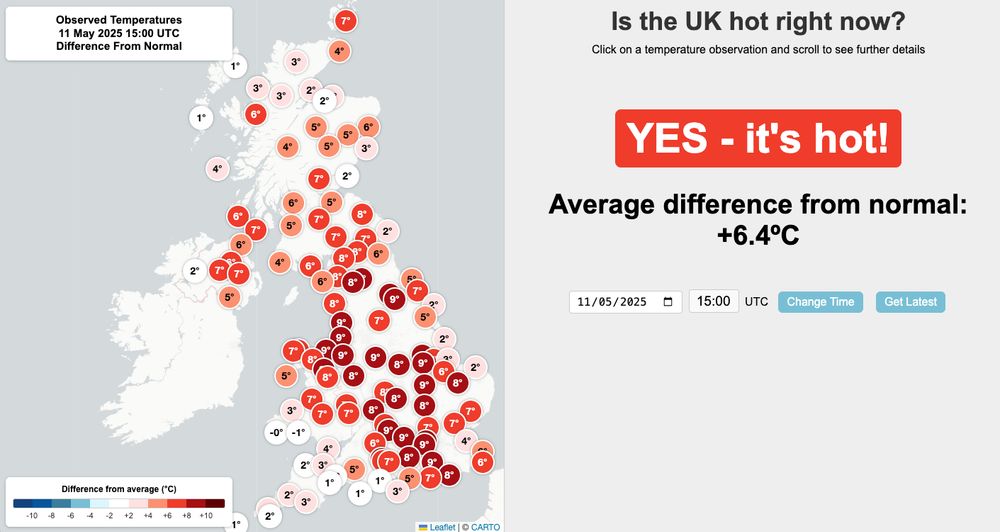
Map showing hot much warmer than usual it is right now
Coming soon: a website showing exactly how much warmer or cooler than usual the UK is right now.
If you live in the north-west of England it is currently a lot warmer than usual for the time of year and time of day.

Graph showing daily global mean near-surface air temperatures for 2025. This is also compared to the daily data from the 1971-2000 average, 1981-2010 average, and 1991-2020 average. Annotations are also shown to the current year with the other years from 1940 to 2024 and a threshold of 2°C above the 1850-1900 pre-industrial level. There is a strong seasonal cycle, with a peak during the boreal summer season. There is a long-term warming trend. 2024 is also indicated, which was the warmest year on record. Data is from ECMWF ERA5 reanalysis and updated through 11 April 2025.
Global temperatures are once again near record highs over the last few days.
Graphic updated in near real-time at zacklabe.com/climate-chan...
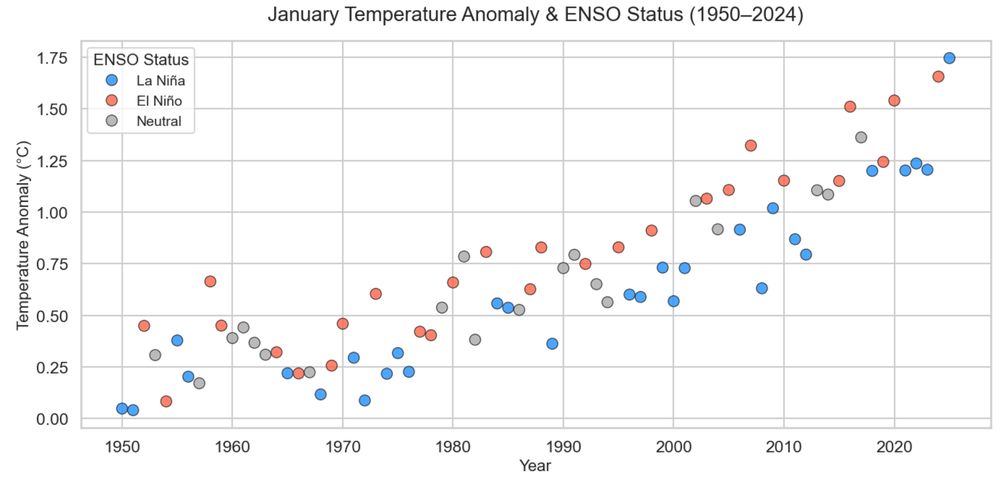
A lot of folks asked why I through this January's record global temperatures were so unexpected.
I think this graph shows it pretty clearly: pretty much every other January with La Nina conditions has been a cooler than the surrounding years.
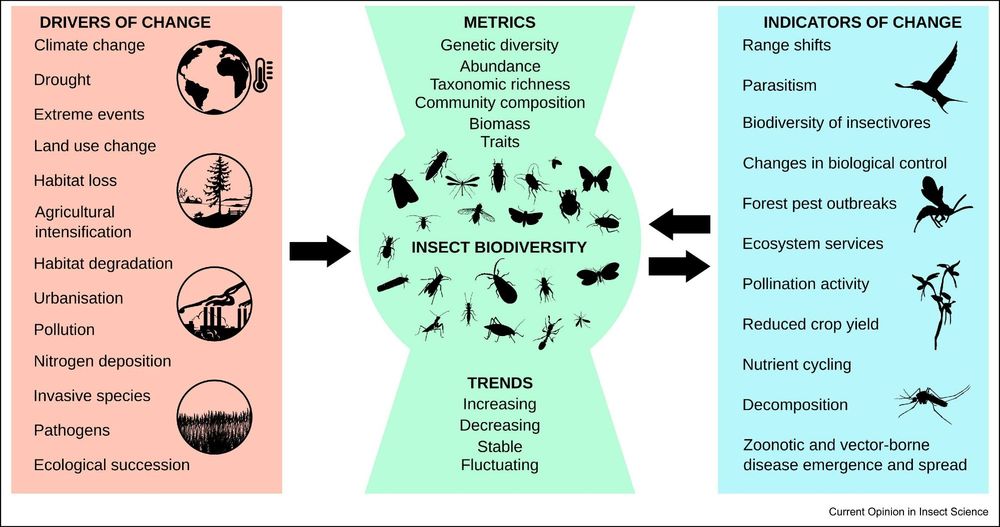
Figure from a paper - legend: Figure 2. Measuring changes in insect biodiversity can be achieved by focusing on drivers that directly or indirectly impact insect biodiversity metrics and trends (left). Where data on insect populations specifically are unavailable, data from other species and ecological processes can provide inferential support for changes in insect biodiversity (right).
Our new paper led by @manusaunders.bsky.social www.sciencedirect.com/science/arti... takes stock of the evidence-base for global insect declines 🦋🐝🪳🪰🦗 and how uncertainty is being leveraged by science denialists to undermine efforts to reverse biodiversity loss 🌍🧪.
04.02.2025 09:22 — 👍 257 🔁 112 💬 7 📌 6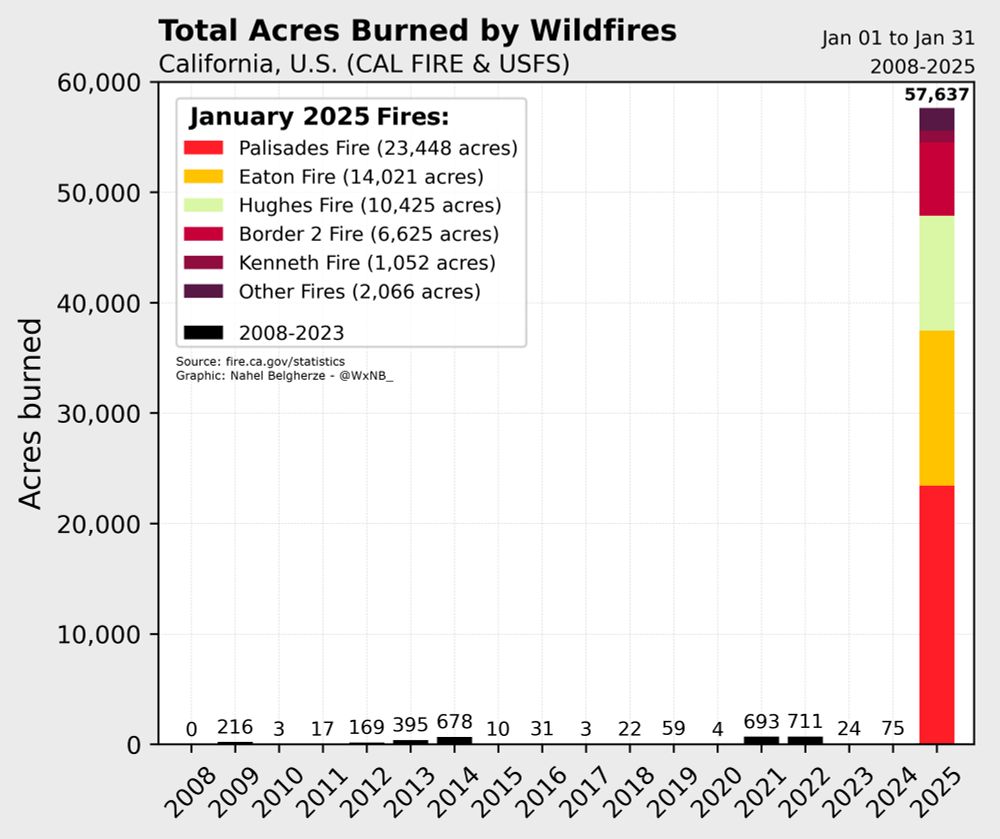
More acres have been burned by wildfires in January 2025 across California than in all the Januarys of the past 30+ years combined.
Unreal.

Figure 1. (a, left) Deseasonalised global-mean Earth energy imbalance. Piece-wise linear trend fits are based on combined DEEP-C and CERES data (green, with break point of July 2010) and CERES only (red, with break point at August 2010). (b, right) Earth energy accumulation (integrated EEI) from combined DEEP-C and CERES. Merchant et al. (2025) ERL http://doi.org/10.1088/1748-9326/adaa8a

Figure 2. (a) Deseasonalised monthly mean sea surface temperature between 60°N and 60°S (GMSST). Blue line: observed timeseries from the European Space Agency Climate Change Initiative (ESA CCI). Orange line: fit to observed timeseries using Earth Energy Accumulation (EEA), El-Niño Southern Oscillation (ENSO) index, volcanic stratospheric aerosol and top-of-atmosphere total solar irradiance as predictors. (b) The components of the fit, i.e. the scaled predictors that (with an offset parameter not shown) sum to give the fitted curve in panel (a). Merchant et al. (2025) ERL http://doi.org/10.1088/1748-9326/adaa8a

Figure 3. EEI from 2000 to 2024 and three scenarios for the evolution of trends in EEI, used to derive scenarios for future EEA. Merchant et al. (2025) ERL http://doi.org/10.1088/1748-9326/adaa8a

Figure 4. GMSST observations and data-driven future scenarios. The shaded band encompasses 99% of expected ENSO variability around the outer EEI-based scenarios. Merchant et al. (2025) ERL http://doi.org/10.1088/1748-9326/adaa8a
I found better versions of the figures in the accepted version for now
28.01.2025 12:34 — 👍 17 🔁 2 💬 2 📌 1
Figure 2 of Merchant et al. showing how an acceleration in Earth's energy accumulation trumps other natural drivers in explaing ocean warming

Earth's energy imbalance that is driving climate change is increasing, particularly so since 2010 and this accumulation of energy is accelerating global warmimg (Fig. 1 of Merchant et al.)
Level of global warmth in 2023/24 can only be explained by an acceleration of human caused #climate change based on @ioppublishing.bsky.social statistical analysis of multiple drivers: doi.org/10.1088/1748...
28.01.2025 09:10 — 👍 60 🔁 28 💬 4 📌 4
A joy to visualise this good climate news ☀️
Solar is growing in every EU country and, for the first time in 2024, generates more electricity than coal.
Plenty more powerful and positive insights in
@ember-energy.org's European Electricity Review 2025 out today ➡️➡️➡️ ember-energy.org/latest-insig...
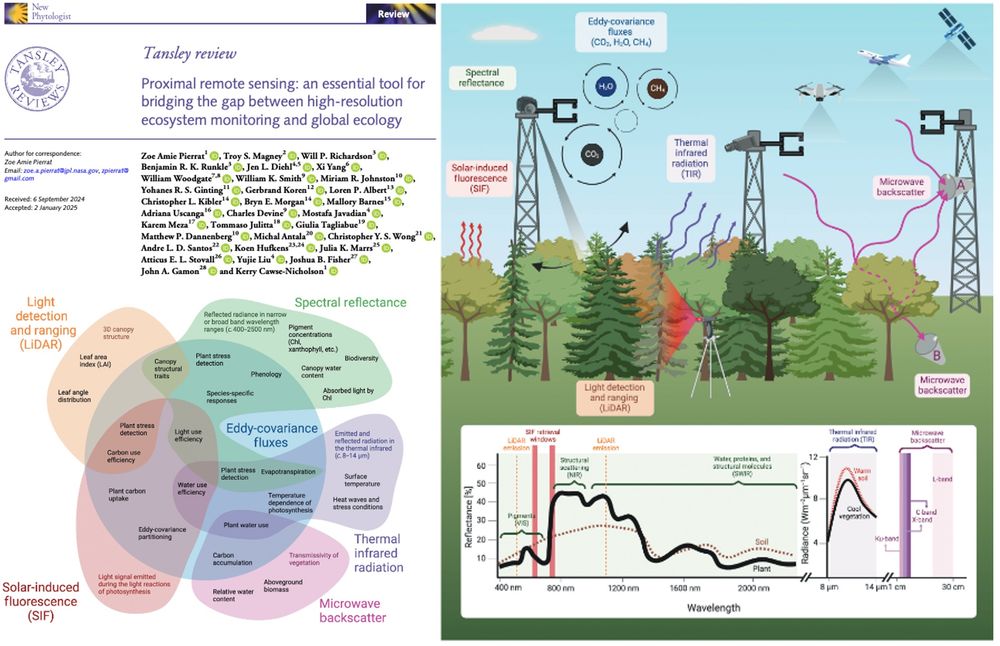
Overview of proximal remote sensing instruments at a flux tower site. Shown are three eddy-covariance towers with sonic anemometers collecting data to derive ecosystem fluxes. Shown for spectral reflectance and solar-induced fluorescence (SIF) is a hyperspectral sensor with a narrow field-of-view (FOV) and multi-directional scanning capabilities (Sections II.1 and II.2). We also show the direct emission of SIF from the forest canopy (Section II.2). For thermal infrared radiation, we show a fixed thermal camera and thermal radiation coming from the canopy (Section II.3). For microwave, we show two potential arrangements with antenna A receiving direct signals from under open-sky conditions as well as signals that are reflected from the underlying vegetated surface, and antenna B receiving a direct signal that is propagated downward through the vegetation canopy and attenuated by its moisture content (Section II.4). We also show a light detection and ranging (LiDAR) instrument emitting light to get a 3D representation of canopy structure (Section II.5). Above the forest are a drone, aircraft, and satellite to emphasize the potential of proximal remote sensing to complement observations across scales. In the inset plot, we show sample reflectance spectra for vegetation and wet soil and highlight key wavelength ranges for spectral reflectance. We also show typical SIF retrieval windows and LiDAR emission windows. Next to the reflectance spectra, we show sample radiance in the thermal infrared region, with example spectra for warm soil and cool vegetation. Finally, we show key measurement wavelength bands for microwave backscatter.
New Tansley review paper from Zoe Pierrat & friends in @newphyt.bsky.social linking proximal remote sensing with ecosystem fluxes!
Synergies and best practices for hyperspectral reflectance, SIF, thermal, microwave and lidar 🌈🌲🗼🛰️🧪
nph.onlinelibrary.wiley.com/doi/10.1111/...
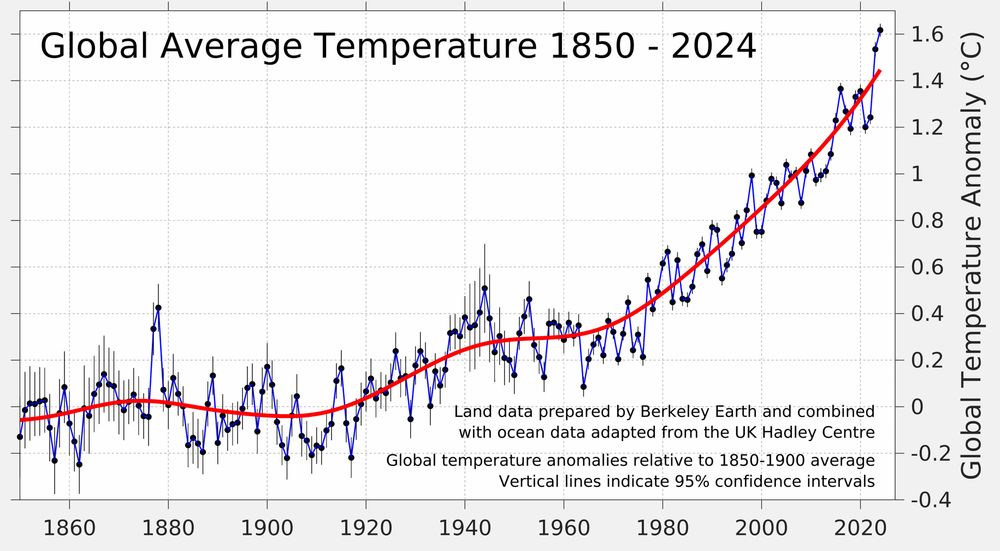
Physics does not care about our politics, and ultimately the world will continue to warm until we get global emissions of CO2 to (net) zero.
22.01.2025 04:30 — 👍 580 🔁 208 💬 22 📌 12
Chart du jour: In the EU, solar provided more electricity than coal for the first time in 2024.
23.01.2025 13:06 — 👍 185 🔁 21 💬 2 📌 3Holy moly - 76% of global insured losses in the US!
22.01.2025 06:10 — 👍 33 🔁 11 💬 4 📌 2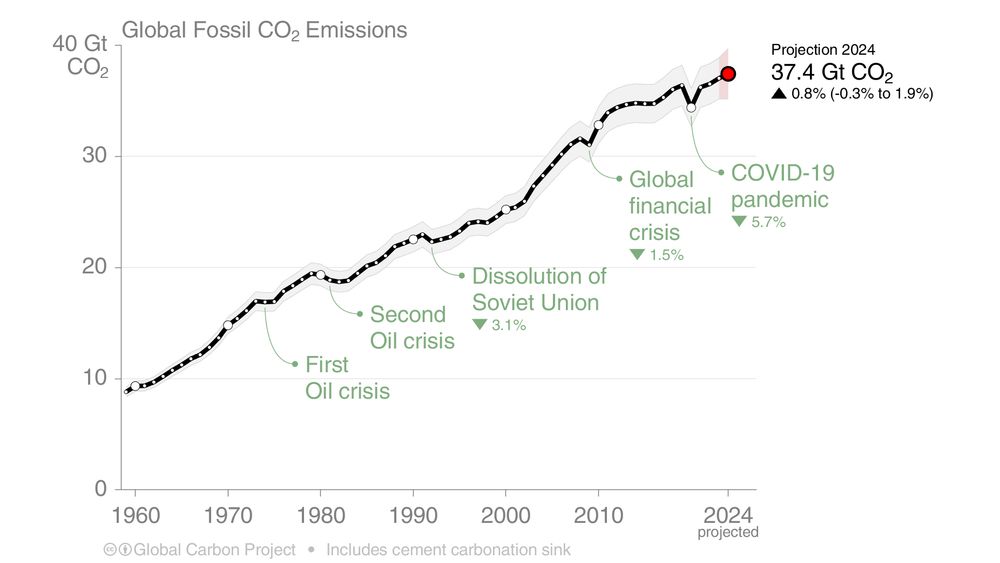
📢Global Carbon Budget 2024📢
Despite some predicting a peak in global fossil CO2 emissions, we estimate growth of 0.8% [-0.3% to 1.9%] in 2024. Maybe a peak next year?
Is it all bad news, or can we find some good news?
essd.copernicus.org/preprints/es...
1/

2024 marks the first year with every day above 1.25°C above pre-industrial level. 75% of days exceeded 1.5°C.
Explore the full analysis, charts, and data in the Global Climate Highlights 2024 report: bit.ly/40kQpcz
#C3S #GCH2024

🌡️ A record-breaking climate year in seven key charts. Discover the data from the Global Climate Highlights 2024 report: bit.ly/3DZs8jn
#C3S #CopernicusClimate
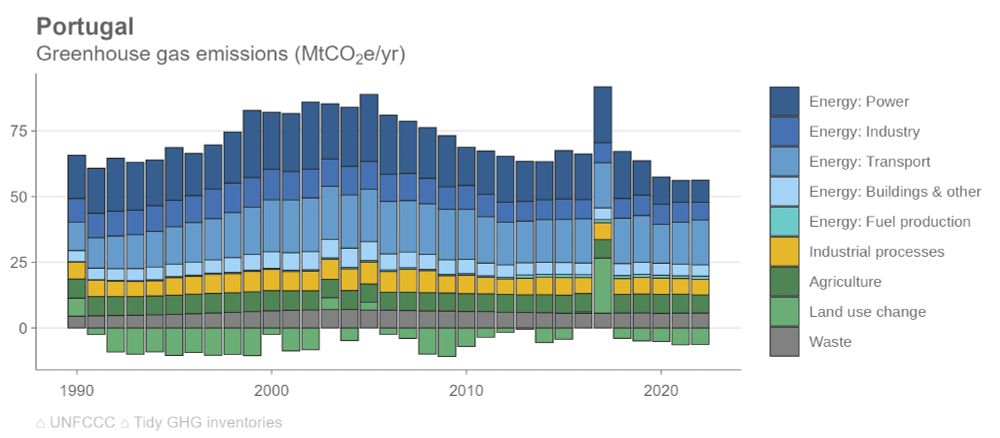
Heres what happens when you have a major wildfire event and still account for it in your inventory:
Portugal 2017 (~18MtCO2)

A graphic showing national greenhouse gas emissions of Australia and Canada from 1990 to 2022, based on data from their national GHG inventories. Emissions and removals are also shown for the inventory memo "natural disturbances on managed land", which would influence national totals if they were included. The 2020 wildfire in Australia released GHG emissions equivalent to all anthropogenic emissions that year - but a full accounting of the event should also take into account removals from subsequent regrowth, as shown in later years.
Countries can classify emissions from wildfires (and subsequent removals from regrowth) as a memo item in their national greenhouse gas inventories, excluding them from the total. So far Australia and Canada have done this - including Australia's massive 2020 wildfire.
16.01.2025 11:20 — 👍 38 🔁 14 💬 6 📌 1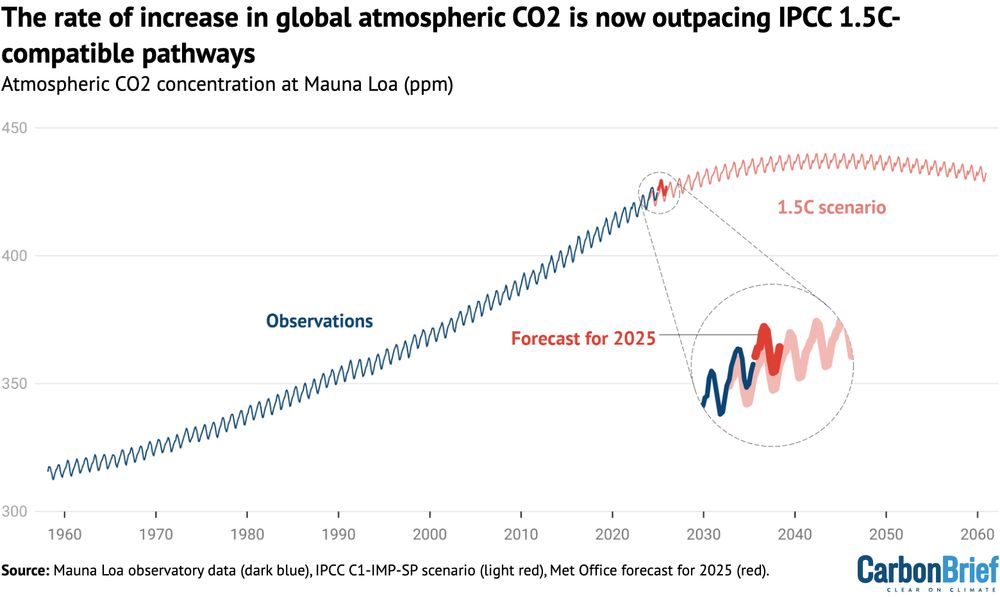
New article – Met Office: Atmospheric CO2 rise now exceeding IPCC 1.5C pathways
✍️ By @richardabetts.bsky.social from @metoffice.bsky.social
Read here ⬇️
https://buff.ly/4hjNiHm
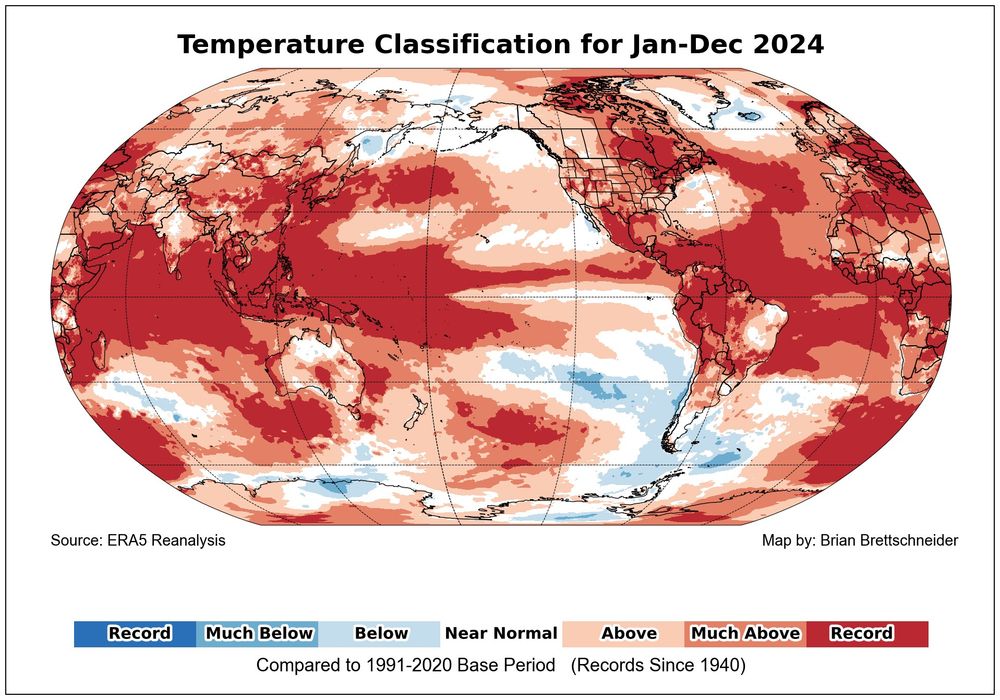
Here are all 9 of the global climate variables I track depicted as categorical values compared to the 1991-2020 period. First, temperature. As noted previously, it was the warmest year on record. 1/9
17.01.2025 05:51 — 👍 228 🔁 61 💬 7 📌 4