Tenure track researcher in Aquatic Ecosystem Modelling
We seek an aquatic ecosystem modeller who integrates this expertise with real-world “wet boots” and experimental experience. The successful candidate will conduct research in a department with world-c...
NIOO seeks an aquatic ecosystem modeller who integrates this expertise with real-world “wet boots” and experimental experience for a tenure track researcher position. Do you have a PhD in ecology, biodiversity, or a related field? Respond to the vacancy by 12 December: nioo.knaw.nl/en/vacancies...
25.11.2025 12:42 — 👍 1 🔁 0 💬 0 📌 0

Figure 1 in Cuchot et al. (2025): "Locations of constant capture effort sites (CES). Colors represent the number of years of monitoring per site. Map lines delineate study areas and do not necessarily depict accepted national boundaries."
New publication: Phenological Plasticity and Its #Temperature-Related Drivers in Common #Songbirds Across Europe. #climatechange #phenology
doi.org/10.1111/gcb....
21.11.2025 10:39 — 👍 2 🔁 3 💬 0 📌 0

Figure 1 in Reiss et al. (2025): "Sampling area elevation (A), soil moisture (B), soil CH4 fluxes (C), N2O fluxes (D), methanotrophy (E), NO3− reduction (F), and N2 fixation (G) during the EXP period. CP sampling points (9-12) are shown in red, and FP sampling points (1-8) are shown in blue. The relative abundance of functionally annotated taxa from the sequencing data (FAPROTAX) was used for interpolation (E–G)."
New publication: Temporal and spatial dynamics of microbial communities and #greenhousegas flux responses to experimental #flooding in riparian #forest soils. #climatechange
doi.org/10.1093/fems...
21.11.2025 10:30 — 👍 3 🔁 1 💬 1 📌 0

Figure 6 in Hu et al. (2026): "Relationship between microbial diversity and network complexity, network complexity and stability (A), Structural equation modelings (SEMs) showed the effect of high diversifying afforestation, soil total carbon (TC) and microbial alpha diversity on microbial network complexity and stability (bacteria for B, Fungi for C). Black arrow indicates the positive effect. ∗, ∗∗ and ∗∗∗ indicated P < 0.1, 0.01 and 0.001, respectively."
New publication: Long-term diversifying #afforestation enhances #soil microbial network complexity and stability. #biodiversity #climatechange #microbialnetwork
doi.org/10.1016/j.en...
21.11.2025 10:23 — 👍 5 🔁 2 💬 1 📌 0

Figure 1 in Lubbers et al. (2025): " Phenotypic analysis of K. viridifaciens ΔdivIVA expressing divIVA variants. (A) Cartoon and surface representation of DivIVA of K. viridifaciens made using AF3. Structured domains are represented in blue, and unstructured domains are depicted in light brown. The PAE plot is shown on the right. Low confidence values are yellow, high values are blue. pLDDT values—per-residue measures of local confidence—can be found in electronic supplementary material, figure S1. (B) L-form strains expressing different divIVA alleles were tested for growth as L-forms on LPMA medium (left two images) and for the ability to revert to walled growth on non-osmoprotective plates (right two images). Scale bar = 2 mm. (C) Schematic overviews showing the architecture of the DivIVA variants from panel B, relative to the wild-type protein (top), which contains four domains: an N-terminal domain (M1-N65), which we have subdivided into a membrane-binding structure (N) (M1-D23) (light red line) and a coiled-coil region (CC1) (E24-N65) (light blue box), an intercoil region (IR) (M66-G224) (yellow line), a larger coiled-coil domain (CC2) (D225-P345) (dark blue box), and a C-terminal domain (C) (P346-N445) (dark red line). (D) Quantification of the average colony area for strains expressing DivIVA variants (n = 30). (E) Quantification of colony solidity for strains expressing DivIVA variants (n = 30). Solidity was calculated by dividing the colony area by the convex area. (F) The number of reverted colonies per strain per reversion plate (n = 3)."
New publication: Essential and dispensable domains of #DivIVA for walled growth in filamentous #Actinomycetota, by @gillesvanwezel.bsky.social and others. #hyphalgrowth
doi.org/10.1098/rsob...
18.11.2025 10:34 — 👍 0 🔁 0 💬 0 📌 0

Figure 2 in Budisa et al. (2025): "Salinity (color gradient) and oxygen saturation (red dashed lines) in the surface waters of the salt marsh, the channel, and the sea during all seasons and both tides (HT, LT). Light grey represents areas submerged during winter/autumn HT, while darker grey areas emerged during summer/spring LT"
New publication: Microbial and trophic shifts in the #saltmarsh Palud-Palù, Adriatic Coast. #climatechange #trophicconditions #microbialcommunity
doi.org/10.1007/s131...
18.11.2025 10:27 — 👍 0 🔁 0 💬 0 📌 0

Help jij ons om gegevens van het SoilProS project compleet te maken door grondeigenaren of -beheerders te bellen?
Totaal: 6 weken 30.4 uur per week, of een andere indeling bijvoorbeeld naast je studie als dat voor jou beter werkt.
Bekijk de vacature op onze website: nioo.knaw.nl/nl/vacatures...
14.11.2025 14:34 — 👍 1 🔁 1 💬 0 📌 0

Figure 2 in Waclawiková and others (2025): "Serotonin metabolism protects P. fluorescens from oxidative stress possibly via upregulation of phenylalanine and tyrosine catabolic pathways. A RNA-seq experimental design. B Heat map of the genes that are significantly regulated (at 10 and 12 h) in the presence of serotonin as compared to the untreated control. Data represent log2(fold change). FDR ≤ 0.05, fold change ≥ 2. GSEA analysis of upregulated genes from stimulation with serotonin (FDR ≤ 0.05, fold change ≥ 2) after 10 h and 12 h. Data show -log2(p value) for specific GO biological pathways (bar graphs on the left); number of genes involved in the regulated pathways (bar graphs in the middle); and, expression patterns of individual genes involved in the regulated pathways (graphs on the right). C Volcano plots of differentially abundant proteins after 12 h (left panel) and 24 h (right panel) of stimulation with serotonin in P. fluorescens. D Overview of phenylalanine, tyrosine and arginine catabolic pathway and its regulation by serotonin on the RNA and protein level"
New publication: #Serotonin modulation of #metabolism and #stress response in Pseudomonas fluorescens, by @gillesvanwezel.bsky.social and others.
doi.org/10.1186/s129...
14.11.2025 08:30 — 👍 4 🔁 2 💬 0 📌 0

Figure 1 in Dong et al. (2025): "Fecundity schedules (mean number of spiderlings per female produced in each consecutive egg sac) of female Steatoda grossa spiders fed constantly with late instar cricket nymphs (red boxes) or intermittently with mid instar cricket nymphs (blue boxes). Boxes represent the interquartile range (IQR) of the data with the top and bottom edges of the box indicating the first and third quartiles. Black lines inside boxes represent the median. The whiskers extend from the box to the minimum and maximum values within a certain range, and data points beyond whiskers are considered outliers"
New publication: Food availability influences adult body mass variability and reproductive traits in a #spider. #falsewidow #fecundityschedule #reproduction #eggsac
doi.org/10.1007/s004...
07.11.2025 09:47 — 👍 1 🔁 0 💬 0 📌 0

Figure 1 in Ohlert et al. (2025): "Overview of the IDE: geographic locations, drought treatments, and effects on aboveground productivity."
New publication: #Drought intensity and duration interact to magnify losses in primary productivity. #climatechange #grassland #shrubland
doi.org/10.1126/scie...
29.10.2025 10:30 — 👍 1 🔁 1 💬 0 📌 0

Figure 1 in Moinet et al. (2025): "Left panel: locations of the 45 grassland fields (green circles) and 37 cropland fields (blue circles). Right panel: distribution of the fields according to their textural classes on the International Society of Soil Science texture classification system."
New publication: Sustainable intensification: time to question the goal of ever-increasing agricultural production. #sustainablelanduse #agriculture
doi.org/10.1016/j.ge...
29.10.2025 10:21 — 👍 3 🔁 1 💬 0 📌 0
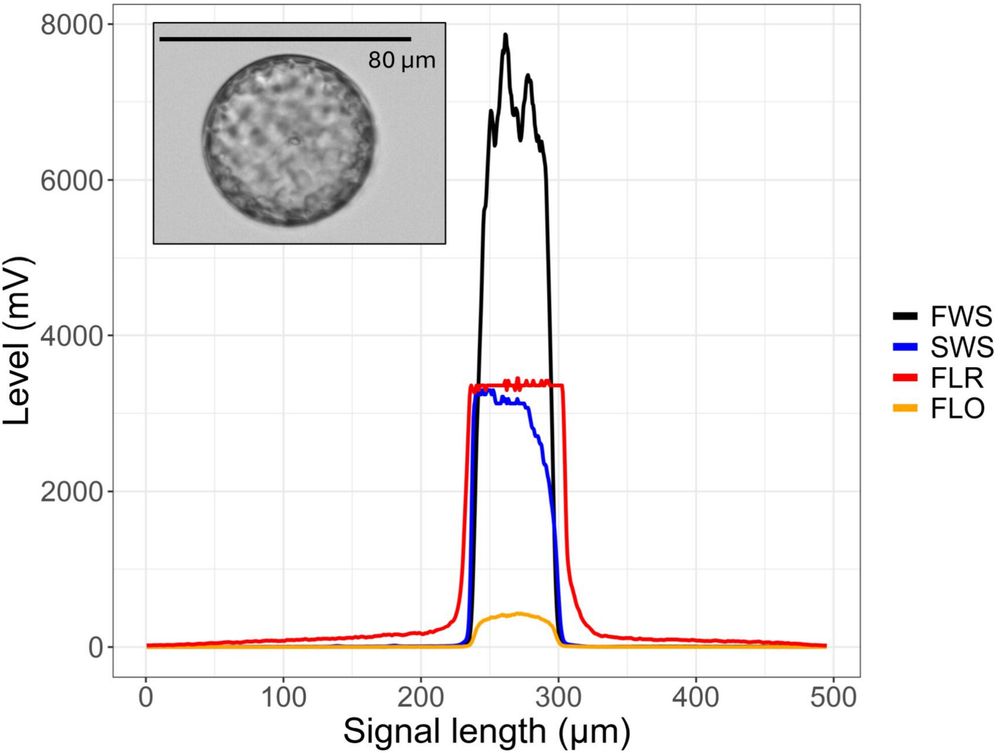
Figure 5 in Gallot et al. (2025): "Effect on the pulse shape of a diatom when PMT saturation by red photons generates a plateau at around 3300 mV (CS-2015-68). Trigger level was set to FLR 25 mV and PMT voltage to “Medium”."
New publication: Best Practices for Optimization of #Phytoplankton Analysis in Natural Waters Using CytoSense #FlowCytometers.
doi.org/10.1002/cyto...
29.10.2025 10:16 — 👍 1 🔁 1 💬 0 📌 0

Figure 1 in Nousiainen et al. (2025): "Map of the spatial distribution of the constant effort ringing sites (CES) chosen for the analysis, colored by the ringing scheme. Acronyms of countries belonging to the same scheme are listed. The three schemes of Spain are separated with letters A, B, and C. CZE = Czechia, DEU = Germany, ESP A = Spain Aranzadi, ESP B = Spain, ESP C = Spain Catalonia, FIN = Finland, GBR = Britain, IRL = Republic of Ireland, HUN = Hungary, ITA = Italy, NLD = Netherlands, SWE = Sweden"
New publication: Adult survival has a stronger role than productivity in the annual population change of European #songbirds. #biodiversity #populationchange #passerines
doi.org/10.1007/s004...
29.10.2025 10:10 — 👍 3 🔁 0 💬 1 📌 0

Figure 1 in Kempel et al. (2025): "(A) Location of the current 36 BugNet experimental sites worldwide, and in (B) Europe. (C) Whittaker biome plot of site locations, showing the mean annual temperature (°C) and mean annual precipitation (cm) for all experimental sites. Climate data are taken from CHELSA and represent the average over 1980–2010 (Karger et al. 2017). The Whittaker biome plot was plotted using the plotbiomes package in R (Stefan and Levin 2018)."
New publication: The Bug-Network (BugNet): A Global Experimental Network Testing the Effects of #Invertebrate Herbivores and Fungal Pathogens on #PlantCommunities and Ecosystem Function in Open Ecosystems. #biodiversity
doi.org/10.1002/ece3...
29.10.2025 10:04 — 👍 3 🔁 1 💬 1 📌 0

Figure 3 in Huang et al. (2025): "Co-occurrence network graphs of microbial taxa (at the genus level) at sampling sites with different vegetation types along an elevation gradient. Each node signifies a genus, colors of the nodes indicate different phyla, while phyla with relative abundance < 1 % are merged as “others” and are shown in grey. The size of each node is proportional to the number of edges (degree). A red edge indicates a positive interaction between two individual nodes, while a blue edge indicates a negative interaction."
New publication: Greater influence of #eukaryotes on #carbondegradation potentials than #prokaryotes along an elevation gradient. #climatechange #soil
doi.org/10.1016/j.pe...
29.10.2025 09:52 — 👍 1 🔁 1 💬 1 📌 0

Graphical abstract Venetz et al. (2025).
New publication: Long-Term #Euxinia Restricts Microbial #Methane Removal in Eutrophic Coastal Basins. #coastalecosystems
doi.org/10.1021/acs....
29.10.2025 09:41 — 👍 2 🔁 1 💬 1 📌 0

Figure 1 in Peso et al. (2025): "Illustration showing different non-mutually exclusive trajectories of community assembly in new habitats: (1) coexistence of early and later arriving species (nestedness), (2) replacement of early by later arriving species (turnover), (3) early species dominance leading to priority effects, and (4) community changes due to environmental change and colonisation by other organism groups. Real-life scenarios may involve a mix of these trajectories."
New publication: Community Assembly of Cladoceran #Zooplankton in Relation to #Pond Age and the Establishment of #Macrophytes and #Fish. #communitycomposition #biodiversity
doi.org/10.1111/fwb....
29.10.2025 09:34 — 👍 1 🔁 0 💬 0 📌 0

Figure 6: Examples of objects used.
New publication: A large-scale study across the avian clade identifies ecological drivers of #neophobia, by @utkurhan.bsky.social @keesvanoers.bsky.social and others. #ManyBirdsProject #birds #animalmigration
doi.org/10.1371/jour...
29.10.2025 08:22 — 👍 2 🔁 0 💬 0 📌 1

PhD Seasonal Timing of Egg Overwintering Insects under Climate Change
Climate change is exerting strong selection on wild populations, with many species showing shifts in the seasonal timing of development. One particularly vulnerable group are insect species that overw...
PhD candidate #vacancy alert:
Insect species that overwinter as eggs are particularly vulnerable to climate change. We are looking for a PhD candidate to collect more data to predict whether these insects can adapt to climate change.
Read the vacancy on our website: nioo.knaw.nl/en/vacancies...
28.10.2025 12:31 — 👍 1 🔁 2 💬 0 📌 0

Graphical abstract Bouma et al. (2026).
New publication: Multi-year water level drawdown and #wildlife grazing drive #wetland vegetation succession. #waterlevelmanagement #Oostvaardersplassen
doi.org/10.1016/j.ec...
17.10.2025 08:55 — 👍 1 🔁 0 💬 0 📌 0

Figure 3 in Shi et al. (2025): "The survival probability of Gelis agilis females was studied in microcosmos arenas that differed in complexity, and in which provisioning of food and cocoons was (a) temporally or (b) spatially separated. In single dish arenas with 1, 2, 4, 8 or 16 compartments, respectively (a), provisioning of food and cocoons was alternated every 48 h. In two-dish arenas with 1, 4 or 9 compartments, respectively, connected by a tube (b), food was offered in one dish and cocoons in the other. In the two-dish arenas, food and cocoons were replaced every 48 h, but were both provided simultaneously. The dotted lines depict median survival, and the coloured shaded areas represent the 95% confidence interval for the survival curves. The number of replicates is 10 per arena type in (a) and 30 in (b). In (b), the arrows on the x-axis represent the median longevity of females provided only with food and no hosts (experiment 2.2)."
New publication: Heterogeneous microcosm mazes affect reproduction and survival in a wingless #hyperparasitoid #wasp. #parasitoidwasp
doi.org/10.1016/j.an...
17.10.2025 08:47 — 👍 0 🔁 0 💬 0 📌 0

Ga nog snel op safari in eigen tuin. Tot 31 oktober kun je je waarnemingen nog doorgeven voor de #Bodemdierendagen 2025. Doe mee: bodemdierendagen.nl/nl/doe-mee
Liever je handen schoon houden? Schrijf een elfje, zet het #bodemleven op die manier in de spotlight! bodemdierendagen.nl/nl/elfjes
14.10.2025 11:35 — 👍 1 🔁 1 💬 0 📌 0

Natuur in het licht – waarom het donker belangrijk is
Sinds 2012 wordt er bij het Nederlands Instituut voor Ecologie (NIOO-KNAW) onderzoek gedaan naar het effect van nachtelijk kunstlicht op onze natuurlijke omgeving. Voor dit onderzoek – Licht op Natuur...
Het is steeds minder #donker 's nachts. Voor mensen voelt het misschien veilig, maar wat voor effecten heeft dat #licht 's nachts op de #natuur? Het NIOO doet hier sinds 2012 #onderzoek naar. Lees verder over wat dit #kunstlicht doet met #nachtdieren: nioo.knaw.nl/nl/nieuws/na... #lichtvervuiling
14.10.2025 07:47 — 👍 4 🔁 2 💬 0 📌 0

Figure 3 in Heartz et al. (2025): "Scanned version of the 1985 operations map showing treatment polygons for Cape George, Nova Scotia. This map was used by the operations team to assign aircraft; clear polygons are fixed-wing assigned areas, yellow is helicopter assigned area"
New publication: Historical #insecticide applications for the treatment of #forest #insect pests from 1968 to 2017, in Nova Scotia and Newfoundland and Labrador, Canada, by @jbburant.bsky.social and others. #pestmanagement
doi.org/10.1186/s135...
10.10.2025 10:02 — 👍 0 🔁 0 💬 0 📌 0

Figure 3 in Johnson et al. (2025): "Virus gene-product-sharing model"
New publication: Living Together Apart: Quantitative Perspectives on the Costs and Benefits of a Multipartite Genome Organization in #Viruses, by @marcellejohnsonphd.bsky.social @diekeboezen.bsky.social and others. #multipartitevirus #plantvirus
doi.org/10.3390/v170...
10.10.2025 09:43 — 👍 2 🔁 0 💬 0 📌 0

Figure 1 in Van Galen et al. (2025): "The PLFA and enzyme activity database contains 12,258 samples from 3,743 locations. The purple colour gradient shows the degree to which climatic space is represented by the samples (scale of 0 to 1, see Technical Validation section). Grey regions do not have sufficient climate data available to evaluate climatic representation. The histogram and donut plots show number of samples (in parentheses) from the PLFA (blue) and enzyme (red) datasets collected in different years, from different continents, from different biomes43, and within different categories of maximum sample depth. Only large segments of donut plots are labelled. Temp. = temperate."
New publication: A global #database of #soil microbial phospholipid fatty #acids and #enzyme activities. #microbialcommunities
doi.org/10.1038/s415...
09.10.2025 08:58 — 👍 3 🔁 1 💬 1 📌 0

Graphical abstract Van Wijk et al. (2026).
New publication: A versatile model of #nutrientretention in relation to #ecosystem state in #shallowlakes: GPLake-R. #coexistence #eutrophication #lakes
doi.org/10.1016/j.wa...
09.10.2025 08:44 — 👍 0 🔁 0 💬 0 📌 0

Figure 7 in IJdema et al. (2025): "Overview of the biosynthetic gene clusters and Gene Cluster Families. The ovals in the figure represent the contigs extracted from the metagenomics dataset that were identified as secondary metabolite gene clusters (or biosynthetic gene clusters, BGCs) by antiSMASH. The taxonomic identification of each BGC based on a similarity search in GenBank is provided. Next, BGCs from the metagenomics dataset and BGCs from the MIBiG reference database (shown as grey arrowheads) with similar functionalities were clustered together in a network of gene cluster families (GCFs). A total of 16 GCFs were identified and classified per category (non-ribosomal peptide synthetase (NRPS). Ribosomally Synthesised and Post-translationally Modified Peptides (RiPPs). polyketide synthases (PKS) or hybrids between these groups) or placed in the “Other” category. BGCs that belonged to the same GCF are outlined in green. Six GCFs that were of interest in this study were numbered in the figure. The colour of the oval indicates whether the BGCs that were part of the GCF were significantly more present in the black soldier fly metagenome of larvae reared on chicken feed- (CF-LM. blue) or supermarket food waste- (SFW-LM) diet (red)"
New publication: Metagenome-based identification of functional traits of the black soldier fly gut microbiome associated with larval performance, by @raaijmakersjm.bsky.social and others. #biodiversity #foodwaste #insectgut
doi.org/10.1186/s128...
07.10.2025 10:41 — 👍 2 🔁 1 💬 1 📌 0
ME/NIOO-KNAW
https://nioo.knaw.nl/en/employees/muhammad-syamsu-rizaludin
Award-winning science communicator, bestselling author, TV personality & co-founder of Scientists for XR - making STEM fun, fighting misinformation & advocating for diversity.
AuDHD, she/her
2x TEDx speaker, 4x cat lover
www.emilygrossman.co.uk
PhD candidate at Microbial Evolution/Ettema lab @ the Laboratory of Microbiology - Wageningen University and Research.
Enthusiastic about Evolution, Microbiology, Microscopy. He/Him.
Accelerating climate science into policy across Europe to urgently & effectively address climate change. Organisers of Equinox, Climate Neutrality Forum & ECCA 2025, 2023 & 2021
ecology, open science, meta-science, evidence synthesis, birds, piano
The Faculty of Geosciences has the ambition to be a global trailblazer in education and research with regard to our Earth system and sustainability, from the local to the global scale. https://www.uu.nl/geo
Posts in Dutch and English
Het Deltaplan Biodiversiteitsherstel is een gezamenlijke beweging waarin natuurorganisaties, boeren, burgers, kennisinstellingen, overheden en bedrijven intensief samenwerken om biodiversiteitsverlies in Nederland in 2030 om te buigen naar herstel.
MBE publishes fresh insights into the patterns and processes that impact the evolution of life at molecular levels.
🔗 academic.oup.com/mbe
🏠 @official-smbe.bsky.social
🤝 @genomebiolevol.bsky.social
#evobio #molbio #science #biology #societyjournal
SMBE fosters communication among molecular evolutionists and advances the field.
🔗 smbe.org
💬 smbe2026.org • biosig.lab.uq.edu.au/strphy26
👥 @smbe-idea.bsky.social
📙 @molbioevol.bsky.social • @genomebiolevol.bsky.social
Researcher @SLU, interest in #wildlife #ecology #conservation #computervision #ornithology, PhD done
@niooknaw @AnimalEcol_NIOO @Radboud_Uni @Sovon
https://www.researchgate.net/profile/Magali-Frauendorf-2
https://scholar.google.com/citations?user
PhD candidate at UvA-IBED and NIOO tracking Bewick's swan migration
Natuurliefhebber, ecoloog, botanie, Statenlid Overijssel, GroenLinks, energietransitie, klimaat, ruimtelijke ordening, verkeer, natuurvriendelijke landbouw, waterbeheer en nog veel meer
Aanjagers van wildere natuur sinds 1989
Meer op www.ark.eu
Natuurdingen (ver)teller | vogels | nachtvlinders | Sovon (A)DC / RvT | NESTKAST | Vogelwacht Uden | Poezie | Мастер и Маргарита | Prakezerende chaostheoreticus | petatzegger | venomous poison toxicologist
The first global, women-led campaign for climate justice.
https://linkpages.pro/projdandelion
The International Society of Limnology promotes and communicates new and emerging knowledge among limnologists to advance the understanding of inland waters💧🌊
🇪🇺 network monitoring distribution, abundance & health of #wildlife towards integrated #WildlifeManagement. #OneHealth.
Supported by EFSA. Views are our own.
https://enetwild.com/