Webcam image from downtown Utqiaġvik at 1130am AKST Sunday November 9, 2025 looking north to the Chukchi Sea with leaden gray clouds in the sky above.
In case you're wondering, it's November 9 and there's no sea ice to be seen from Utqiaġvik, northernmost community in Alaska. Sunday at 1125am AKST, 18F (-7.8C) with northeast winds 18kt (21mph). Webcam image courtesy UAF and NSRC. #akwx #Arctic #SeaIce
09.11.2025 20:44 — 👍 42 🔁 18 💬 2 📌 0

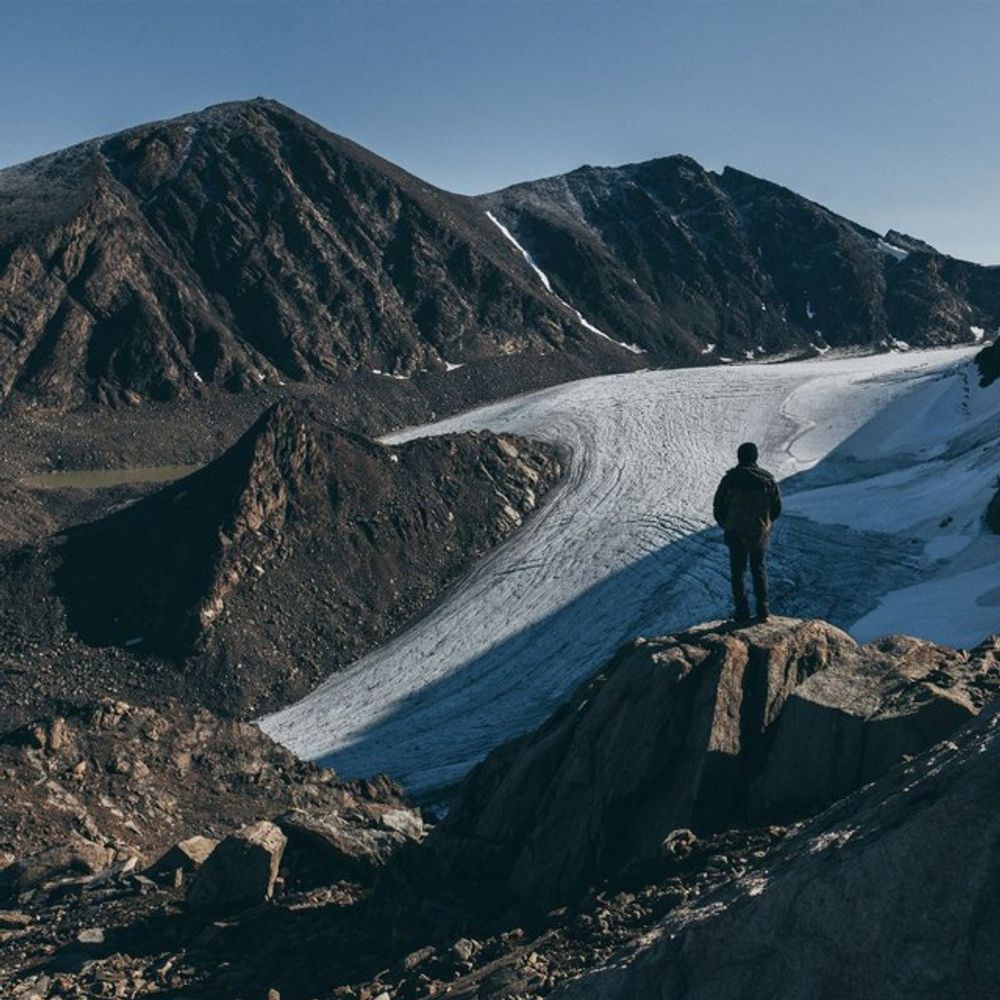
On 7th Nov., the new hazard map for #Blatten has been presented 👇
Red zones have been extended. However, 4 locations have been identified where re-building could be possible from a natural hazards perspective! ⛰️🌊
But, who would want to relocate where? 🤔
Via C. Huggel
www.srf.ch/news/gefahre...
09.11.2025 20:17 — 👍 11 🔁 2 💬 0 📌 0

Left: Chukchi Sea daily sea ice extent 1979-2025 with the past two years and the 1991-2020 smoothed median highlighted. Right: NWS Alaska Region sea ice concentration analysis to November 8, 2025.
The Beaufort Sea, north of Alaska and northwest of Canada, has been slow to freeze over this autumn, with the rate of increase of sea ice extent way below normal since early October. Sea ice is slowly growing and expanding in the Chukchi and Bering Seas. #akwx #Arctic #SeaIce
09.11.2025 18:16 — 👍 23 🔁 8 💬 1 📌 0

RECORD HEAT IN MEXICO
Fierce heat on Friday near US Border in the Northern States of Nuevo Leon and Coahuila:
38.7C Monclova Hottest November day in history
38.9C Monterrey just 0.1C from the record
Next days extreme heat in Sonora and Sinaloa up to 42C !
09.11.2025 18:26 — 👍 42 🔁 18 💬 1 📌 1
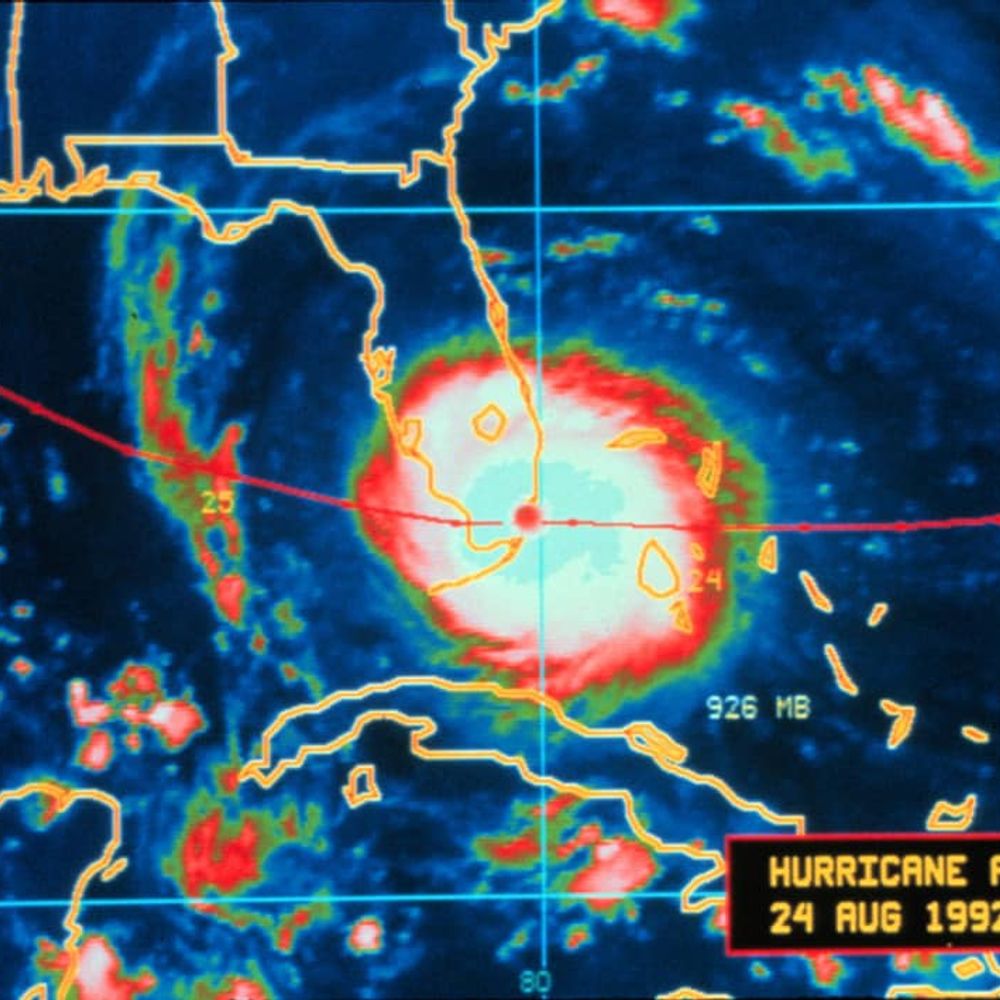
Typhoon Uwan / Fung-wong from development to landfall near Dinalungan in Luzon, Philippines 🇵🇭🌀
09.11.2025 16:35 — 👍 30 🔁 12 💬 2 📌 2
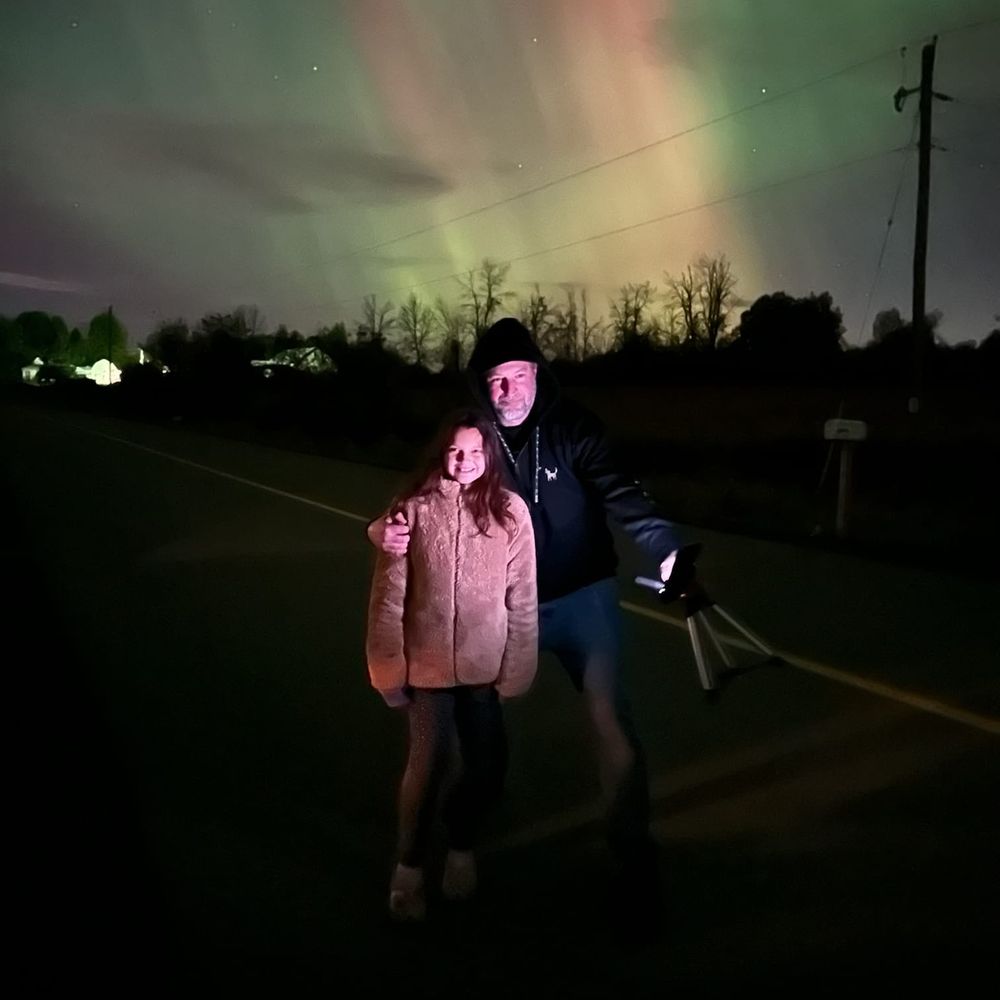
A #solarstorm with an initial speed of ~730 km/s is on its way toward Earth! It’s associated with an X1.7-class flare that peaked today around 07:35 UTC.
The CME is expected to arrive Tuesday, 11 November, around 20:00 UTC (21:00 CET).
Let’s hope for a better aurora show than on Friday🤞🌌
09.11.2025 17:12 — 👍 24 🔁 9 💬 0 📌 2

Mit heute ist der Winter da, im Santa Claus Village in Rovaniemi 🇫🇮, direkt am Polarkreis. In den nächsten Tagen fallen nochmal 10-20 cm Neuschnee.
Immer einen Besuch wert ist die Live-Cam im Weihnachtsmanndorf: m.youtube.com/watch?v=Cp4R...
09.11.2025 17:27 — 👍 36 🔁 8 💬 1 📌 1

Green line graph time series of average sea surface temperature anomalies for each October from 1850 through 2025 for only the midlatitude region of the North Pacific Ocean. There is large interannual variability, but an overall long-term increasing trend. Anomalies are computed relative to a 1981-2010 baseline. 2025 is a record high.
Record high ocean temperatures continued across the North Pacific in October 2025, with recent warming really amplifying since the early 2000s.
This graph shows the average for a band across the midlatitudes for every October from 1854-2025 using
NOAA ERSSTv5 data (psl.noaa.gov/data/gridded...).
09.11.2025 17:43 — 👍 90 🔁 47 💬 3 📌 5

Senegalese coast and Cape Verde are immersed in a bubble of marine heat wave and are with constant record heat.
This month the capital of the tiny archipelago Praia
(beach in Portuguese) broke both the November records of High Max and High Min:
+35.2 +26.2
09.11.2025 15:18 — 👍 25 🔁 6 💬 0 📌 1

EAST ASIA EXCEPTIONAL HEAT
Record heat continue allover the area:
34.2 in Taiwan,33.1 in China,30.2 in Japan.
Earlier this month incredible November record hot night:
Minimum 27.9 Minamitorishima JAPAN !
Record (again) in INDONESIA:
35.7 Manokwari ALL TIME RECORD for any month
09.11.2025 16:10 — 👍 29 🔁 17 💬 0 📌 0

Polar stereographic map showing 2-m air temperature anomalies in October 2025 for the Arctic Circle with red shading for warmer anomalies and blue shading for colder anomalies. Most areas are warmer than average. The baseline is a 1981-2010 reference period using ERA5 data.
Here's a look at the extent of the "warmth" across the #Arctic in October. This map uses my normal anomaly scaling for each month, but it clearly doesn't work for something this extreme.
Data from doi.org/10.24381/cds...
09.11.2025 14:03 — 👍 178 🔁 89 💬 7 📌 4

Exceptional blocking with warm record in GREENLAND
Min 5.5 Nuuk, 5.0 Maniitsoq .
NOVEMBER HOTTEST NIGHT ON RECORD
A powerful arctic blast will send freezing temperatures till Northern Florida, BUT that's BY NO MEANS a record cold event:
Early November 1976 was far worse with 21F and 6 freezing days
09.11.2025 12:16 — 👍 43 🔁 13 💬 1 📌 5
Typhoon #UwanPH / Fung-wong is very close to making landfall over Luzon in the Philippines. Latest satellite view:
09.11.2025 11:38 — 👍 36 🔁 17 💬 0 📌 3


der November in Wien bisher sehr speziell: ganz ohne Nebel, und sehr warm, fast 2 Grad wärmer als in den letzten Jahren üblich. dazu gab es fast doppelt so viel Sonnenschein wie sonst üblich:
09.11.2025 09:50 — 👍 61 🔁 7 💬 3 📌 0

Der Klimawandel ist real, die globale Erwärmung zeigt sich sehr deutlich. 2025 wird eines der 3 wärmsten Jahre seit Messbeginn gewesen sein - ob es an 2. oder 3. Stelle landet entscheiden die letzten 2 Monate:
09.11.2025 09:55 — 👍 127 🔁 27 💬 5 📌 1

More record heat in SOUTH AFRICA
November Highest Minimum in history in Western Cape:
22.1 Paarl
19.1 Tygerhoek
18.7 Stilbaai
09.11.2025 10:23 — 👍 51 🔁 18 💬 3 📌 2

AR 4274 just produced an X1.7 solar flare peaking at 07:35 UTC (Nov 9). An Earth directed CME will be likely. More to follow. SolarHam.com
09.11.2025 07:58 — 👍 26 🔁 2 💬 1 📌 3

Orthographic map showing 2-m air temperature anomalies in October 2025 relative to a 1981-2010 baseline. This visualization shows North and South America. Most areas are warmer than average.
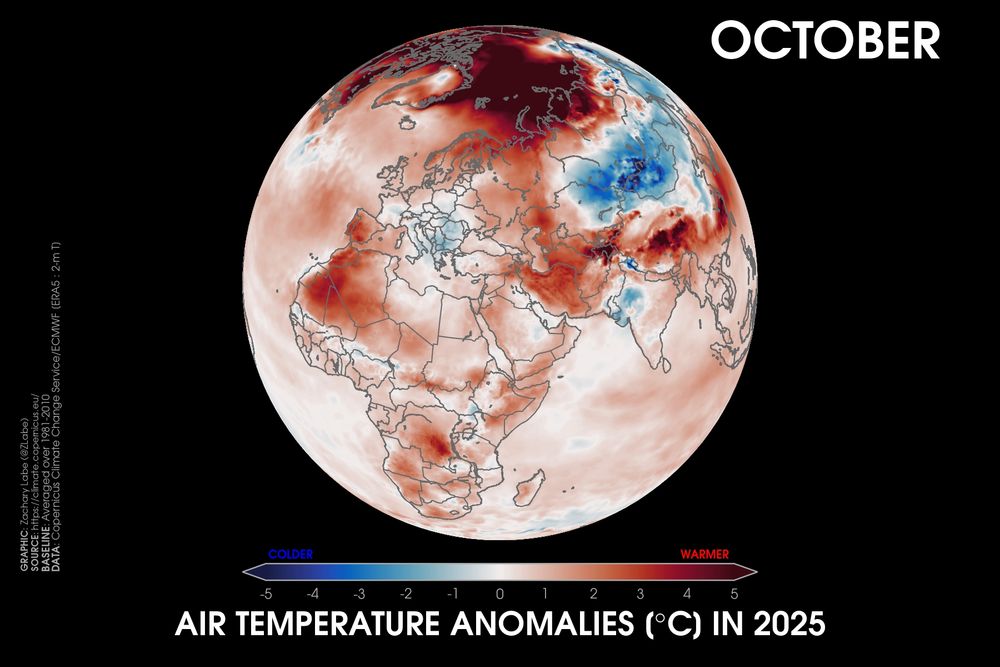
Orthographic map showing 2-m air temperature anomalies in October 2025 relative to a 1981-2010 baseline using ERA5 data. This visualization shows Africa, Europe, and western Asia. Most areas are warmer than average.

Orthographic map showing 2-m air temperature anomalies in October 2025 relative to a 1981-2010 baseline using ERA5 data. This visualization shows Australia, Antarctica, and Asia. Most areas are warmer than average, except for small parts of Australia and Antarctica.
October 2025 was the 3rd warmest October on record for our planet, following 2023 (1st place) and 2024 (2nd place). This month was about 1.55°C above the 1850-1900 pre-industrial average. The last 12-months have been about 1.50°C above it.
Summary of month: climate.copernicus.eu/surface-air-... 🛠️🧪🌊
08.11.2025 22:31 — 👍 141 🔁 61 💬 3 📌 4

EXTRAORDINARY HEAT IN INDONESIA
Records smashed in pieces every single day with margins never seen before.
Insane MINIMUM temperatures today:
28.3 Biak
27.7 Bau Bau
26.0 Tanjngpinang
Indonesia has been breaking heat records every single day since early 2023.
09.11.2025 02:29 — 👍 23 🔁 9 💬 1 📌 0

Out the the far western Aleutian Islands, the wind keeps blowing. The average observation for the last 40 hours at Shemya (PASY) is a sustained wind of 45 mph with gust to 57 mph. www.weather.gov/wrh/timeseri... @alaskawx.bsky.social
09.11.2025 05:10 — 👍 35 🔁 4 💬 3 📌 0

VIRGIN ISLANDS AGAIN
91F/32.8C at Charlotte Amalie Int. AP in St. Thomas breaks again its November record of highest temperature.
Caribbean has been with continous and relentless record heat for 3 years and there is no sign it will end in any foreseeable future.
08.11.2025 18:35 — 👍 26 🔁 12 💬 1 📌 0

Map centered on Alaska showing the percent change in average November snowfall over land areas between 1975 and 2024.
November snowfall trend past 50 years in and around Alaska. Big increases North Slope due to loss of sea ice/more open water in adjacent seas. Less snow on and near Bering Sea & Gulf of Alaska coasts reflect warming oceans. Data from ERA5 courtesy of @copernicusecmwf.bsky.social #akwx #Climate #Snow
08.11.2025 19:00 — 👍 24 🔁 10 💬 0 📌 0

Average temperature in Helsinki Kaisaniemi for the period 1-7 Nov and for the years 1882-2025.
The first week of November (1.-7.11.) was record-warm in Helsinki, Finland. The average temperature was 9.3 °C.
Records have been kept since 1882.
08.11.2025 15:26 — 👍 61 🔁 13 💬 1 📌 1
Grundlagen und Fakten zum Klimawandel:
• Der Klimawandel ist real
• Die Ursache der aktuellen globalen Erwärmung sind wir Menschen
• Die Entwicklung ist gefährlich
• ExpertInnen weltweit sind sich einig
• Wir können etwas dagegen tun
• Die meisten Menschen wollen mehr Klimaschutz
08.11.2025 16:54 — 👍 317 🔁 84 💬 18 📌 0

BLACK SEA NOVEMBER SUMMER DAY
Exceptional warmth started with MINIMUMS >22C on the Turkish Black Sea coast (typical of summer) followed with a warm afternoon in Georgia and Russia up to 28.0C at Zugdidi
Weather will remain very mild for most of November in the area:
Beachtime!
08.11.2025 17:02 — 👍 59 🔁 25 💬 1 📌 1
EXCEPTIONAL HEAT IN SE ASIA
Records pulverized every day in every country over and over again
Most extreme event ever in SINGAPORE
35.4 Changi AP Monthly record again!
THAILAND
35.7 Sawi
INDONESIA
35.5 Timika
>900 consecutive days breaking records in Thailand & Indonesia!
08.11.2025 12:38 — 👍 47 🔁 17 💬 1 📌 2

Line graph time series of 2-m air temperature anomalies for the Arctic in every October from 1979 to 2025. There is a long-term warming trend, and 2025 is the warmest on record in this time series. Data is from ERA5 with a 1981-2010 climate baseline used for calculating the anomalies.
It's not every day that both poles set new monthly temperature records (see my earlier post). Last month also observed the warmest October on record for the #Arctic Circle. Not great!!
Data provided by doi.org/10.24381/cds....
08.11.2025 14:07 — 👍 133 🔁 74 💬 3 📌 0
SOUTH AFRICA RECORD HEAT
Overheated berg winds on the coast of Western Cape with temperatures up to 42C and records of hot nights as well:
NOVEMBER RECORDS
Molteno min 22.5 max 36.3
Min 20.6 Langebaanweg -First tropical night in spring
Min 19.2 Lamberts Bay
More heat coming
08.11.2025 10:29 — 👍 33 🔁 15 💬 2 📌 2
YouTube video by ecoforst
T-WINCH 10.3 & CAT Dozer │ Landslide
youtu.be/ghmgVvRKGWg?si=Wfi4eQhlvpBloKjH via
@YouTube
08.11.2025 10:56 — 👍 0 🔁 1 💬 0 📌 0
Nicht kommerzielle Wetterstation in Prägraten am Großvenediger. Geduld ist die Kunst, nur langsam wütend zu werden. Betrifft sowohl Wetter als auch Politik.
Hier posten Meteorologen und Meteorologinnen von MeteoSchweiz - dem Bundesamt für Meteorologie und Klimatologie.
Sozialdemokratische Partei Österreich
Hier sollte eine Biographie stehen.
#WienFakt - Das Original. Täglich. Seit 23.10.2014.
Signal is an end-to-end encrypted messaging app. Privacy isn’t an optional mode, it’s just the way that Signal works. Every message, every call, every time.
Interactive weather map and hurricane tracker.
Get our app 👉 https://zoom.earth/app
Your daily dose of historical weather and climate events.
NWS Meteorologist ~ Scott Doering
#weather #history #climate
https://sercc.com/weather-history/
Privat hier und poste manchmal Fotos. Beruflich was mit Marketing. Wien, Österreich.
Mainly focused on covering extreme weather events worldwide. Also interested in climate dynamics, geohazards and satellite remote sensing. Also on X: x.com/wxnb_
RMetS Chartered Meteorologist, photographer, occasional storm chaser.
Interested in severe weather, natural hazards and risk communication.
Opinions are my own.
My photography: larslowinski.com
www.unwetterportal.com
Egal mit welcher Naturgefahr zu rechnen ist!
Analysen und Kartierungen zu Tornadofällen in Deutschland: TorKUD.de 🌪️
Observatoire français des tornades et orages violents | Tornado storm french laboratory | météo, climat, risques | keraunos.org
The Alaska Ocean Observing System (AOOS) provides coastal and ocean information to the public.
glaciologist @ethzurich and @wslresearch.bsky.social, head of GLAMOS, passionate about mountains
Nachrichten aus der Wissenschaftssparte von ORF.at
Weitere #ORF-Nachrichten bei #Mastodon (Übersicht und Erklärung):
https://orfodon.org/about
Inoffizieller […]
[bridged from https://orfodon.org/@ORF_Science on the fediverse by https://fed.brid.gy/ ]
PhD student at Ca' Foscari | Glaciology, Remote Sensing and Geomorphology
SolarHam.com is a space weather website launched in 2006 dedicated to providing the latest information about the Sun, including sunspots, solar flares and coronal mass ejections.
The European Severe Storms Laboratory (ESSL) performs and supports research on severe convective storms, their prediction and their impacts, and provides training courses to researchers and forecasters. Our website: https://essl.org


![science.ORF.at [ORFodon]](https://cdn.bsky.app/img/avatar/plain/did:plc:iqrs6mzgyxlythr72kcop3wy/bafkreibhcgps6hgasj47fa72n2iy6hznobslgjuc3i3pxd6o3zzslklqqq@jpeg)