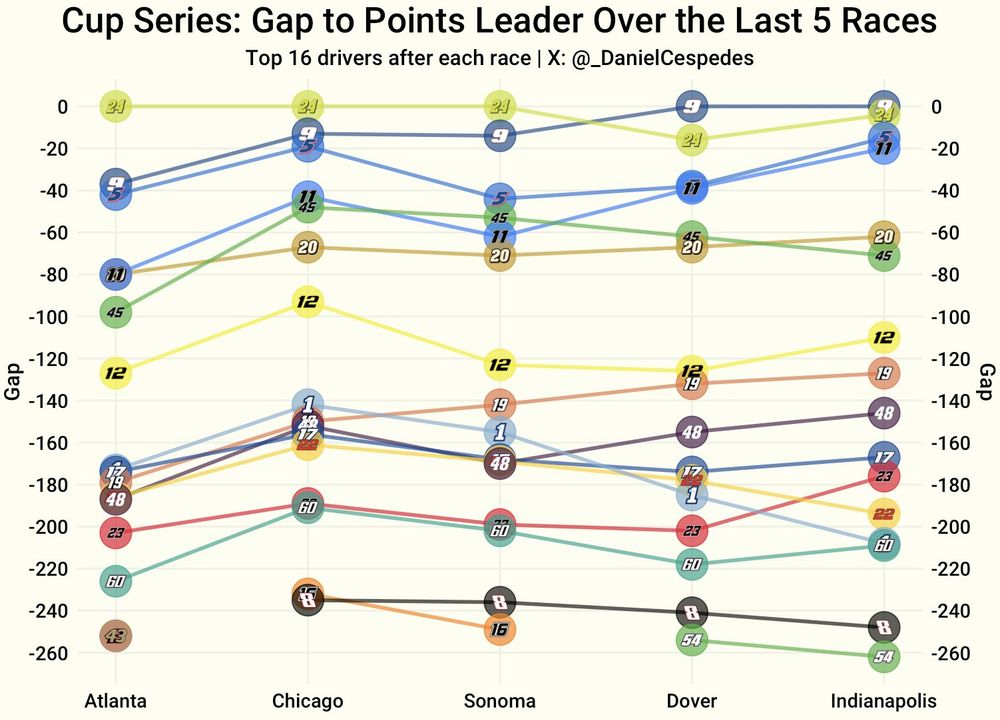
As NASCAR Insights cited, the battle for the Regular Season championship hasn't been so close this late into the season since 2012. However, William Byron led the series with a 37-point cushion coming into July.
Here's how the gap to the leader has evolved over the last 5 races:
28.07.2025 21:06 — 👍 1 🔁 0 💬 0 📌 0
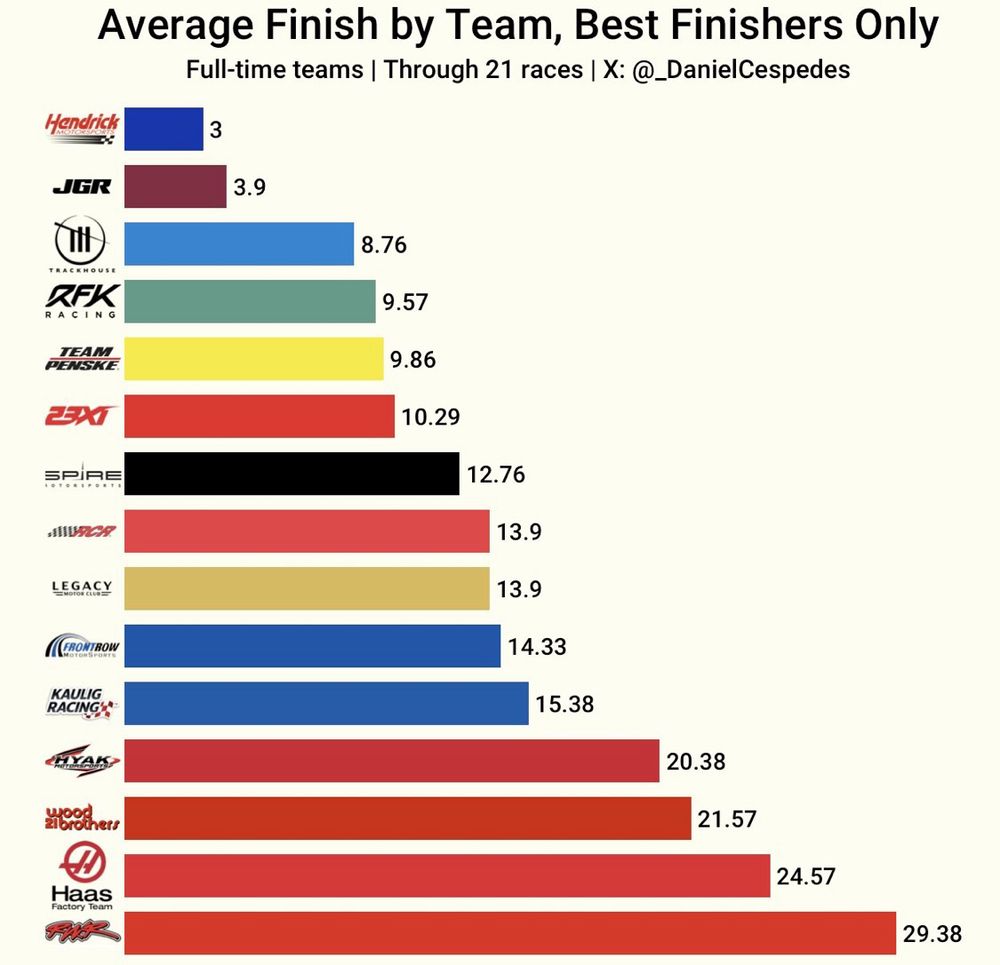
Average Finish of every Cup team's best-finishing driver from each race:
22.07.2025 16:21 — 👍 2 🔁 0 💬 0 📌 0
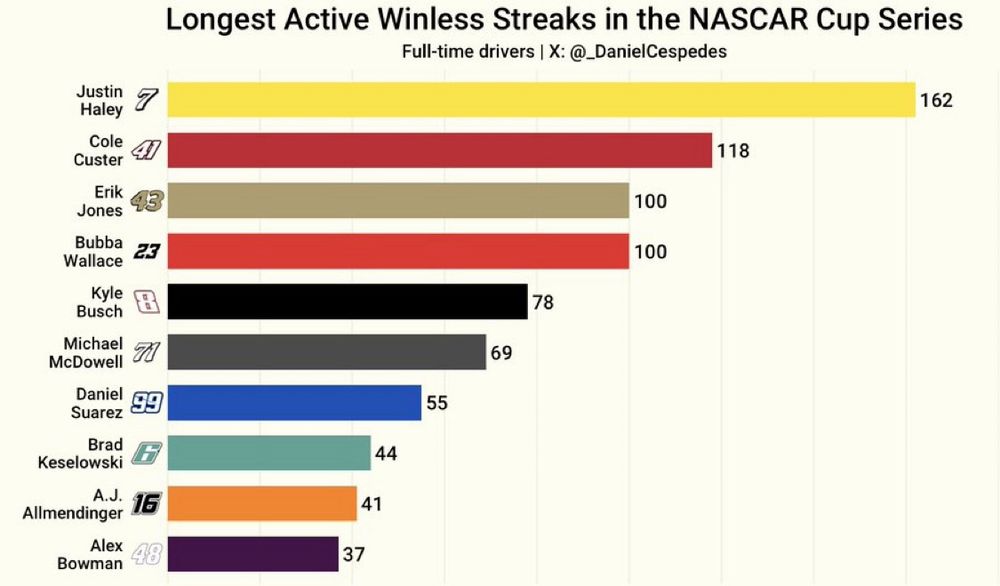
This weekend, Erik Jones and Bubba Wallace each reached 100 races without a win. It's the longest winless streak of Wallace's career, and the second longest of Jones's (109).
The 10 longest active winless streaks in the Cup Series:
22.07.2025 01:58 — 👍 2 🔁 0 💬 0 📌 0
5 for each win, 1 for each stage win. At the end of the regular season drivers are also awarded playoff points for their position in the standings.
16.07.2025 19:21 — 👍 1 🔁 0 💬 0 📌 0
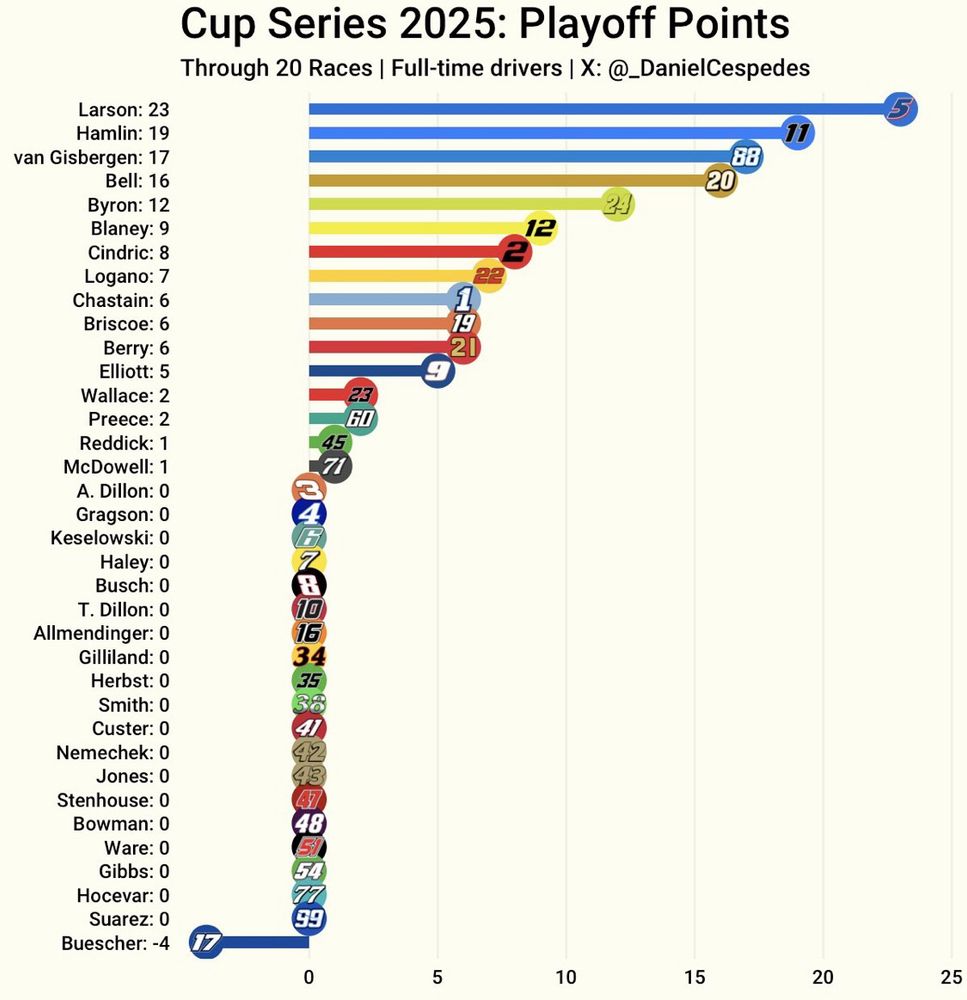
Playoff Points of every Cup driver through 20 races:
16.07.2025 19:16 — 👍 3 🔁 0 💬 0 📌 2
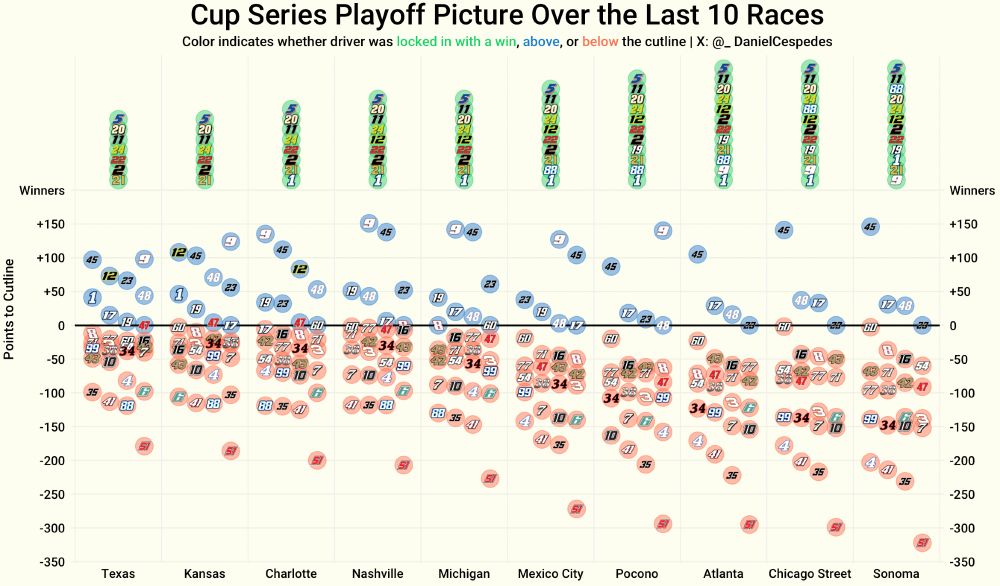
Cup Series Playoff Picture over the last 10 races:
15.07.2025 23:23 — 👍 1 🔁 0 💬 0 📌 0
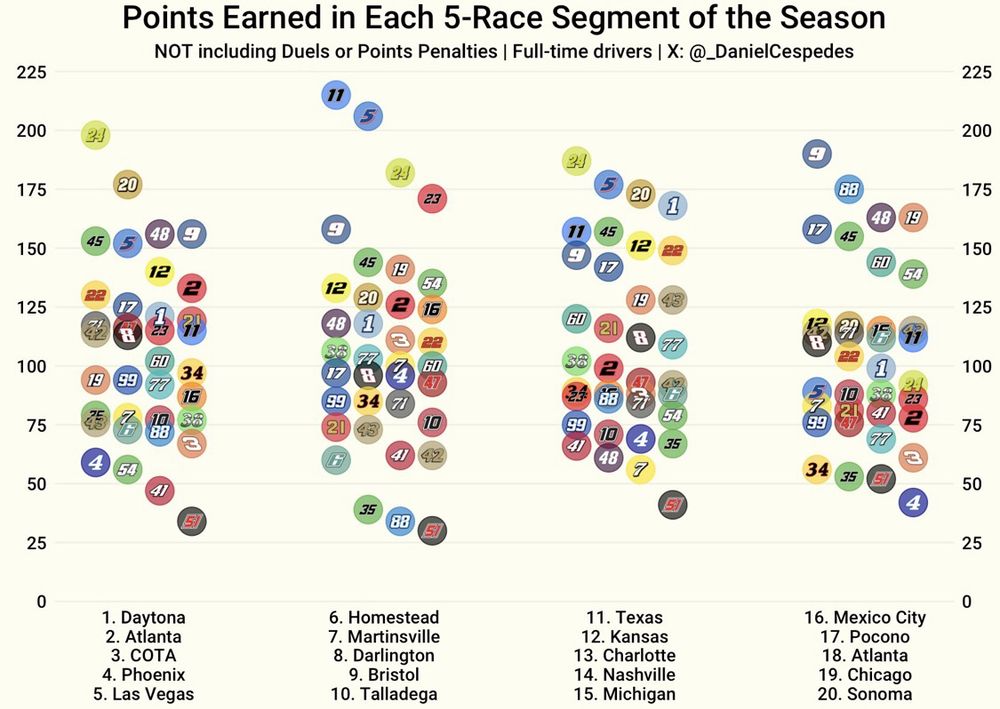
Now that we're 20 races into the Cup season, here's how many points every driver earned in each 5-race segment so far:
14.07.2025 14:49 — 👍 2 🔁 0 💬 0 📌 0
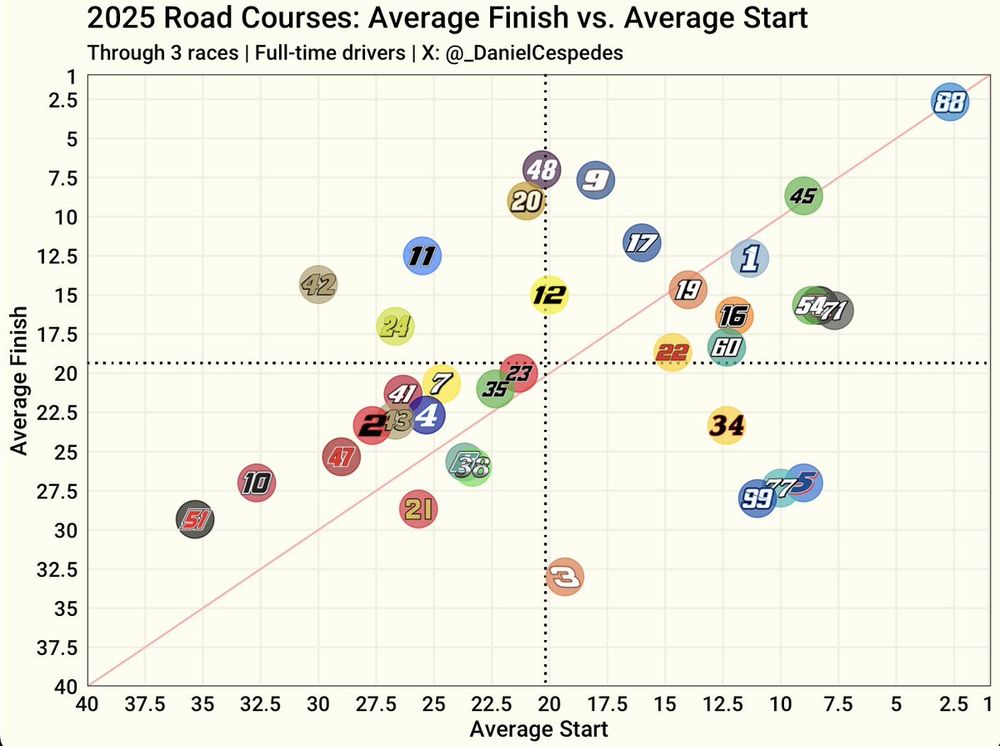
Every driver's Average Finish vs. Average Start on road courses this season (through 3 races):
13.07.2025 17:05 — 👍 2 🔁 0 💬 0 📌 0
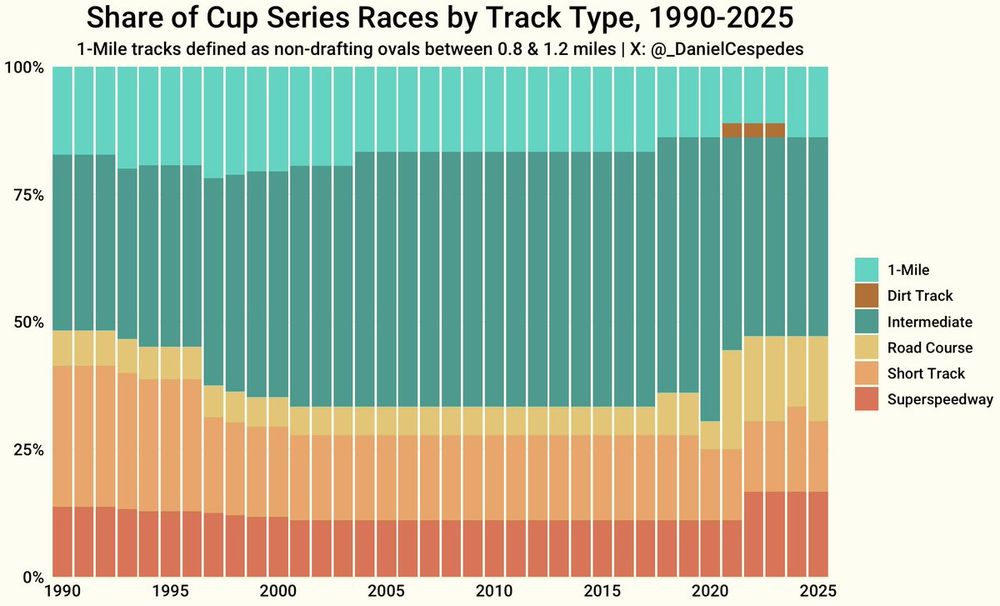
Given the current discussion surrounding how much we should see of certain track types on the Cup schedule, here's the share of Cup races each track type has had every season from 1990 until now.
11.07.2025 01:29 — 👍 3 🔁 0 💬 0 📌 0
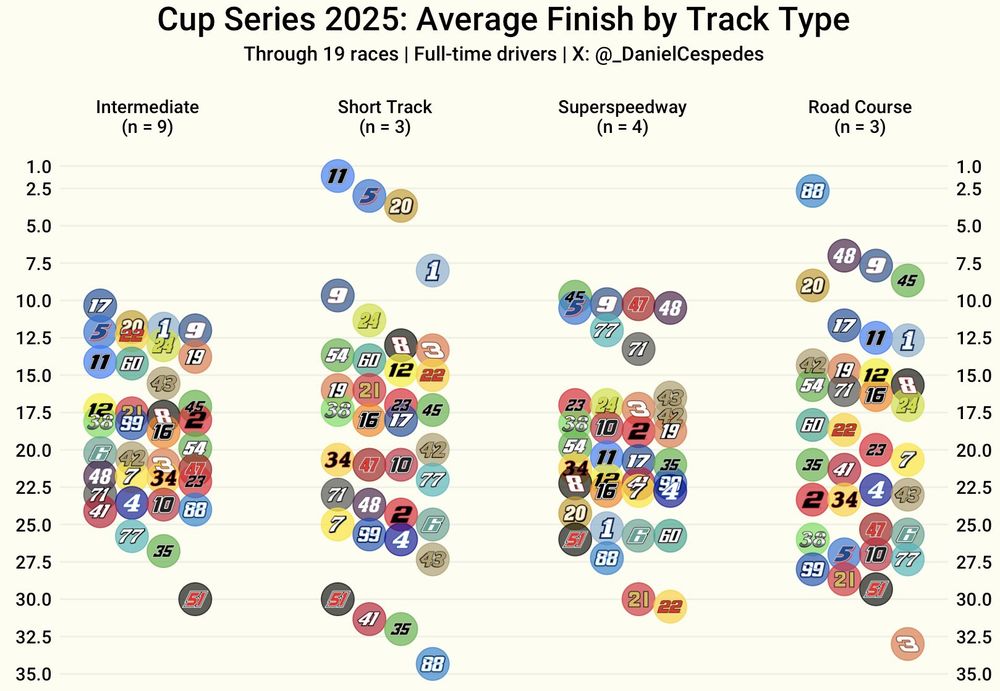
Following Chicago, each track type has now seen 3+ races this season (counting Phoenix as a short track).
Here's every driver's Average Finish by track type so far:
08.07.2025 18:36 — 👍 2 🔁 0 💬 0 📌 0
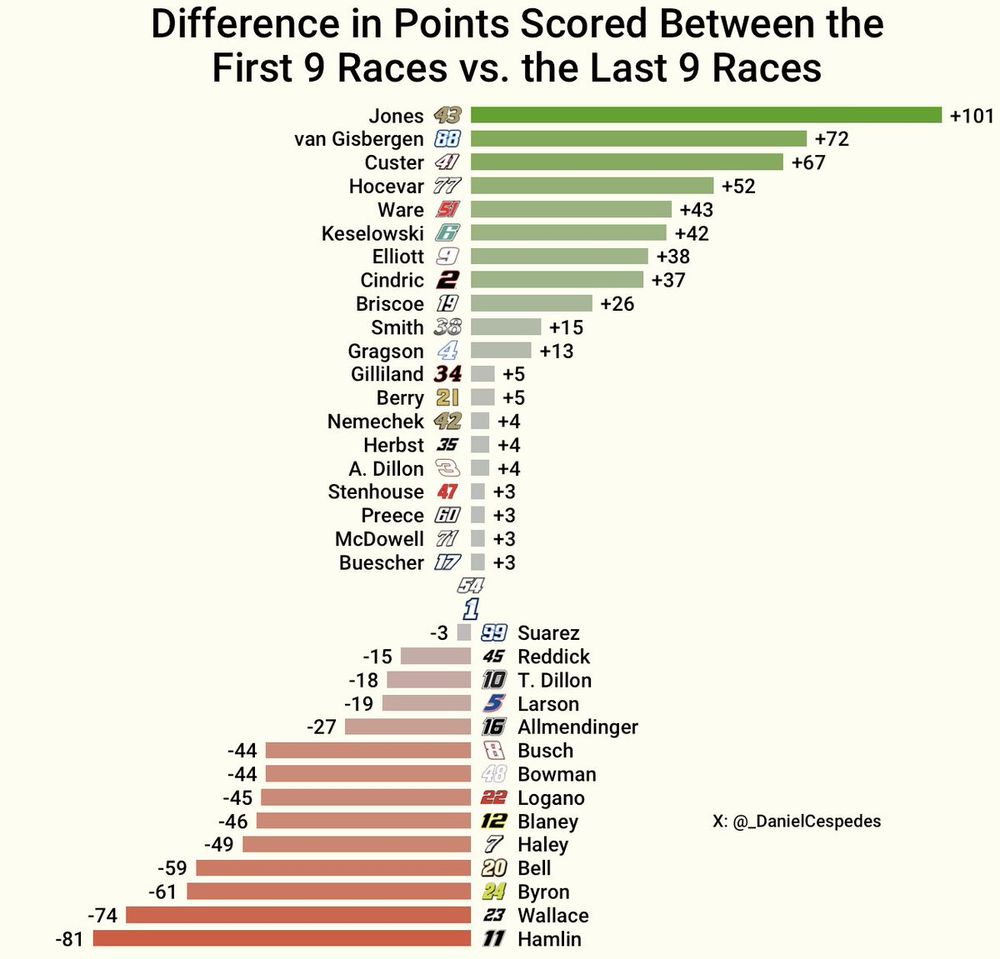
Over the last nine races, Erik Jones has scored 101 𝙢𝙤𝙧𝙚 points than he did during the first nine - by far the biggest improvement of anyone in the Cup Series.
Every driver's point differential between the first and last nine races this season:
04.07.2025 03:36 — 👍 1 🔁 0 💬 0 📌 0
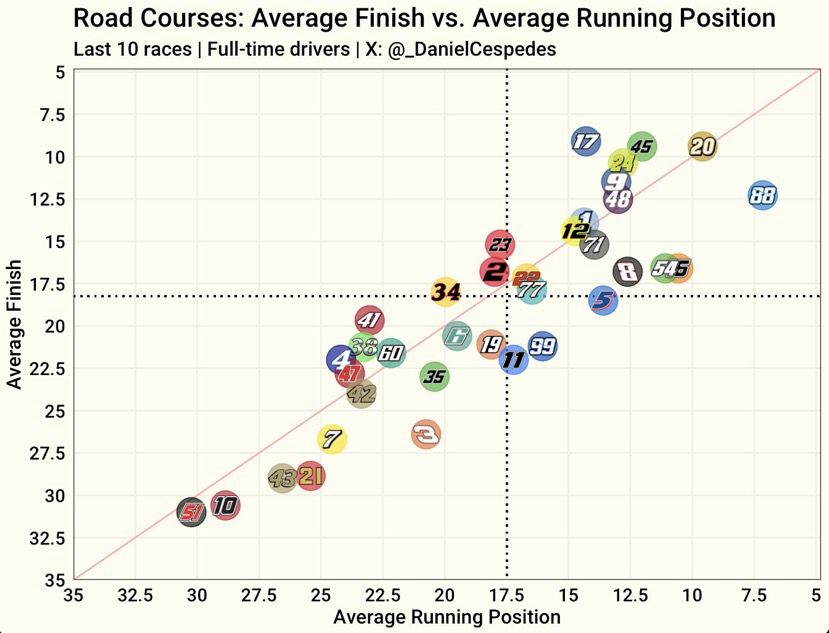
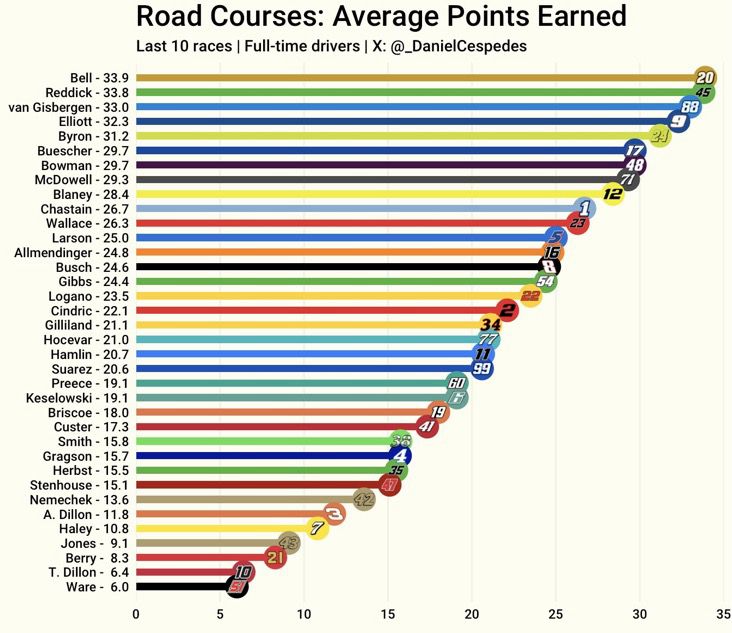
Stats at Road Courses over the last 10 races:
Average Finish vs. Average Running Position / Average points earned
02.07.2025 20:06 — 👍 1 🔁 0 💬 0 📌 0
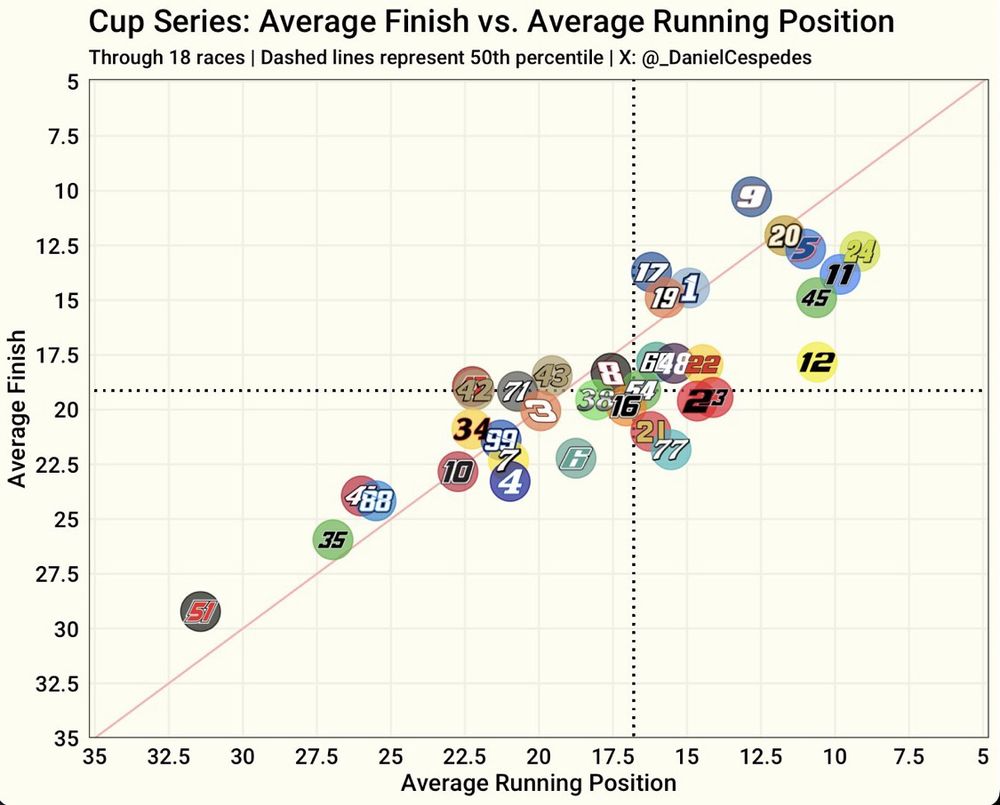
Every Cup driver's Average Finish & Average Running Position halfway through the season.
Kinda wild how tight the field is.
01.07.2025 18:57 — 👍 2 🔁 0 💬 0 📌 0
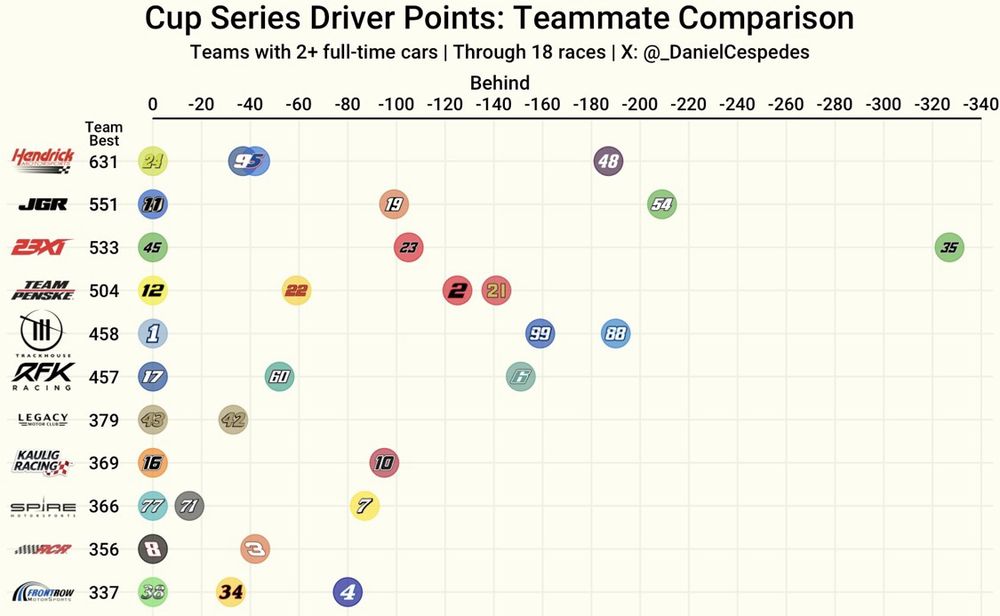
Cup Series Driver Points comparison between teammates (through 18 races):
01.07.2025 02:50 — 👍 1 🔁 0 💬 0 📌 1
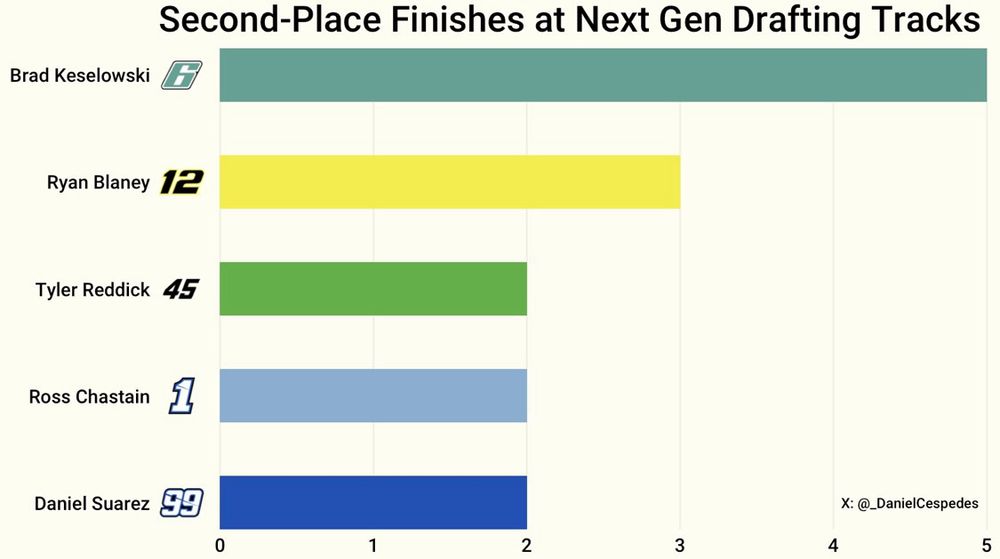
Brad Keselowski's 2nd place finish in Atlanta marked the 5th time in the Next Gen era that he's finish 2nd at a drafting track.
Below are all the drivers multiple 2nd place finishes at Next Gen drafting tracks, and of them, Brad is the only one still without a win.
30.06.2025 19:18 — 👍 3 🔁 0 💬 0 📌 0
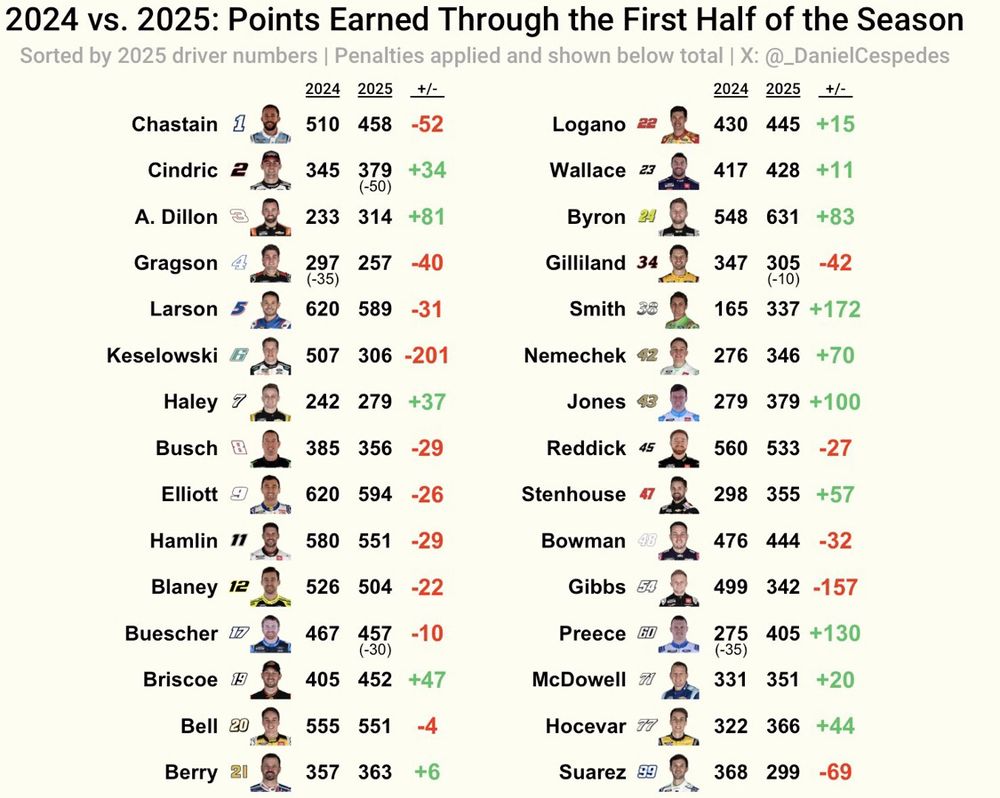
We're officially halfway through the NASCAR Cup Series season.
Here's how many points every driver has this year compared to this time last year
Biggest gains 📈:
Smith: +172
Preece: +130
Jones: +100
Biggest losses 📉:
Keselowski: -201
Gibbs: -157
Suarez: -69
29.06.2025 20:01 — 👍 1 🔁 0 💬 0 📌 0
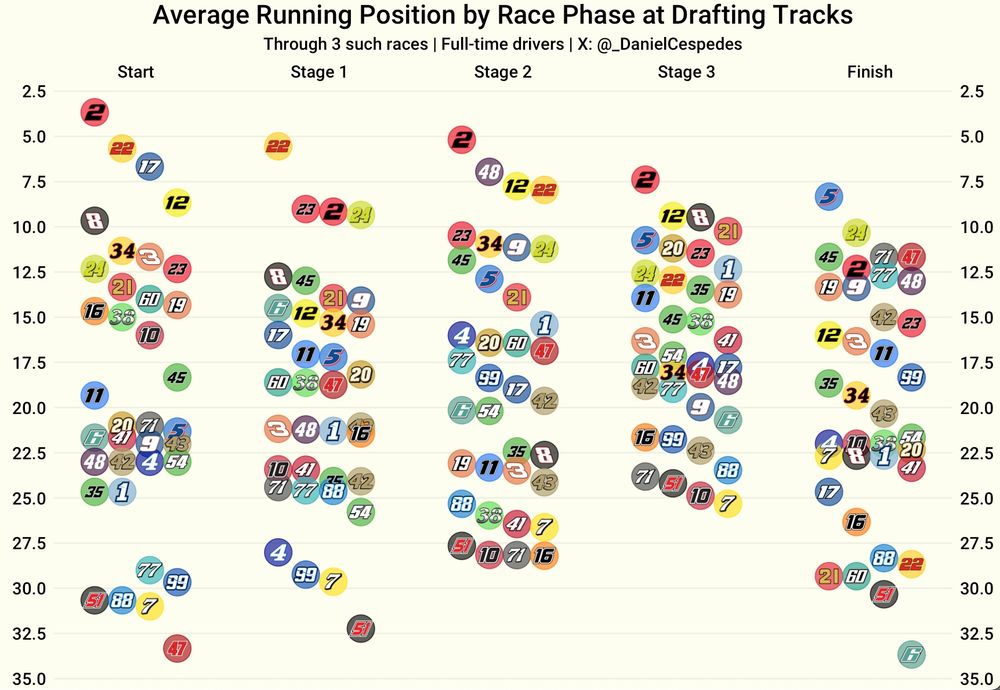
Average Running Position by race phase at drafting tracks this season:
28.06.2025 05:59 — 👍 1 🔁 0 💬 0 📌 0
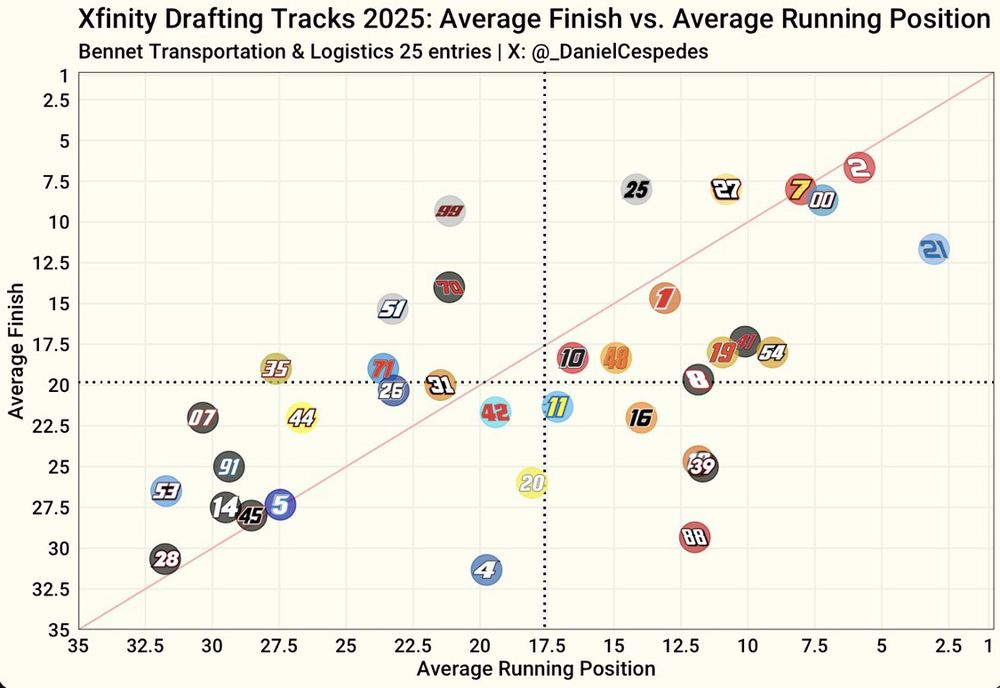
Xfinity Series: Average Finish vs. Average Running Position at the three drafting races this season
27.06.2025 18:51 — 👍 1 🔁 0 💬 0 📌 0
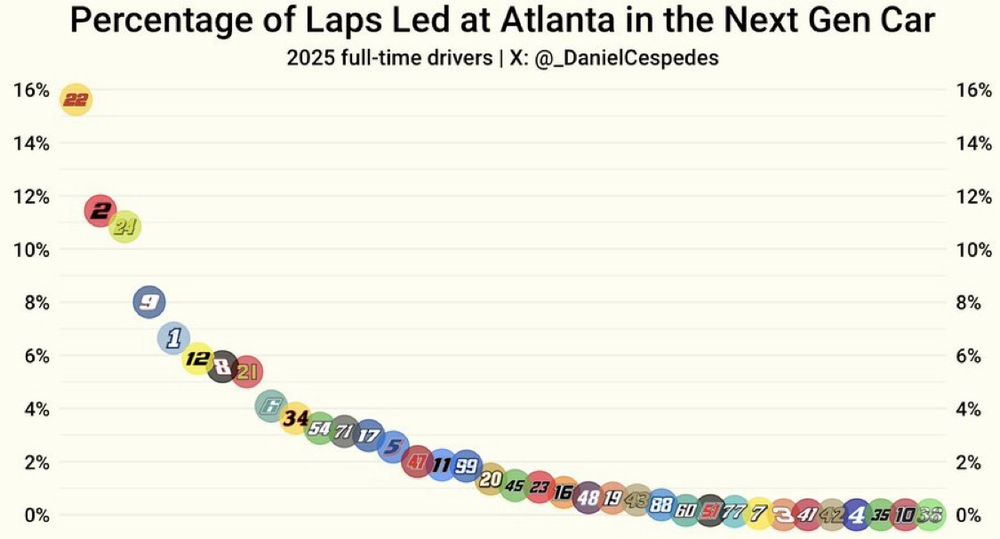
Percentage of laps led by each driver at Atlanta in the Next Gen era:
27.06.2025 17:07 — 👍 1 🔁 0 💬 0 📌 0
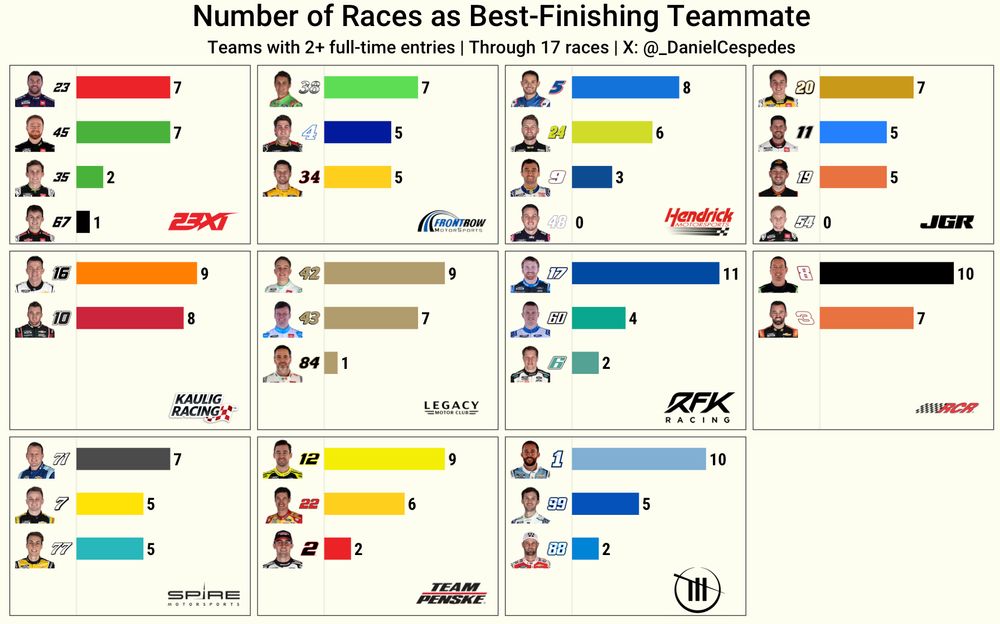
How many times each Cup driver has been the best finisher among their teammates this season:
25.06.2025 16:42 — 👍 3 🔁 0 💬 0 📌 3
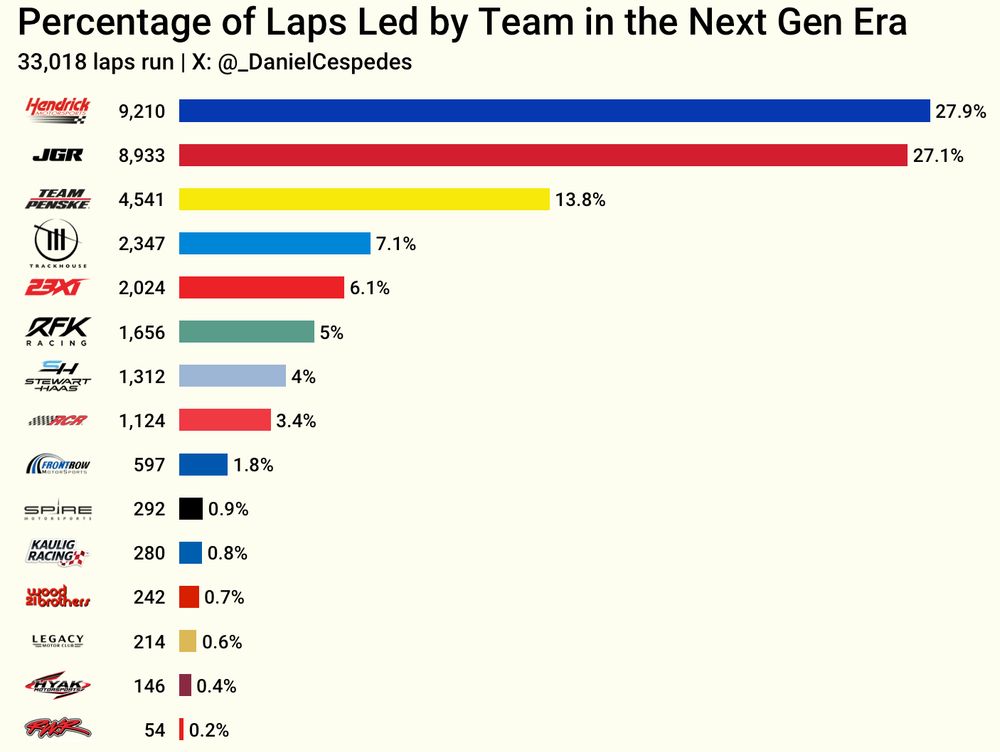
33,018 laps have been run in the Next Gen era.
55% of them have been led by either a Hendrick or a JGR car.
24.06.2025 17:36 — 👍 1 🔁 0 💬 0 📌 0
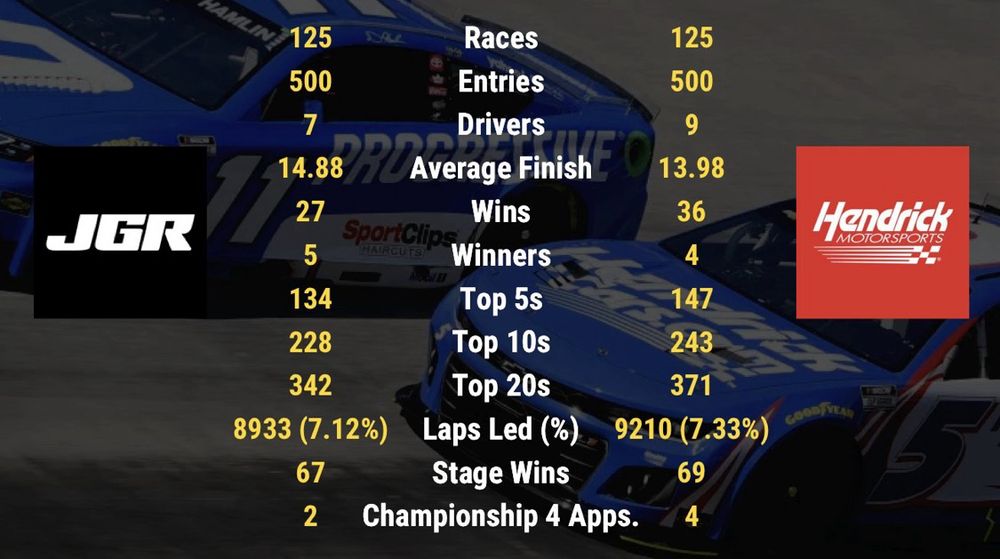
Joe Gibbs Racing and Hendrick Motorsports each reached 500 entries in the Next Gen car yesterday.
A comparison of their Next Gen stats so far:
23.06.2025 17:30 — 👍 3 🔁 0 💬 0 📌 0
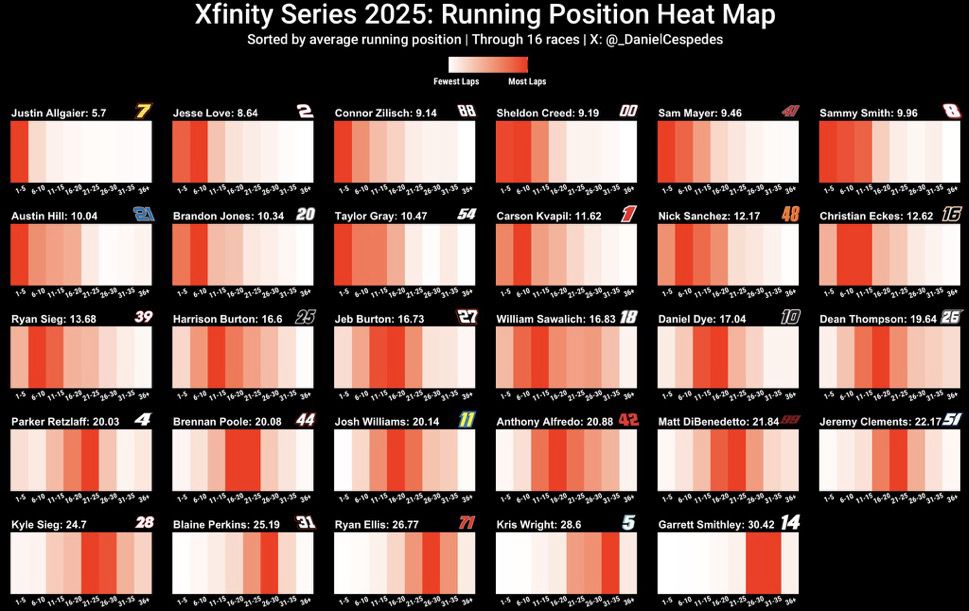
Xfinity Series running position heat map
Bright Red = Where driver has run the most laps
White = Where driver has run the fewest laps
Sorted by average running position
22.06.2025 21:27 — 👍 2 🔁 0 💬 0 📌 0
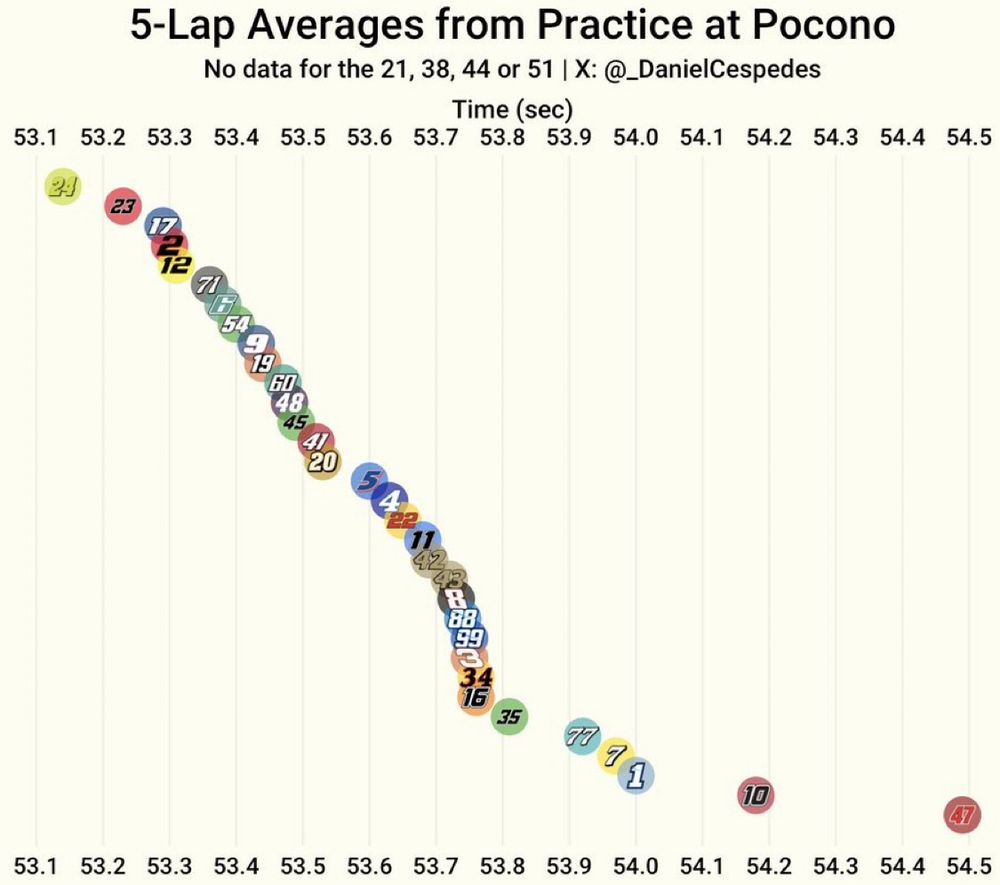
5-lap averages from today's Cup practice at Pocono:
22.06.2025 01:11 — 👍 1 🔁 0 💬 0 📌 0
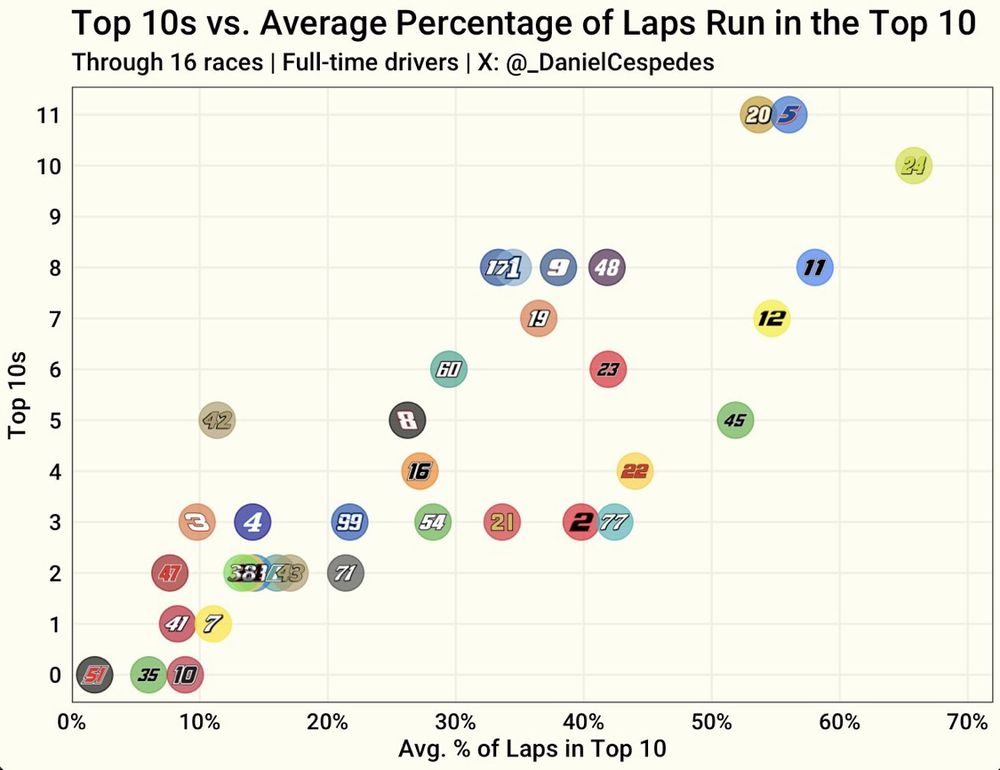
Top 10s vs. Average percentage of laps run in the Top 10 this season:
20.06.2025 16:09 — 👍 1 🔁 0 💬 0 📌 0
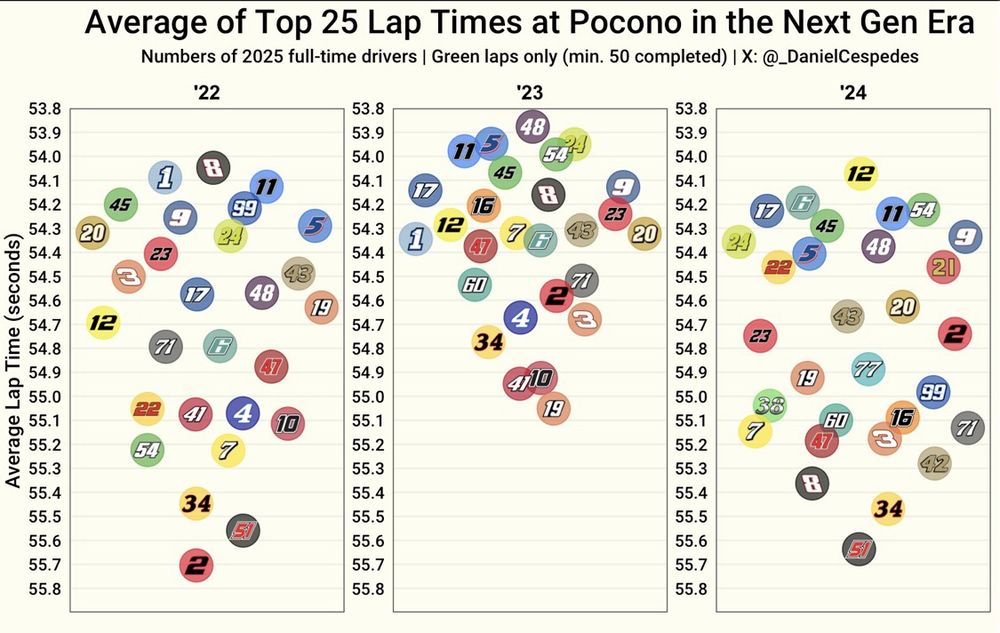
Average of every driver's Top 25 lap times at each Pocono race in the Next Gen era:
20.06.2025 02:30 — 👍 2 🔁 0 💬 0 📌 0
Yup! He’s the next best, but like you said, he starts worse so it makes sense. All three TH cars are actually up there haha
19.06.2025 16:25 — 👍 1 🔁 0 💬 0 📌 0
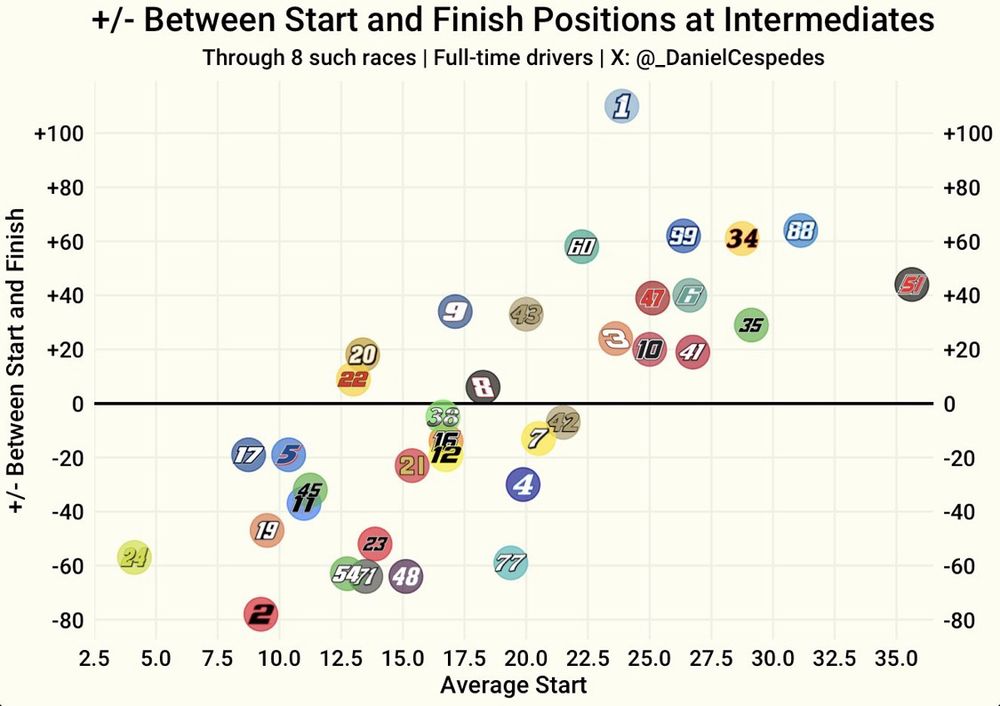
Ross Chastain has finished a total of 110 positions better than his starting positions at Intermediates this season; that's 46 positions better than anyone else in the field.
19.06.2025 16:20 — 👍 3 🔁 0 💬 1 📌 1
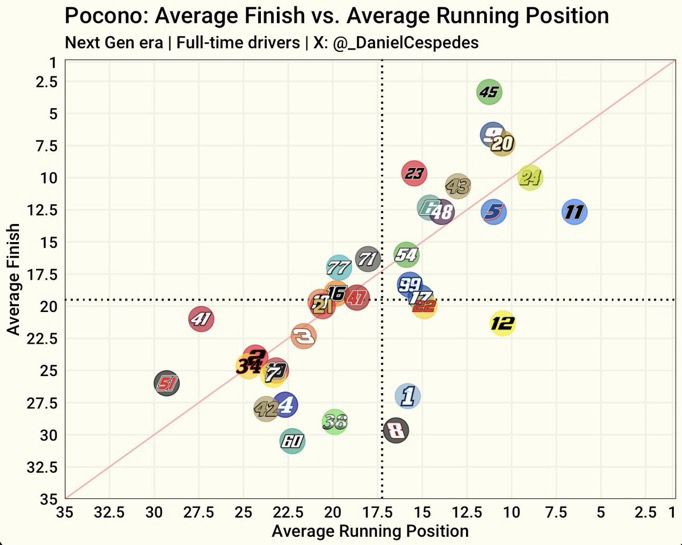
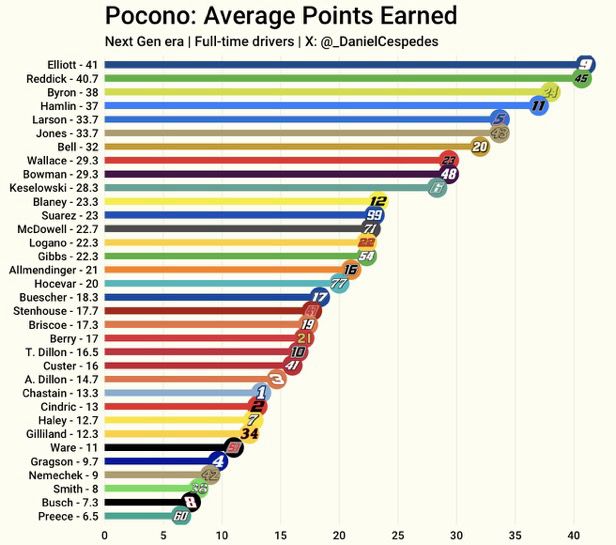
Next Gen stats at Pocono:
Average Finish vs. Average Running Position / Average points earned
18.06.2025 19:35 — 👍 2 🔁 0 💬 0 📌 0
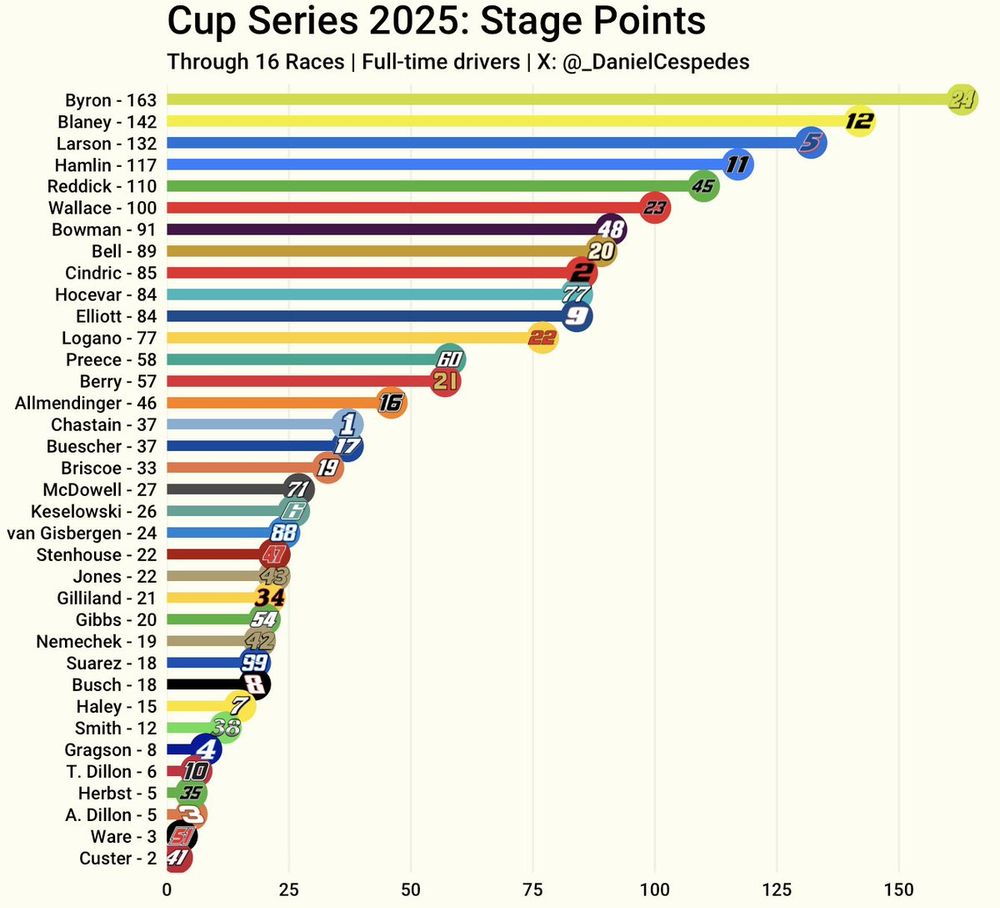
Austin Dillon's 6th place finish in Stage 2 at Mexico City means every full-time driver has now officially scored stage points this season.
Stage points earned by each driver so far:
17.06.2025 17:52 — 👍 2 🔁 0 💬 0 📌 0
Maker of film and tv, enjoyer of LEGO and NASCAR, speaker of useless information. he/him
Statistician | #RStats | Data Viz
🔗 https://andresgonzalezstats.com/
👨💻 GitHub: https://github.com/OKcomputer626
Premier partner of the NASCAR Cup Series & title sponsor of the NASCAR Xfinity Series.
Data Analyst @ Norwich City Football Club
football data science | the profile picture is up to date | "stats don't play football, players play football" ॐ
Motorsports Reporter #NASCAR / A Connecticut Yankee in King Richard's court / Journalist and TV lover / Proud 🍊/ @posregpod alum
NASCAR writer for The Athletic. Co-host of The Teardown podcast.
Sports injury epidemiologist, esp. NFL; long-suffering Dolphins fan, but I repeat myself
In due time. Social Media Director for Frontstretch. Will do no harm, but take no shit. #ODCEFD
Motorsports & speedrunning
🏁30+ year NASCAR fan, Bubba Wallace News & Updates 🏎️ 2️⃣3️⃣ #BlackLivesMatter 🐝💙💛 🏳️🌈 She/her
i race in the nascar xfinity series sometimes, other times i dream about it
President at @KauligRacing | Living everyday like it's the last! | Proud Father!
🏳️🌈 // #Splatoon3 N-ZAP ‘85 2715XP
🏳️🌈 Motorsports Enthusiast, Artist & Podcaster @GayRacingPod.bsky.social || Main: @DreamyZack.bsky.social
Yea
Tire Guy for #39 (28?) NXS
Fan Account | Conta Não-Oficial - Unofficial Account
FC Barcelona BR fan page. updates, news, match commentary and much more here. Not affiliated with the club
MÉS QUE UN CLUB | VISCA BARÇA! 🔵🔴
@FCBFemeni.bsky.social
32. Michigander. Big fan of things that go vroom. He/him