Whoa—my book is up for pre-order!
𝐌𝐨𝐝𝐞𝐥 𝐭𝐨 𝐌𝐞𝐚𝐧𝐢𝐧𝐠: 𝐇𝐨𝐰 𝐭𝐨 𝐈𝐧𝐭𝐞𝐫𝐩𝐫𝐞𝐭 𝐒𝐭𝐚𝐭 & 𝐌𝐋 𝐌𝐨𝐝𝐞𝐥𝐬 𝐢𝐧 #Rstats 𝐚𝐧𝐝 #PyData
The book presents an ultra-simple and powerful workflow to make sense of ± any model you fit
The web version will stay free forever and my proceeds go to charity.
tinyurl.com/4fk56fc8
17.09.2025 19:49 — 👍 278 🔁 84 💬 9 📌 4
You have not seen second generation p-values used anywhere because they were badly reinvented equivalence tests, and people should use equivalence tests instead. See open.lnu.se/index.php/me...
26.09.2025 02:43 — 👍 11 🔁 1 💬 1 📌 0

"New study finds salary benchmarking cuts pay gaps by 25%. Pay dispersion partly arises from firms’ uncertainty about market rates, with key implications for pay transparency policy."
New paper from Perez-Truglia, Li & Cullen
www.restud.com/whats-my-emp...:
#econsky
#REStud
17.09.2025 10:43 — 👍 11 🔁 6 💬 0 📌 0

Posit and AWS have signed a Strategic Collaboration Agreement!
This collaboration helps customers modernize their data infrastructure & accelerate their data science journey on the cloud, making it easier for teams to build and run critical data science outcomes.
Read now posit.co/blog/posit-s...
12.09.2025 17:54 — 👍 14 🔁 4 💬 0 📌 0

ggplot2 4.0.0
A new major version of ggplot2 has been released on CRAN. Find out what is new here.
I am beyond excited to announce that ggplot2 4.0.0 has just landed on CRAN.
It's not every day we have a new major #ggplot2 release but it is a fitting 18 year birthday present for the package.
Get an overview of the release in this blog post and be on the lookout for more in-depth posts #rstats
11.09.2025 11:20 — 👍 850 🔁 282 💬 9 📌 51
OSF
PS there’s a (mildly) updated version available now: osf.io/g4s2a_v2
11.09.2025 06:11 — 👍 13 🔁 1 💬 2 📌 0

Models as Prediction Machines: How to Convert Confusing Coefficients into Clear Quantities
Abstract
Psychological researchers usually make sense of regression models by interpreting coefficient estimates directly. This works well enough for simple linear models, but is more challenging for more complex models with, for example, categorical variables, interactions, non-linearities, and hierarchical structures. Here, we introduce an alternative approach to making sense of statistical models. The central idea is to abstract away from the mechanics of estimation, and to treat models as “counterfactual prediction machines,” which are subsequently queried to estimate quantities and conduct tests that matter substantively. This workflow is model-agnostic; it can be applied in a consistent fashion to draw causal or descriptive inference from a wide range of models. We illustrate how to implement this workflow with the marginaleffects package, which supports over 100 different classes of models in R and Python, and present two worked examples. These examples show how the workflow can be applied across designs (e.g., observational study, randomized experiment) to answer different research questions (e.g., associations, causal effects, effect heterogeneity) while facing various challenges (e.g., controlling for confounders in a flexible manner, modelling ordinal outcomes, and interpreting non-linear models).

Figure illustrating model predictions. On the X-axis the predictor, annual gross income in Euro. On the Y-axis the outcome, predicted life satisfaction. A solid line marks the curve of predictions on which individual data points are marked as model-implied outcomes at incomes of interest. Comparing two such predictions gives us a comparison. We can also fit a tangent to the line of predictions, which illustrates the slope at any given point of the curve.

A figure illustrating various ways to include age as a predictor in a model. On the x-axis age (predictor), on the y-axis the outcome (model-implied importance of friends, including confidence intervals).
Illustrated are
1. age as a categorical predictor, resultings in the predictions bouncing around a lot with wide confidence intervals
2. age as a linear predictor, which forces a straight line through the data points that has a very tight confidence band and
3. age splines, which lies somewhere in between as it smoothly follows the data but has more uncertainty than the straight line.
Ever stared at a table of regression coefficients & wondered what you're doing with your life?
Very excited to share this gentle introduction to another way of making sense of statistical models (w @vincentab.bsky.social)
Preprint: doi.org/10.31234/osf...
Website: j-rohrer.github.io/marginal-psy...
25.08.2025 11:49 — 👍 978 🔁 286 💬 47 📌 20
We can innovate with new setups though instead of having it be academic / rigorous (with heavy caveats for that adjective) vs data bloggers. Having a reproducibility norm would be critical to such a new setup.
21.08.2025 17:59 — 👍 2 🔁 0 💬 0 📌 0
If interested please test the notebooks.
Examples:
Describe
github.com/gabors-data-...
OLS
github.com/gabors-data-...
Random forest, SHAP
github.com/gabors-data-...
Panel FE, FD
github.com/gabors-data-...
15.08.2025 21:26 — 👍 8 🔁 2 💬 0 📌 0
I will insist on maximizing interaction terms on both platforms
14.08.2025 23:23 — 👍 1 🔁 0 💬 0 📌 0
Hey I'm no consultant
14.08.2025 23:21 — 👍 1 🔁 0 💬 1 📌 0
Very pleased to announce our special issue on Gender Norms, edited by @emmatominey.bsky.social and @nikkishure.bsky.social.
onlinelibrary.wiley.com/doi/toc/10.1...
18.06.2025 10:20 — 👍 10 🔁 10 💬 1 📌 3
this was excellent. a highly recommended way to spend 5 hours.
14.06.2025 13:29 — 👍 31 🔁 6 💬 2 📌 0
St Louis and Baltimore show up as the same point because they both went exactly from 74 to 56 in raw counts, which yields the same raw % decline and model predicted underlying % decline.
13.06.2025 01:36 — 👍 0 🔁 0 💬 0 📌 0
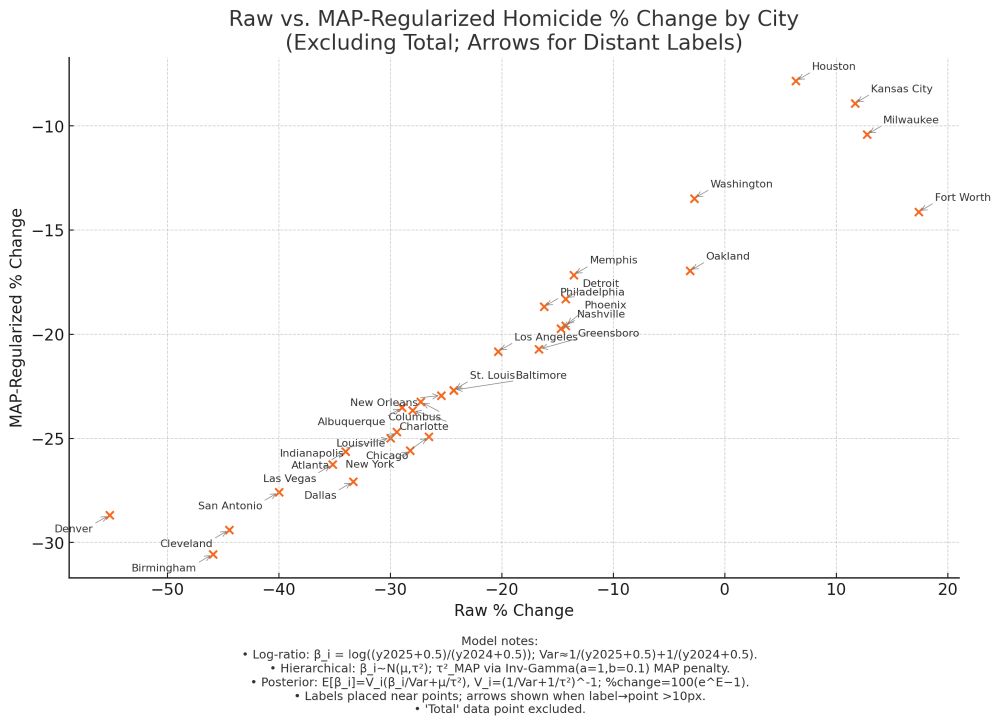
Scatter plot of 31 U.S. cities (excluding “Total”) showing raw vs. Bayesian MAP–regularized percent change in homicides from 2024 to 2025. Raw changes are on the x-axis, regularized changes on the y-axis. Each point is labeled by city, with small arrows connecting any labels placed more than 10 pixels from their marker. A caption below summarizes the log‐ratio transformation, hierarchical Normal(μ,τ²) model with an Inverse‐Gamma penalty on τ², and the posterior‐mean back-transform to percent change.

Screenshot of Jeff Asher’s Substack titled “Murder is down a lot in big cities.” Below the title is a subtitle: “2025 vs 2024 YTD murders in top 30 most murderous cities.” A table lists four columns—City, YTD 2024, YTD 2025, and % Change—and shows, in descending order of decline, that Denver fell from 29 to 13 homicides (–55.2 %), Birmingham from 61 to 33 (–45.9 %), Cleveland 54→30 (–44.4 %), San Antonio 50→30 (–40.0 %), Las Vegas 54→35 (–35.2 %), Atlanta 50→33 (–34.0 %), Dallas 90→60 (–33.3 %), Indianapolis 70→49 (–30.0 %), and so on.
I indulged in a bit of fun doing a first pass of a regularized model for homicide declines with ChatGPT, using @jeffasher.bsky.social's data from jasher.substack.com/p/why-i-thin... to estimate "underlying" rates of homicide decline by city.
13.06.2025 01:33 — 👍 0 🔁 0 💬 1 📌 0
Thoughtfully planning your data collection efforts has a huge return on investment.
As someone who has cleaned data from projects both with and without data management planning, I can safely say it is worth the effort.
40 hours of planning > 80+ hours of cleaning messy data
13.05.2025 20:13 — 👍 16 🔁 2 💬 0 📌 0

A screenshot of a Bayesian statistical model training interface showing NUTS sampler progress. The display includes information about a model with 45 subgroup columns, training on 52,380 of 68,850 rows. The sampling is being performed using PyMC NUTS (JAX-compiled) with 4 chains running in parallel. The table shows the current progress of each chain with metrics including number of draws (ranging from 601-644), step size (0.01), gradient evaluations, sampling speed (approximately 1.14-1.22 draws/s), elapsed time (8:49), and remaining time estimates.
There's just something special about running a proper Bayesian MCMC script that I can't replace with anything else after doing it for almost 10 years
13.05.2025 04:21 — 👍 2 🔁 0 💬 0 📌 0
7/ A series of errors create an illusion of statistically significant treatment effects of similar size in the five strategies. Examples include changing/adding/removing variables in regressions, using incorrect bandwidths, and changing clustering methods.
09.05.2025 09:29 — 👍 47 🔁 4 💬 1 📌 1

1/ The paper claimed that the reform caused a jump in rape by 50–60 percent. This seemed hard to reconcile with the flat time trend in reported rapes around the time of the reform.
09.05.2025 09:29 — 👍 47 🔁 6 💬 1 📌 2
I need a newsletter because I have so many words inside of me about the "they say they want to raise the birth rate and yet they are decimating maternal and infant health surveillance infrastructure [or whatever else], what a gotcha" thing
04.04.2025 18:29 — 👍 22 🔁 1 💬 4 📌 0
Jeet is wrong about fighting inflation hurting growth tho
04.04.2025 22:48 — 👍 3 🔁 0 💬 0 📌 0
You still only have N=1 per unit of the running variable when its cohort, once you consider the hierarchy. Again refer to the survey example: even if you have a measure with 10,000 respondents per unit time, that doesn't negate the issue that you only have one unit of time per unit time.
03.04.2025 15:34 — 👍 0 🔁 0 💬 1 📌 0
It's similar to using really large surveys for a pre-post comparison. Yes you're increasing the N literally in a tabular sense, but you still effectively have a few data points across time that you're measuring with more and more precision as you jack up N.
03.04.2025 15:12 — 👍 0 🔁 0 💬 1 📌 0
I get this last point, but the distinctions you're emphasizing seem irrelevant, with the logic from the AR piece applying just as much for cohort. For example, what looks like increased N isn't that simple here, because of correlation between people of the same cohort.
03.04.2025 15:11 — 👍 0 🔁 0 💬 1 📌 0
It's an RDD in cohort, which, when only using one cutoff (not eg one repeated year after year), has the same issues from the Annual Reviews piece you link:
- requires observations far from the threshold
- requires considering the time-series nature of the DGP
- the McCrary test becomes irrelevant
03.04.2025 14:42 — 👍 2 🔁 0 💬 1 📌 0
A crowd-sourced repository for valuable government data<!-- --> | <!-- -->DATALUMOS
@icpsr.bsky.social @umich.edu is hosting DataLumos, which is a crowdsource repository of government data archive.icpsr.umich.edu/datalumos/home
02.04.2025 20:04 — 👍 2 🔁 2 💬 0 📌 0
Shingles vaccine & dementia prevention: too good to be true?
A public peer-review
Seeing the "shingles vaccine protects from dementia" claim going around again.
Unfortunately the main study it's based on is just not convincing. @epiellie.bsky.social has written a great post about why:
02.04.2025 22:35 — 👍 128 🔁 33 💬 13 📌 10
hey hey my constant use of the palmerpenguins data is now relevant for my public policy classes
03.04.2025 00:51 — 👍 33 🔁 6 💬 0 📌 0
Sworn in Data Janitor
blog: http://brodrigues.co
youtube: http://is.gd/NjybjH
mastodon: http://is.gd/nOyGht
twitter: @brodriguesco
"nix solves this"
Quantitative social scientist. AP/Lecturer at University of Reading. PhD LSE Government. I work on polarization and emotions, the radical right and gender.
www.katharinalawall.com
Political scientist 🇿🇦🏳️🌈
he/him
Far-right, social identities, & electoral behaviour
http://turnbulldugarte.com/
#ihadablackdog
https://youtu.be/XiCrniLQGYc?si=q-gQTNXfScmgtl4k
Professor of European politics, LSE | Head of the Department of Government | President of EPSS @epssnet.bsky.social | Chair of EES @eesresearch.bsky.social | Co-Director of POAL @poalab.bsky.social | Fellow of the British Academy
public opinion, behaviour, attitudes, &c.
Associate Prof, @sotonpolitics.bsky.social; Assoc. Editor, @poqjournal.bsky.social & @jeppjournal.bsky.social
ColU, Pompey, music, books, & pubs
https://djdevine.org
postdoc at LSE researching populism and climate politics
https://z-dickson.github.io/
Political Scientist at the University of Manchester
🌐 Website: https://www.jack-bailey.co.uk
📓 Notebook: https://publish.obsidian.md/jackbailey
The International Society for Bayesian Analysis (ISBA), est. 1992 to promote the development and application of Bayesian analysis, provides an international community for those interested in Bayesian analysis and its applications.
https://bayesian.org
Political scientist at the University of Pennsylvania. Prof: http://goo.gl/qAOlH9 538: http://goo.gl/1iwZJs
Em. Prof., UC Davis. Various awards, incl. book, teaching, public service. Many books, latest The Art of Machine Learning (uses qeML pkg). Former Editor in Chief, the R Journal. Views mine. heather.cs.ucdavis.edu/matloff.html
Senior Fellow and Professor of Political Science (by courtesy) at Stanford University. Would rather be spending time outdoors with my family and friends.
Asst. Prof. of Statistics & Political Science at Penn State. I study stats methods, gerrymandering, & elections. Bayesian. Founder of UGSDW and proud alum of HGSU-UAW L. 5118.
corymccartan.com
Visualization, data, AI/ML. Professor at CMU (@dig.cmu.edu, @hcii.cmu.edu) and researcher at Apple. Also sailboats ⛵️ and chocolate 🍫.
www.domoritz.de
Associate Professor of Teaching in Statistics, Master of Data Science program Instructor, UBC, Vancouver, Canada | she/her
Experimental Psychologist, social perceptions, metascience. I study the assumptions you make. Here just trying to share good research
https://sites.google.com/view/assumptionlabccsu/home
An open access, open science psychology journal from @ucpress.bsky.social, and the official journal of @improvingpsych.org (SIPS). Editor-in-Chief: @donvanraven.bsky.social
https://online.ucpress.edu/collabra
Postdoctoral Researcher @ The Norwegian University of Science and Technology;
International Organizations, the EU & Political Psychology
https://pmeiners.github.io/