Student projects - Kuruwita
I have student projects available for all levels!
Interested in simulating star formation and interactions with the star-forming cloud? Have a look at these!
I work with students to align the project to their skills, interests, and academic level. 🔭✨#Astronomy
rajikalk.github.io/html_pages/s...
09.02.2026 07:58 — 👍 8 🔁 2 💬 0 📌 0
death by preventable disease is an inevitable and even desired outcome of concentration camps. in every era of concentration camps people have died of typhus, which is a disease of privation and enforced crowding. this illness is intentionally inflicted
02.02.2026 04:52 — 👍 3734 🔁 1418 💬 27 📌 17

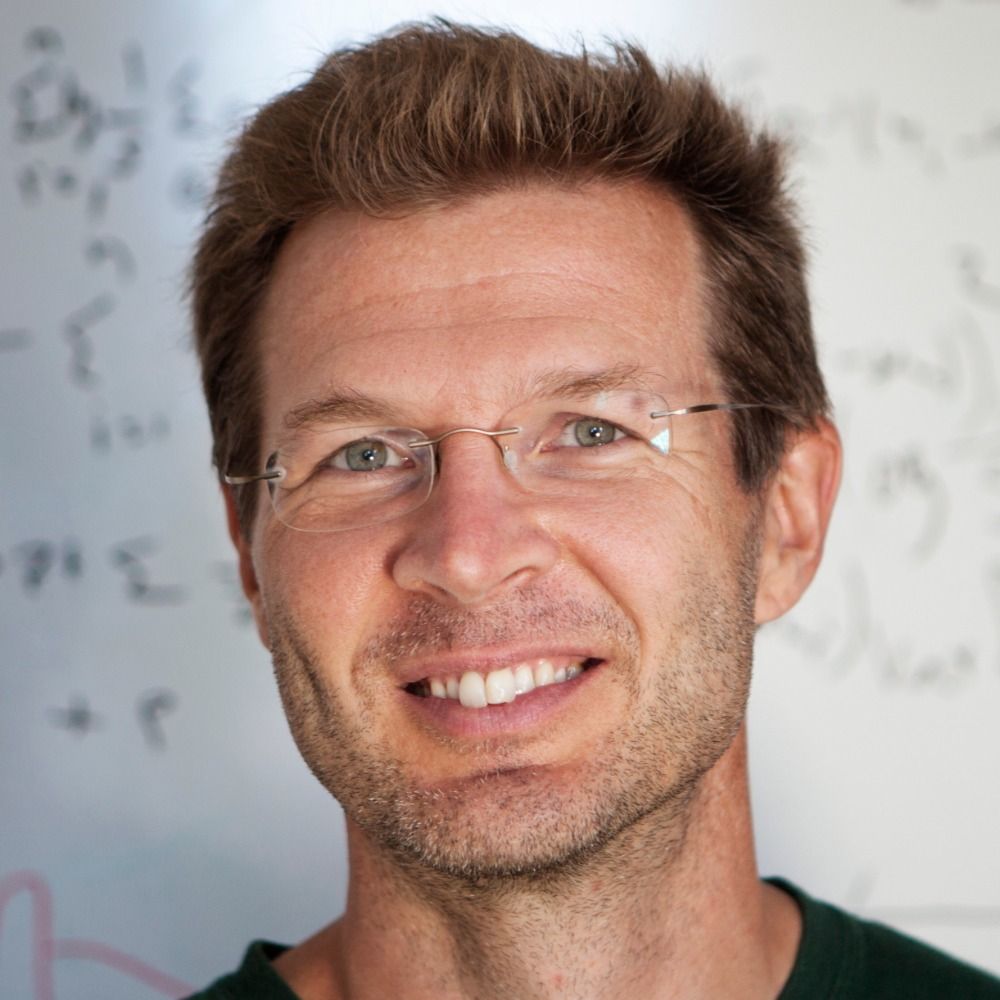
A poster announcing details of Carl’s talk at UC on Feb 13th. Title “ information foraging in a social media world”
Pleased to say that Carl Bergstrom (@carlbergstrom.com) will be speaking at the University of Canterbury on 13th Feb!
He is hosted by @tepunahamatatini.bsky.social come see him at noon in Jack Erskine 441!
02.02.2026 00:52 — 👍 65 🔁 21 💬 5 📌 0
I felt a strong kinship with the people offering $50 for such a sandwich from the OP.
30.01.2026 02:09 — 👍 1 🔁 0 💬 1 📌 0

The meme of Angela Kinsey appearing quietly behind Dwight Shrute from the Office (US).
In the first panel, Dwight is enjoying something, and is captioned "READING THE DEMON HAUNTED WORLD". Angela is labelled "MENTION OF THE 1974 NOBEL PRIZE WITH NO ACKNOWLEDGEMENT OF BELL". In the second panel, Dwight sees Angela and is surprised, captioned "F**k"
Anyone else have this experience?
27.01.2026 08:50 — 👍 3 🔁 0 💬 0 📌 0

An artist's impression of a brown dwarf, from NASA/JPL-Caltech.
Brown dwarfs are "failed stars" - they never got enough mass to burn hydrogen in their cores, or at least not enough to supply the energy they radiate away at their surface. But what happens if you add enough mass to a brown dwarf to push it over that threshold in mass? Does it become a star? 🔭 🧪 🧵
19.01.2026 06:40 — 👍 30 🔁 8 💬 3 📌 1
In our models we can basically describe it just in terms of the amount of entropy that needs to be filled in (to restart convection) relative to the luminosity (Lnuc) available to do that heating. But we only explored a couple simple accretion histories, so this could well be an oversimplification!
19.01.2026 11:52 — 👍 2 🔁 1 💬 0 📌 0

Figure 3 from the paper. It's a version of the cartoon diagram shown elsewhere in the thread, but made with numerical stellar models. Each model is coloured by its fate, with longer frozen core timescales corresponding to yellower colours, and shorter corresponding to bright pink. The closer the objects end up in this space to a particular locus of points (not shown) where Lnuc=Lsurf, the longer the frozen core lasts.
The accretion history can matter if it takes long enough (>1 Gyr, i.e. the thermal timescale) that the internal state of the star changes during accretion. Otherwise the time that the core remains frozen is set by how close the object ends up to the Lnuc=Lsurf line.
19.01.2026 11:21 — 👍 1 🔁 1 💬 1 📌 0
Mostly the latter! To unfreeze the core you need to put in enough energy to raise the temperature to the point that convection can resume, and that’s set by how degenerate the core has been allowed to get.
19.01.2026 10:31 — 👍 2 🔁 1 💬 1 📌 0

Figure 1 from the paper, showing how the erstwhile brown dwarfs evolve. The coloured arrows represent the paths the different stellar and substellar objects take as they evolve on a plot of mass against ψ, the thermal energy per particle in units of the Fermi energy in the star’s core. Lower values of ψ indicate colder and more degenerate cores. The separately coloured regions and their corresponding outline arrows indicate what direction an object would
move. In the pink region within the parabola, objects have a nuclear luminosity, Lnuc, greater than their surface luminosity, Lsurf and they evolve to the right as their cores heat up. In the blue region, Lsurf > Lnuc, so objects evolve to the left as they radiate more energy than
they generate. The black parabola is where Lnuc = Lsurf . The solid right-hand side of the parabola represents the main sequence; it is stable to perturbations in ψ. The dashed left-hand side is unstable. The lowest mass on the parabola is the hydrogen burning limit, MHBL.
The arrows for the red dwarf and brown dwarf are horizontal as these objects do not change their mass throughout their lives without an outside influence. Maroon, pink, and beige dwarfs begin as brown dwarfs and evolve leftwards until an episode of mass accretion results in them splitting off from the brown dwarf arrow vertically, at least in the case of fast accretion. When accretion has stopped, they then evolve horizontally to the left or right. Maroon dwarfs, like red dwarfs, evolve left and settle on the main sequence. Beige dwarfs end up above the hydrogen burning limit, but outside of the parabola, and so evolve left like a brown dwarf, never reaching the main sequence. A pink dwarf is located inside the parabola when mass has stopped accreting and then evolves to the right to settle on the main sequence. The ‘frozen cores/plateaus’ region in the parabola is the area in which a subset of our pink dwarf models have a frozen core or luminosity plateau
They may spend ~a billion years as their core heats up and "unfreezes", while they remain dim on the surface. And naturally, as beige+red dwarfs we call these pink dwarfs.
19.01.2026 06:40 — 👍 11 🔁 0 💬 1 📌 0
But there's an interesting intermediate case, where you wait a while but not quite long enough to make it to beige dwarf territory. These things will eventually become stars, but they take their time.
19.01.2026 06:40 — 👍 6 🔁 0 💬 1 📌 0

Meme of a guy in a red uniform shirt sweating and deciding between several buttons. The guy has a brown circle obscuring his face and is captioned "Brown Dwarf Gaining Mass". There are three buttons labeled "Pink", "Beige", and "Maroon"
If you add mass early, you basically take a brown dwarf and put it in a region of parameter space that is red dwarf-like. So naturally we call these maroon(~ red+brown) dwarfs. These are basically indistinguishable from ordinary low-mass stars as far as we can tell.
19.01.2026 06:40 — 👍 8 🔁 1 💬 1 📌 0

A text meme.
1. Be a brown dwarf
2. Add mass
3. ??????
4. (strikethrough: Profit) Become a star!
But what if you're impatient and add the mass earlier? In a new paper led by University of Canterbury student Jaime Luisi, we run some simulations to find out! arxiv.org/abs/2601.10908
19.01.2026 06:40 — 👍 6 🔁 0 💬 1 📌 0
Remarkably, it depends! As brown dwarfs age, their cores get colder and more degenerate, and if you wait long enough to add the mass, the star doesn't ignite, it just remains essentially like a brown dwarf. These things are called beige dwarfs (because they're brown- and white-dwarf like).
19.01.2026 06:40 — 👍 5 🔁 0 💬 1 📌 0
An artist's impression of a brown dwarf, from NASA/JPL-Caltech.
Brown dwarfs are "failed stars" - they never got enough mass to burn hydrogen in their cores, or at least not enough to supply the energy they radiate away at their surface. But what happens if you add enough mass to a brown dwarf to push it over that threshold in mass? Does it become a star? 🔭 🧪 🧵
19.01.2026 06:40 — 👍 30 🔁 8 💬 3 📌 1
Introducing my new service to generate retrospectives: Orpheus
29.12.2025 12:45 — 👍 0 🔁 0 💬 0 📌 0
Bad time for it (this week), but I appreciate the sentiment!
24.12.2025 01:52 — 👍 0 🔁 0 💬 0 📌 0
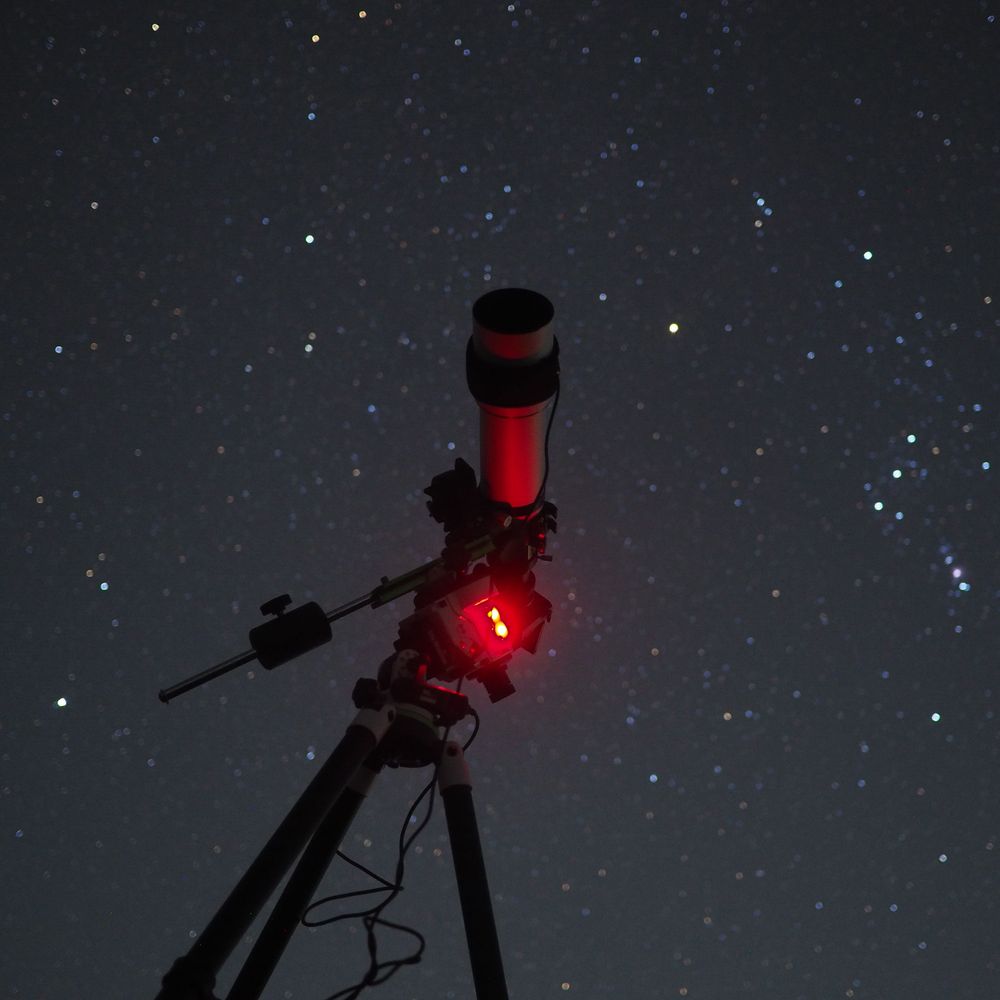
More observations coming soon!
24.12.2025 01:52 — 👍 0 🔁 0 💬 0 📌 0
*and by last week I mean almost 2 weeks ago.
Also, special thanks to my coauthor Harvey, a then-undergrad, now recently-graduated student at UC, who had the courage to pick a risky research project and get the ball rolling!
23.12.2025 14:13 — 👍 6 🔁 0 💬 1 📌 0

The figure from the linked paper (three panels, each a plot of some quantity vs time in days). Here's an expanded verision of the corresponding caption:
Non-gravitational accelerations (NGAs) and their corresponding mass loss rates. Top panel: Non-gravitational acceleration from the JPL Small-Body Database or the final line of Table 1 in T. M. Eubanks et al. (2025). Reported errorbars are shown, and extrapolations into the future or prior to October are shown as dashed lines. The figure shows 5 lines, converging on an acceleration of order 10^-8 au per day^2 for 3I/ATLAS.
Middle Panel: NGAs from the top panel are translated into mass loss rates assuming 1 km diameters, with ζ = 0.5 and ρ = 0.5 g cm^−3. Additionally the JPL Dec 17 solution for other diameters (0.5 km and 2 km) are shown as dotted lines. Data points are from JWST (M. A. Cordiner et al. 2025), SPHEREx (C. M. Lisse et al. 2025), ALMA (N. X. Roth et al. 2025), TRAPPIST-North (E. Jehin et al. 2025), and Swift (Z. Xing et al. 2025). The plot shows a variety of data points scattered around the lines, mostly of order 10^4-10^5 g/s, with the 1 km curves passing close to the data points that measure CO2, and mostly above the other datapoints, depending on the model.
Bottom Panel: CO2 production rates measured by JWST are treated as upper and lower limits, and observations where CO2 is inaccessible are shown as lower limits. Given these constraints, the range of Mdot values and hence diameters for two different reported NGA solutions is shown. The JPL solution is unable to simultaneously fit the upper limit from JWST and the lower limit from TRAPPIST-North. The plot shows the same thing as the middle panel, but with some additional interpretation, namely that some points should be considered upper limits and some lower limits. A red shaded region labelled Eubanks+ Accel shows a range of diameters from 820 to 1050 meters. A gray region labeled JPL Accel shows a diameter of 1100 m.
A little 3I/ATLAS update building on @marshall-eubanks.bsky.social's nice RNAAS from last week. Given its non-grav acceleration and the rate at which it's losing mass, you can work out its size. The answer: a diameter around 1 km, very typical for comets. arxiv.org/abs/2512.18341 🔭 🧪
23.12.2025 13:04 — 👍 65 🔁 14 💬 7 📌 3

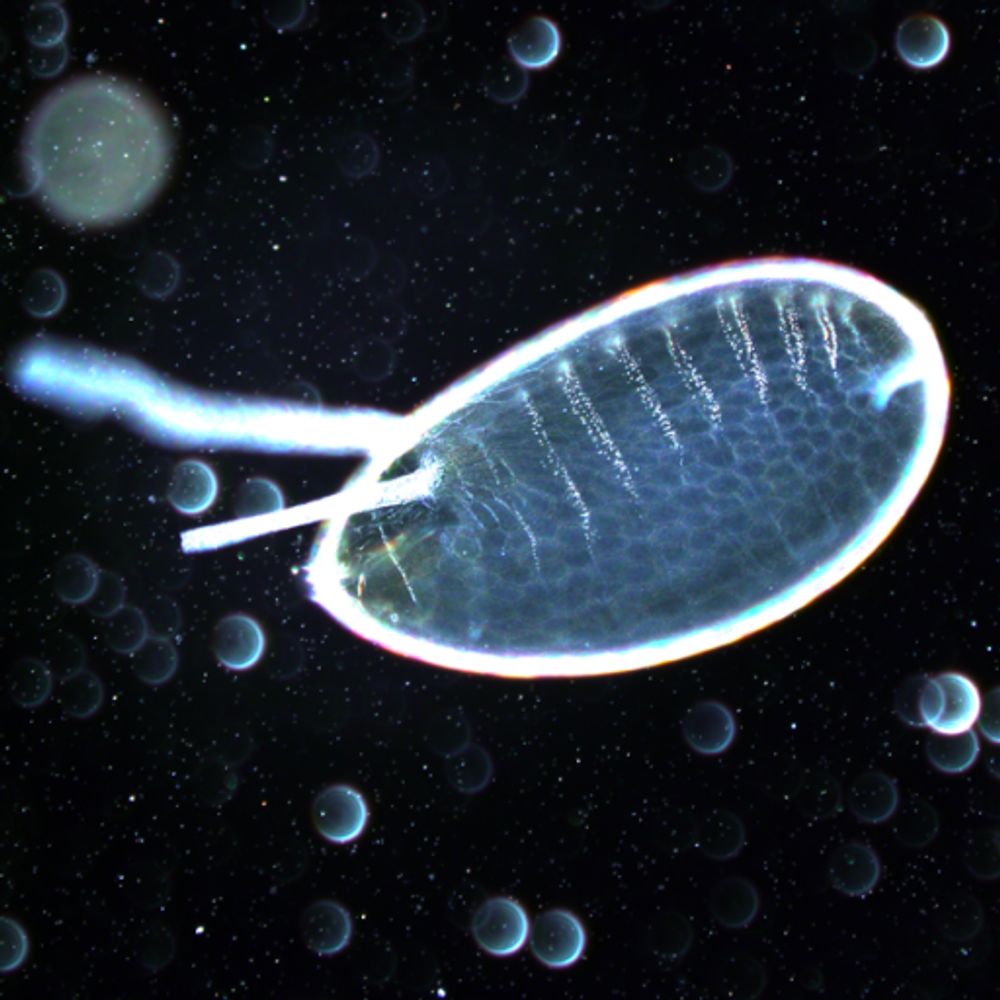
A long queue of people waiting in a queue on a footpath next to a grassy river bank with various interesting plants, at the Ōtautahi botanical garden. A sign in the foreground directs people in various directions, but the labels are cut off.
Bit of a queue to see the corpse flower at the Botanical Garden in Ōtautahi
19.12.2025 22:24 — 👍 8 🔁 0 💬 0 📌 0
Ahead of 3I/ATLAS's closest approach to Earth (at nearly 2 au) tomorrow, here's our Elaine P. Snowden Fellow @astrohopkins.bsky.social on how we determined 3I's age 🇳🇿☄️🔭
17.12.2025 18:08 — 👍 17 🔁 4 💬 1 📌 0
Nice! I've been expecting to see a post like this :-)
Sorry if I missed or if it's otherwise obvious, but do you know why the chi^2 is larger for the 3I models with nonzero Delta T? Naively I would have thought since you're fitting the same data with extra flexibility chi^2 should decrease.
10.12.2025 23:42 — 👍 2 🔁 1 💬 1 📌 0
The 3 y.o.'s top 5 cutest current toddlerisms:
5. oak: "oaka"
4. saturn: "satur-in"
3. broccoli: "bruggoli"
2. instead: "umstead"
1. beetroot: "beetfruit"
08.12.2025 07:20 — 👍 2 🔁 0 💬 0 📌 0
Why does outlook assume I'm starting a new sentence (and hence autocapitalise the next word) every time I use a full stop? Surely I'm not the only one who uses abbreviations in emails!
30.11.2025 10:53 — 👍 1 🔁 0 💬 1 📌 0
Science writer and author of books including Bright Earth, The Music Instinct, Beyond Weird, How Life Works.
I study dark matter, cosmology, and particle physics for a living at UC Berkeley and Lawrence Berkeley National Lab. On the weekends I write explainers about surprising places physics shows up in the natural world.
caragiovanetti.com
sleep deprived astrophysics phd student at @univie.ac.at
she/her
classified as a moving group
website: lillykormann.github.io
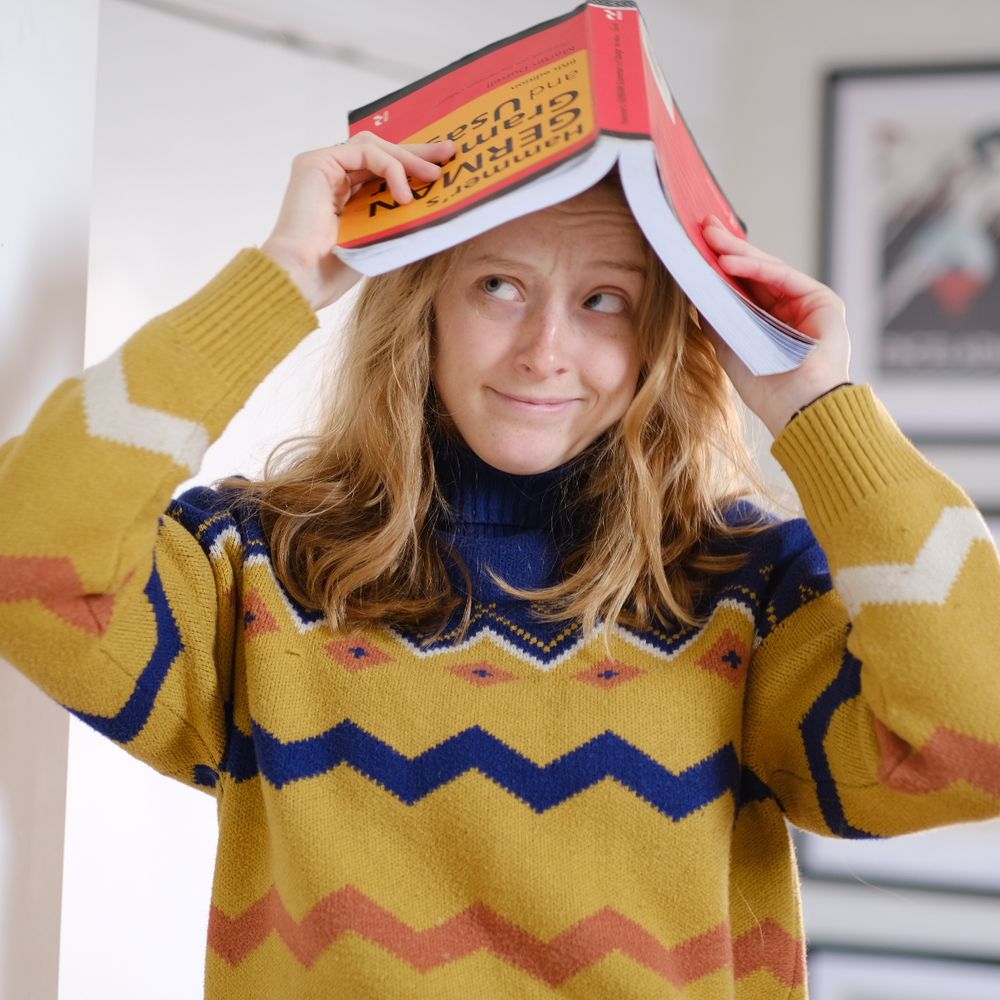
Professional nerd (science journalist). USian in Austria, language geek, and collector of fine yellow zigzagged sweaters and etymology fun facts. Get my newsletter about big questions at the frontiers of science: www.reviewertoo.com 👽🌀🦋
boring answers survive longer.
Independent researcher (theory & methods).
#FormalMethods #Foundations
IPAC at Caltech partners with NASA, NSF, JPL, and the worldwide research community to advance the exploration of our Universe. www.ipac.caltech.edu
Academy Professor in computational Bayesian modeling at Aalto University, Finland. Bayesian Data Analysis 3rd ed, Regression and Other Stories, and Active Statistics co-author. #mcmc_stan and #arviz developer.
Web page https://users.aalto.fi/~ave/
I come from a land next to a land down under …
Zestful user of profanity.
Interests - rugby, rugby, cricket, cricket, beer, wine, SNARK. Unalloyed support for all things Kiwi.
https://bsky.app/profile/groverxv.bsky.social/post/3kzlszkke7m2v
Geneticist, evolutionary biologist, evolution and development. Working mainly on insects, but also big green budgies and snails. Co Director of Genomics Aotearoa, Deputy Director of Bioprotection Aotearoa. Snarked on Substack.
I write the media/internet/culture/politics/whatever newsletter The Present Age: www.readtpa.com
Chicagoan / wife of @kaylapekkala.com / second favorite human to two dogs / not an activist / likes baseball
Engineer, author and speaker. Wonder & Curiosity.
Book: 'Up - A Scientist's Guide to the Magic Above Us' coming April 2026. #Up Narrowboater. British. www.lucyrogers.com
https://uk.bookshop.org/shop/DrLucyRogers
Planetary scientist, podcast host, cat wrangler. Communication specialist for the SETI Institute. planetarypan.medium.com #WomeninSTEM
University of Alabama Astrophysics PhD candidate studying the CGM, NASA Space Grant Fellow, @astrobites.bsky.social author
Dad Lander. Former Councilmember Lander. Former Comptroller Lander. Running for Congress because we need to fight, not fold. 🥊
landerfornyc.com
https://www.mobilize.us/landerforcongress
Former tech founder. Father of two boys.
Occasional rants about tech.
Chocolate Rainmaker. Singer. Thinker. Voice.
Amateur astrophotographer, especially interested in comets / Ερασιτέχνης αστροφωτογράφος, με ιδιαίτερη αγάπη στους κομήτες