
My resume just got a soundtrack! 🎶📊 Who needs bullet points when data can sing its own story?😂
Do give it a listen!
#SunoAI #AI #Resume #DataAnalyst #Data
suno.com/song/76739be...

@smithaaa.bsky.social
Data analyst, Story teller, musician!
My resume just got a soundtrack! 🎶📊 Who needs bullet points when data can sing its own story?😂
Do give it a listen!
#SunoAI #AI #Resume #DataAnalyst #Data
suno.com/song/76739be...
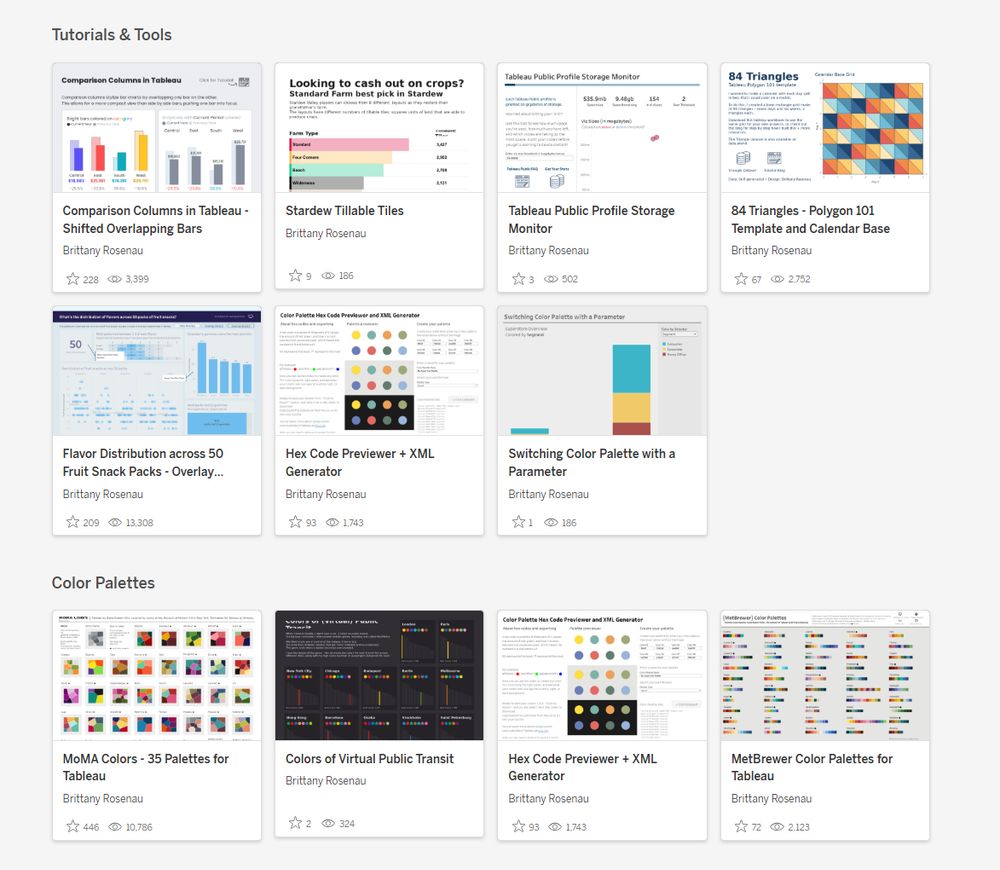
My Tableau Public Profile - Tutorials & Tools and Color Palettes categories
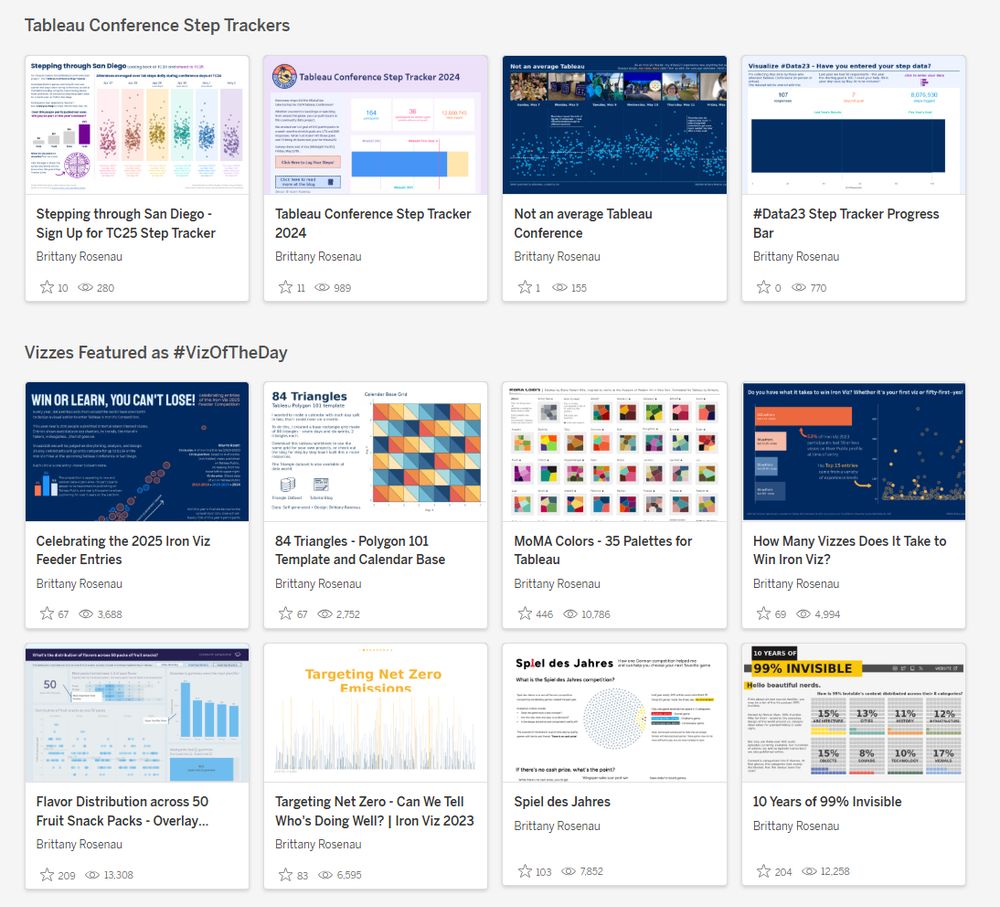
My Tableau Public Profile - Tableau Conference Step Trackers + Viz of the Day categories
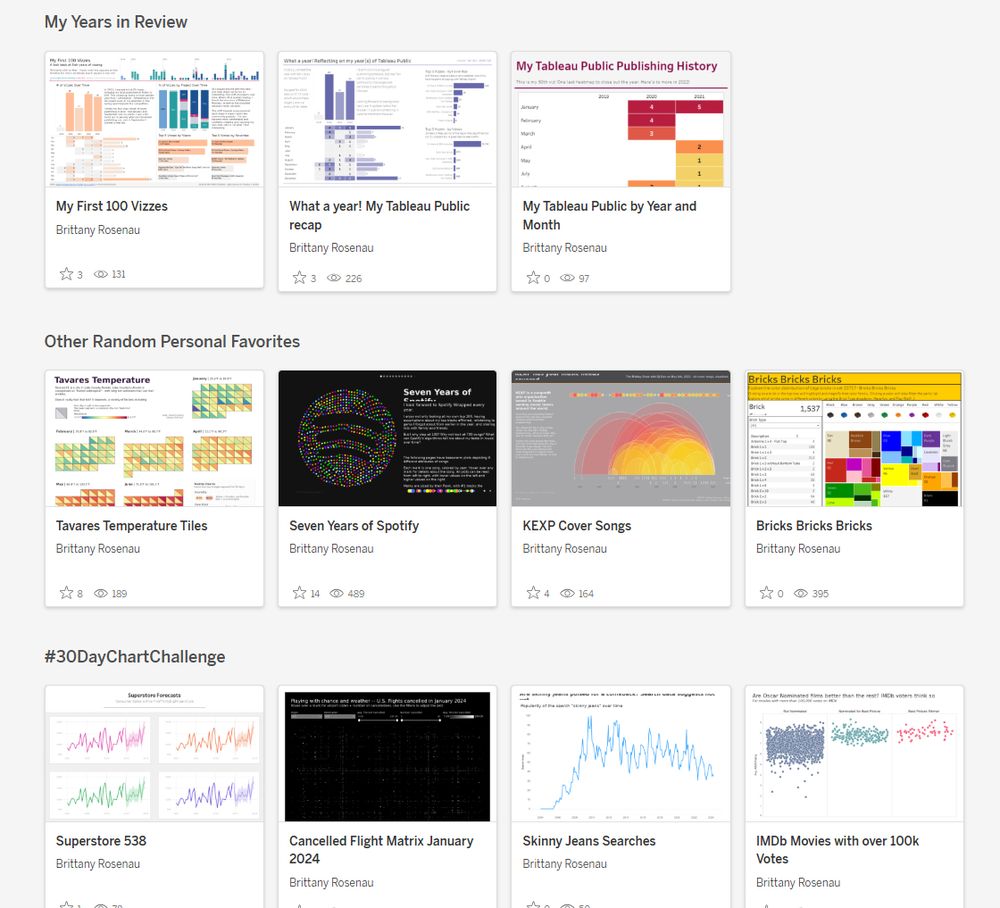
My Tableau Public Profile - Years in Review, Random Personal Favorites, and 30 Day Chart Challenge categories
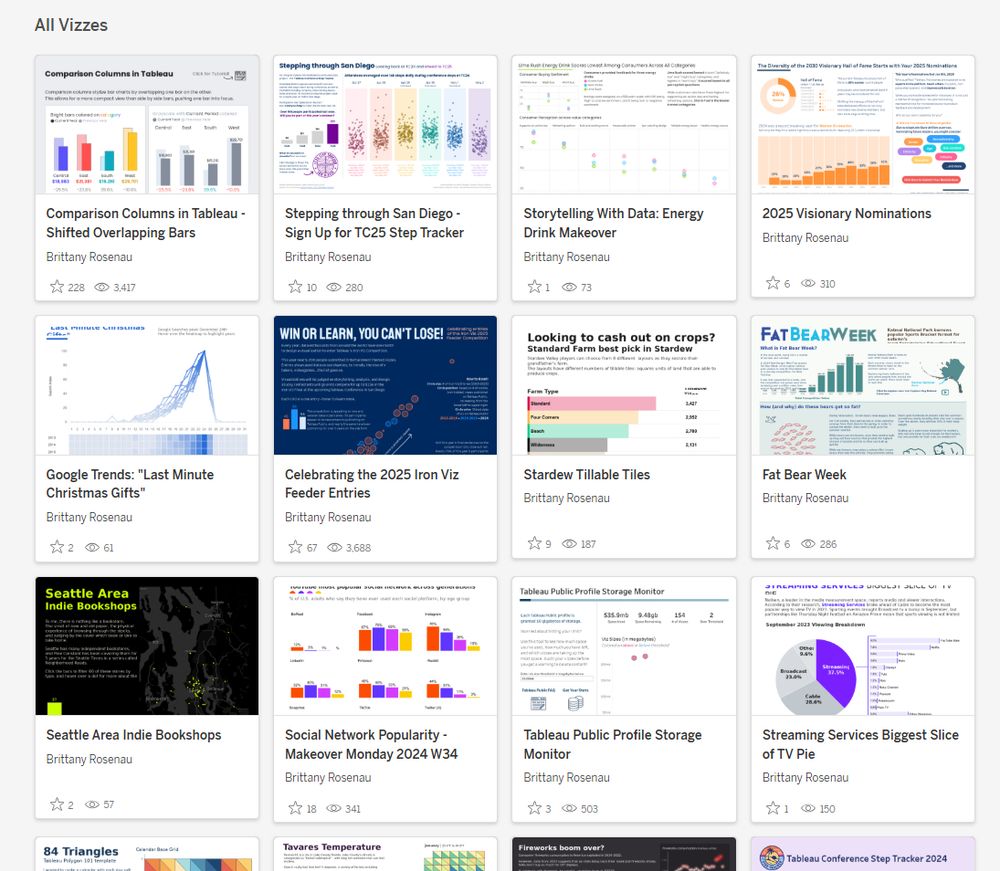
My Tableau Public Profile - All Vizzes category
it's the little things - excited to FINALLY have manual control over categories on my Tableau Public profile!
04.03.2025 03:43 — 👍 10 🔁 2 💬 2 📌 2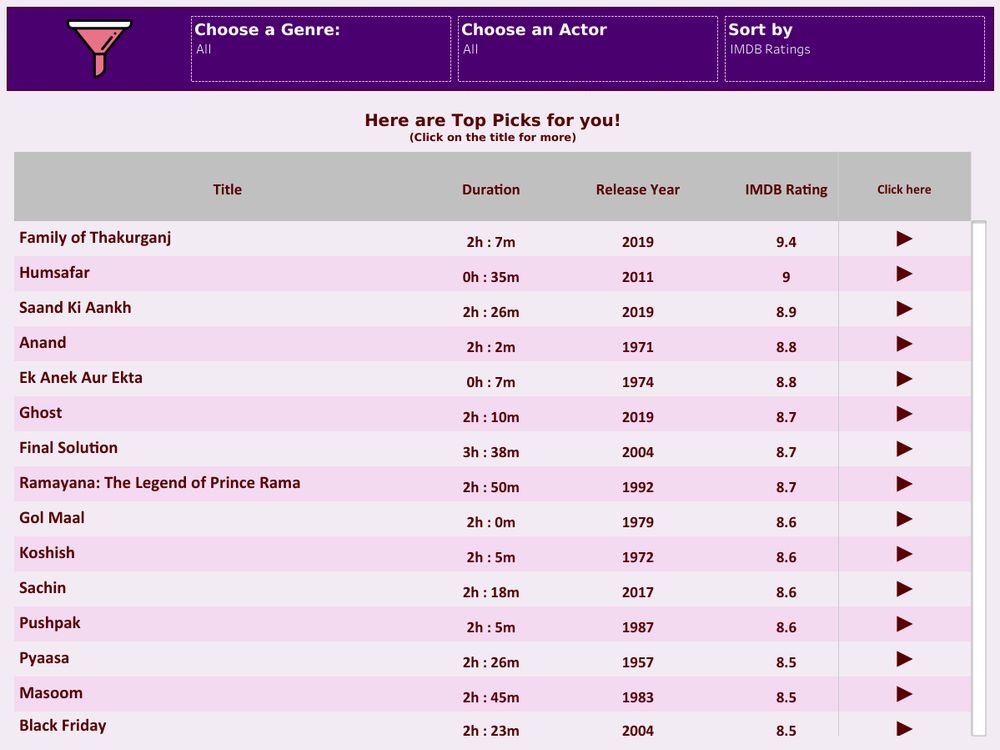
This is a #Tableau #Viz for the movie buffs! Feel free to play around!
public.tableau.com/app/profile/...
#dataviz #tableau #datafam
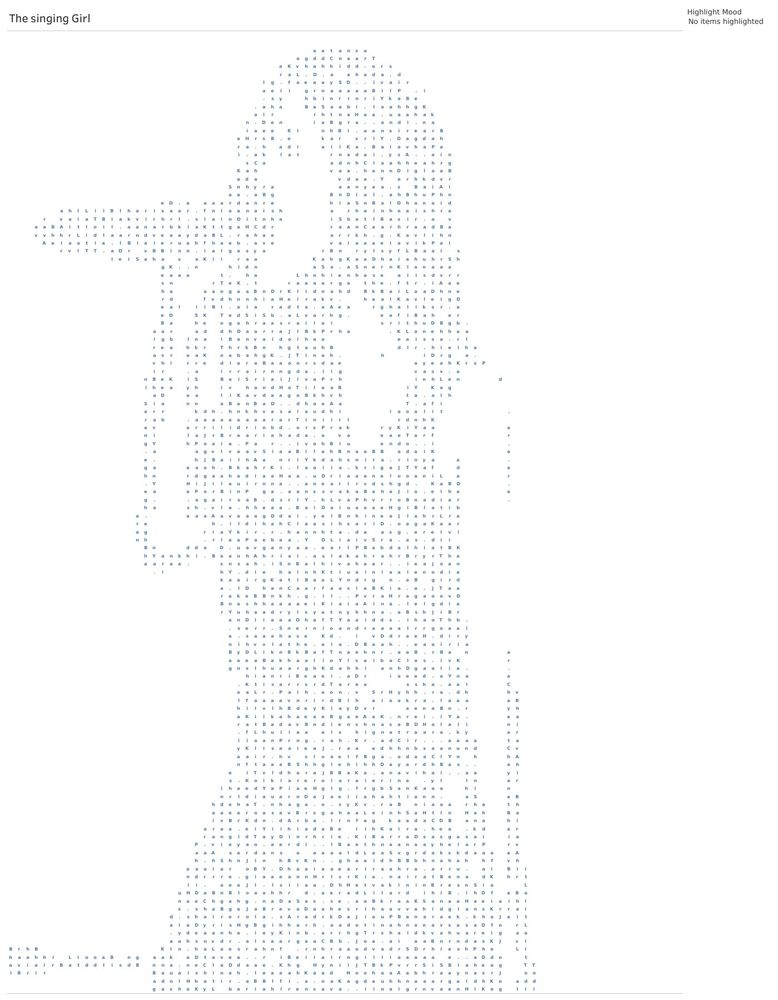
public.tableau.com/views/TheSin...
17.03.2025 12:03 — 👍 4 🔁 0 💬 0 📌 0
public.tableau.com/views/TheSin...
17.03.2025 12:02 — 👍 1 🔁 0 💬 0 📌 0This is really cool!💯
15.11.2024 05:00 — 👍 1 🔁 0 💬 1 📌 0
📊 "Dashboards are not just tools for data discovery; they are also for facilitating communication among people."
In Clare Harvey's latest review, she dives into Data Visualization with Microsoft Power BI by Alex Kolokolov and Maxim Zelensky.
nightingaledvs.com/review-data-...
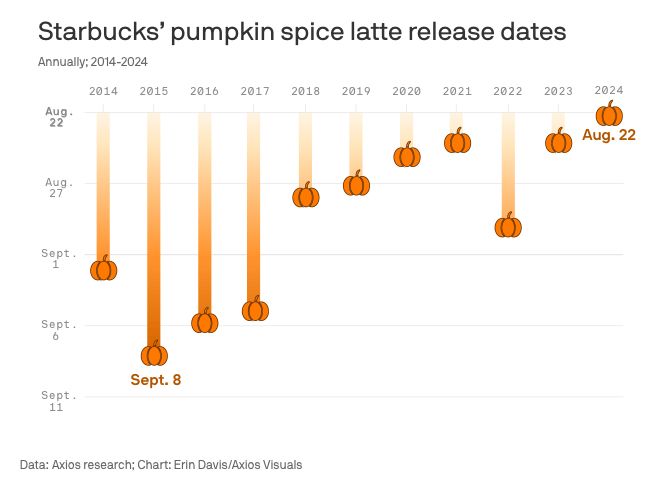
An orange column chart that shows the release date for Starbucks' pumpkin spice latte for each year from 2014 to 2024. 10 years ago, Starbucks didn't release the flavor until early September, but in most recent years, they've been releasing earlier in August. In 2024, the PSL will be available starting August 22.
For no reason whatsoever, please enjoy this PSL chart by @erindataviz.bsky.social. 📊
21.08.2024 16:46 — 👍 11 🔁 3 💬 1 📌 0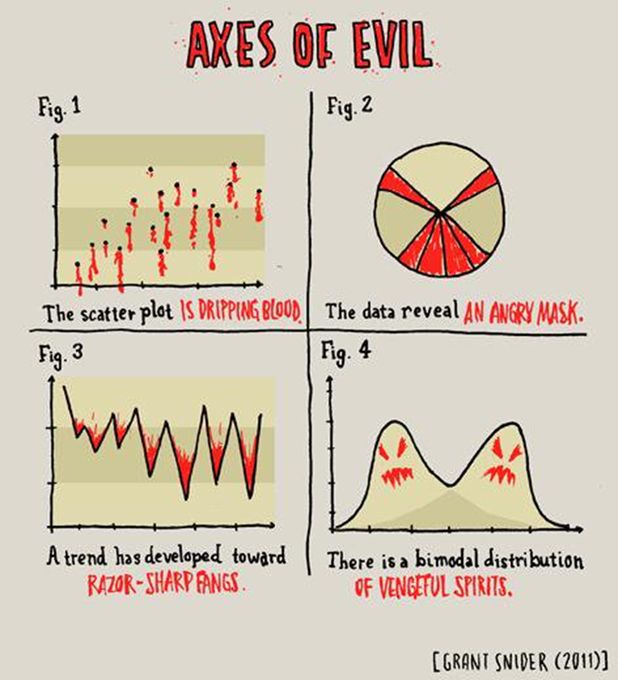
#stats #chartoon 📊
A day or two late for Halloween, but it's still worth remembering the Axes of Evil
Could you please add me?
05.11.2024 06:15 — 👍 1 🔁 0 💬 1 📌 0