New Viz Extension: KPI Card 🚨
Create beautiful KPI Cards in Tableau with trend and comparison, in just two drag-and-drops, and no calculations.
Many customization options (colors, chart type, number format) and easy comparison with targets.
Available in the Tableau Exchange!
10.07.2025 14:17 — 👍 5 🔁 0 💬 0 📌 1

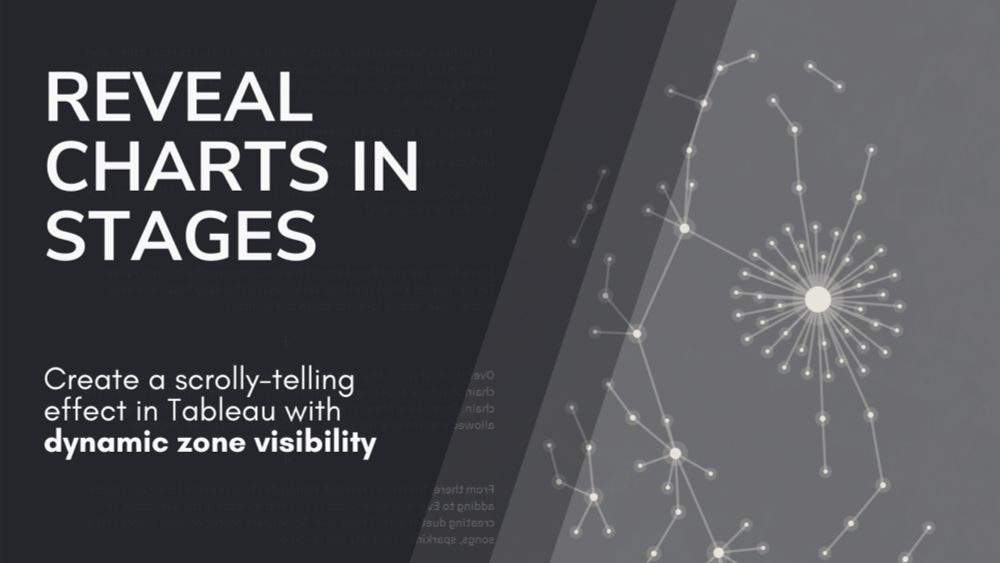
Latest TUG is youtu.be/Vf791kGQ7D8
Pablo Gomez - Color in Data Storytelling
@ladataviz.com - ChatGPT with Tableau Extensions
Cristian Saavedra Desmoineaux & @wjsutton.bsky.social - Land & Expand AI Capabilities w/ Tableau LangChain
LOTS of awesome content @ youtube.com/@TeamDataFam #DataFam
29.05.2025 09:22 — 👍 1 🔁 1 💬 0 📌 0
Just a quick break from Clair Obscur: Expedition 33 to share this new Viz Extension we are working on!
🌎🌍🌏
Tableau + Viz Extension 🤯
09.05.2025 15:58 — 👍 5 🔁 1 💬 1 📌 0
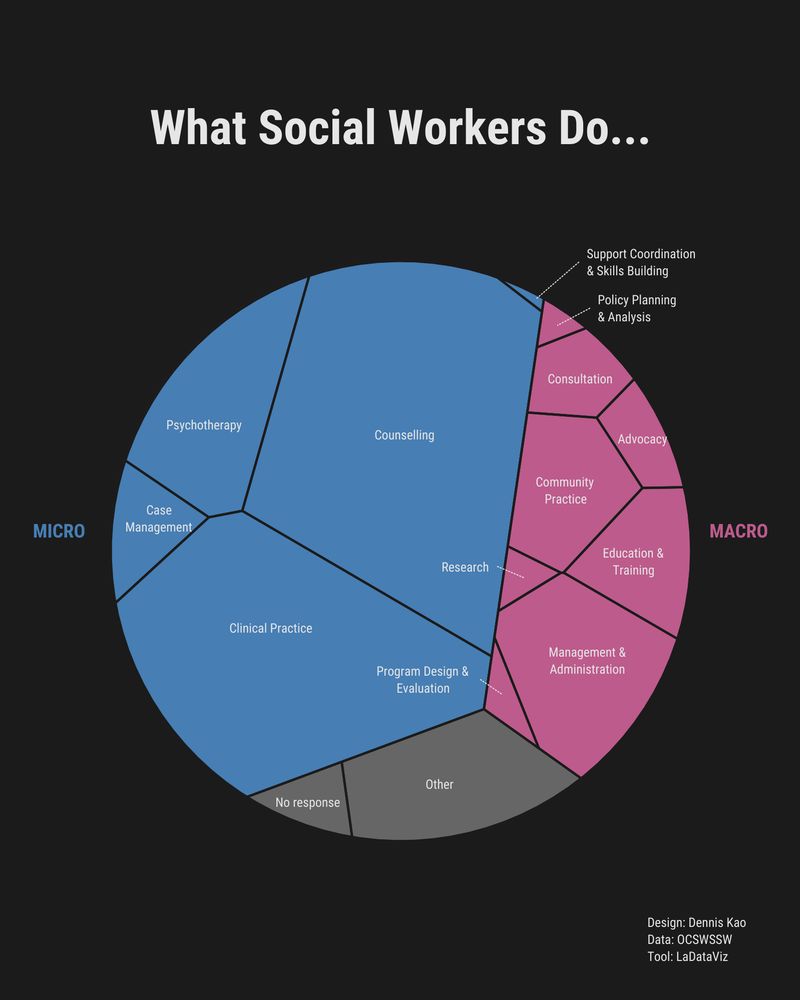
#30DayChartChallenge Day 3 Circular
Here's a Voronoi chart (a circular one 😅) visualizing what social workers do, ranging from working with individuals ("micro") to working at the community, organizational, or policy levels ("macro).
Link: public.tableau.com/app/profile/...
03.04.2025 21:36 — 👍 21 🔁 5 💬 3 📌 0
Tableau 2025.1 is out🎉
And with that, our new 100% free tool:
🛠️Custom Theme Generator 🛠️
With Tableau 2025.1, you can import and export Custom Theme to change the style of your workbook.
With our tool, you can configure your theme visually instead of struggling with JSON!
20.03.2025 07:57 — 👍 8 🔁 2 💬 0 📌 1
Same, see you soon!
11.03.2025 07:27 — 👍 1 🔁 0 💬 0 📌 0
Beyond the Boundaries of Tableau is back at TC25!
Let's push the limits of what you can achieve in Tableau with APIs, Extensions, AI, Figma, and more!
reg.salesforce.com/flow/plus/tc...
I can't wait to share what Jessica Bautista and I have been developing since last year!
10.03.2025 09:54 — 👍 9 🔁 0 💬 1 📌 0
Ah, yes, that sounds perfect for us!
Thanks @anyalitica.dev for tagging!
Unfortunately, with us moving to a new country, I'm not sure we can add more workload at this time or in the coming months.
@maartenzam.bsky.social I'm happy to talk, though, in case you have future needs!
12.02.2025 16:05 — 👍 2 🔁 0 💬 0 📌 0
Since we launched Viz Extensions, we added:
- Donut
- Better UI
- Polar Area
- Essential Pack
- Drill Down Filter
- Draggable Sankey
- Trex Generator Page
- About and What's New
- Background Color and Chart Size
In the next posts, I'll focus on individual chart improvement, and there's a lot!
12.02.2025 15:27 — 👍 1 🔁 1 💬 0 📌 0
One year ago, we launched our first newsletter about
Tableau Viz Extensions!
Last week, we dropped our 14th extension on Tableau Exchange: Draggable Sankey! 🎉
If you haven’t been keeping up, I'll share all the updates and improvements over the next two weeks!
10.02.2025 16:11 — 👍 1 🔁 0 💬 0 📌 0

It's always hard to know if people enjoy our newsletter or not.
Yes, there are metrics like open rate, click rate, and unsubscribe data...
But nothing compares to this kind of direct answer 😍
Thank you!
06.02.2025 18:48 — 👍 0 🔁 0 💬 0 📌 0
Good news: we will launch a brand-new product when
Tableau 2025.1 launches!
Even better news: it will be free! 🎉
05.02.2025 17:09 — 👍 4 🔁 1 💬 0 📌 0
Great!
If you're in Valencia, you can also see warming stripes in the street at El Observatori del Canvi Climàtic
23.01.2025 16:41 — 👍 1 🔁 0 💬 0 📌 0
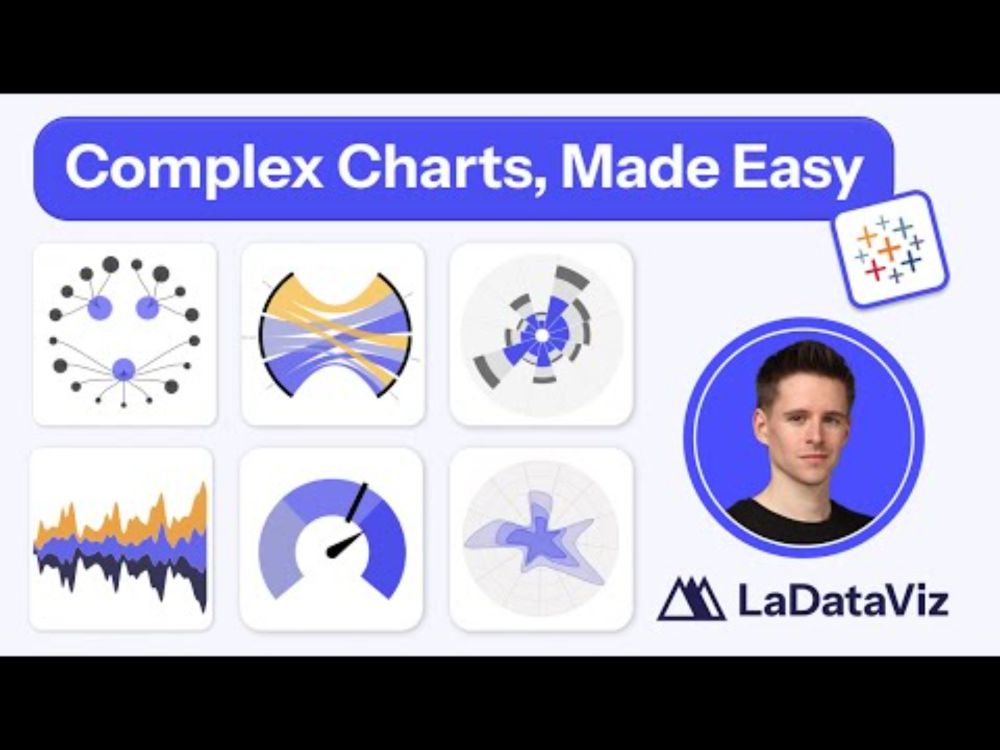
We just updated AdvViz gallery!
Of the 10 Iron Viz Qualifiers, four people used AdvViz to build (at least) one chart.
Also, almost all qualifiers created complex charts for their entry.
I think this quite clearly demonstrates the need for allowing Viz Extensions on @tableaupublic.bsky.social
20.01.2025 16:37 — 👍 12 🔁 2 💬 0 📌 1
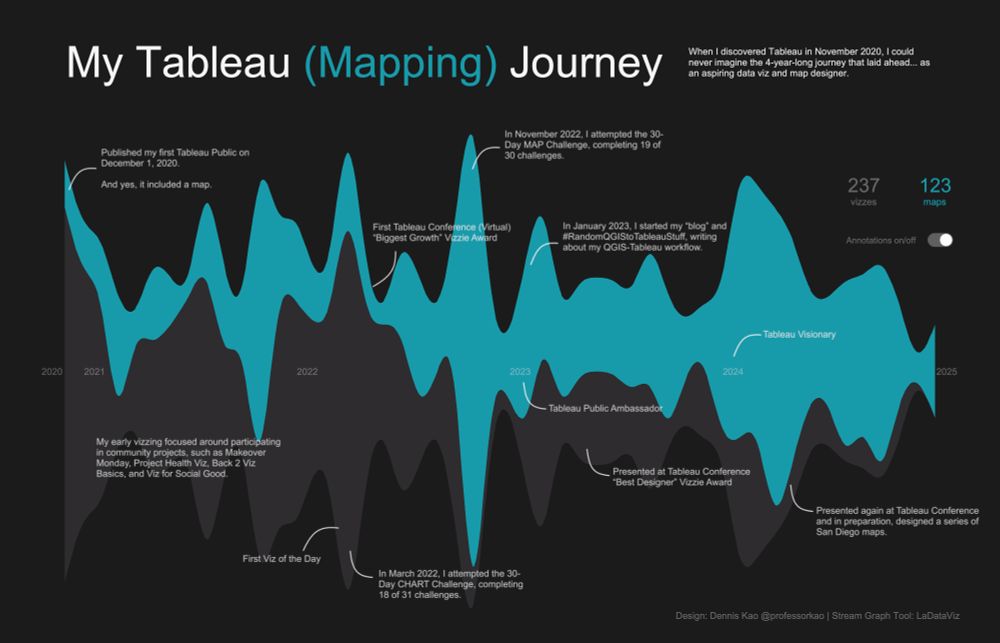
My Tableau (Mapping) Journey visualized... Thanks everyone for all of your support over the past 4+ years. 🙏
Tools: #TableauPublic @figma.com
Stream Graph Tool: @ladataviz.com
Link to workbook: tabsoft.co/3DY0405
17.01.2025 18:28 — 👍 21 🔁 2 💬 3 📌 0
It took me an entire day to write our 2024 review.
It's full of charts, but it is a bit late now, so I'll hit "send" tomorrow!
Was it worth it to build Viz Extensions?
Can you sustain a company just being a couple?
I'll share everything tomorrow in our newsletter (link in bio)
16.01.2025 19:37 — 👍 3 🔁 1 💬 0 📌 0
bsky.app/profile/vivi...
21.12.2024 16:12 — 👍 3 🔁 0 💬 1 📌 0
YouTube video by LaDataViz
Solve your Tableau challenges faster than ever
youtu.be/7X9SOffybwk
19.12.2024 14:31 — 👍 1 🔁 0 💬 0 📌 0
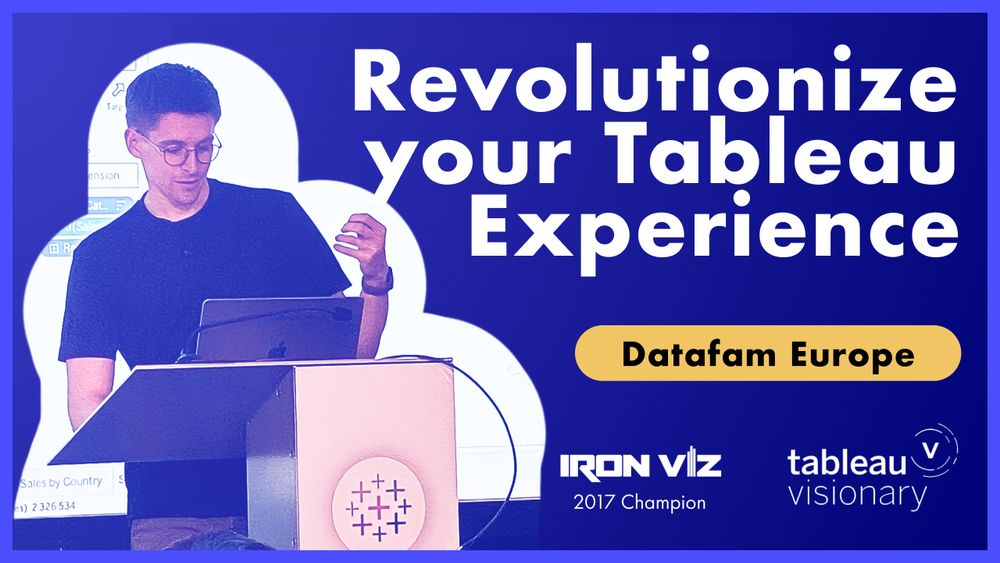
Revolutionize your Tableau experience!
I've recorded my presentation at #datafam Europe since many of you could not attend the event in London.
Discover Viz Extensions / Figma to Tableau / and the new Filter Manager!
Video available on my YouTube channel (link below)
19.12.2024 14:31 — 👍 5 🔁 2 💬 1 📌 0
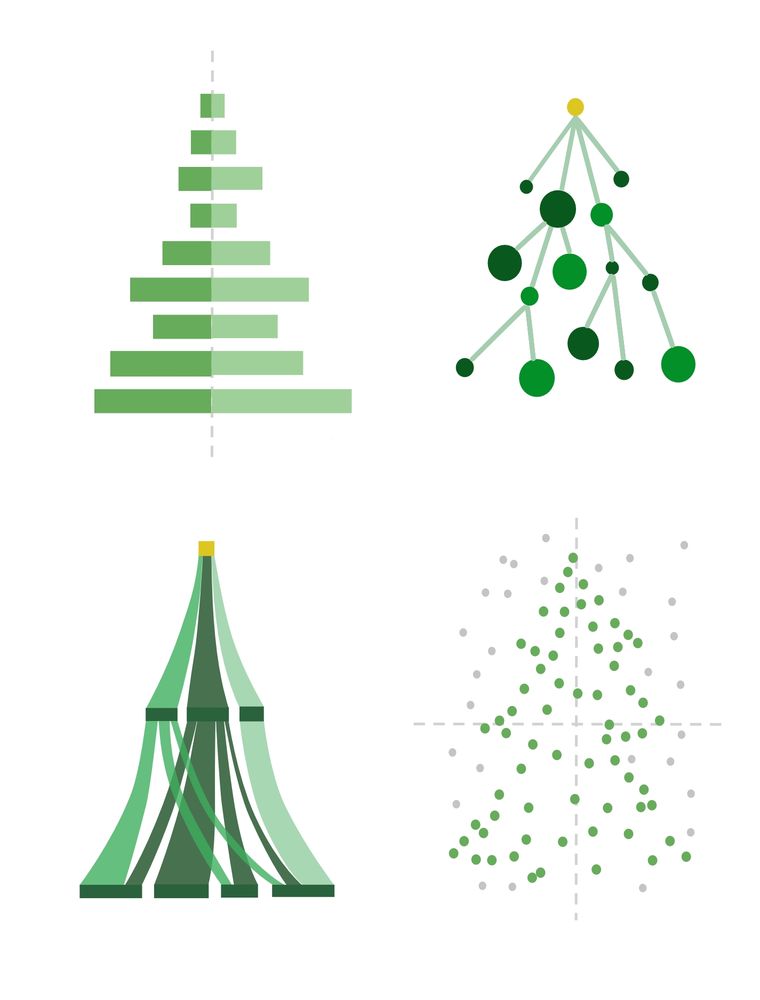
Four Christmas trees, each in the style of a different chart, arranged in a two by two grid. Top left is a population pyramid, top right is a network graph, bottom left is a vertical Sankey, and bottom right is a scatter plot
I drew these for the #datafam holiday card exchange, but figured I'd share them for others to use too! Put them on your cards, gift tags, or anywhere that needs a little more #dataviz 📊
16.12.2024 03:51 — 👍 388 🔁 86 💬 13 📌 6
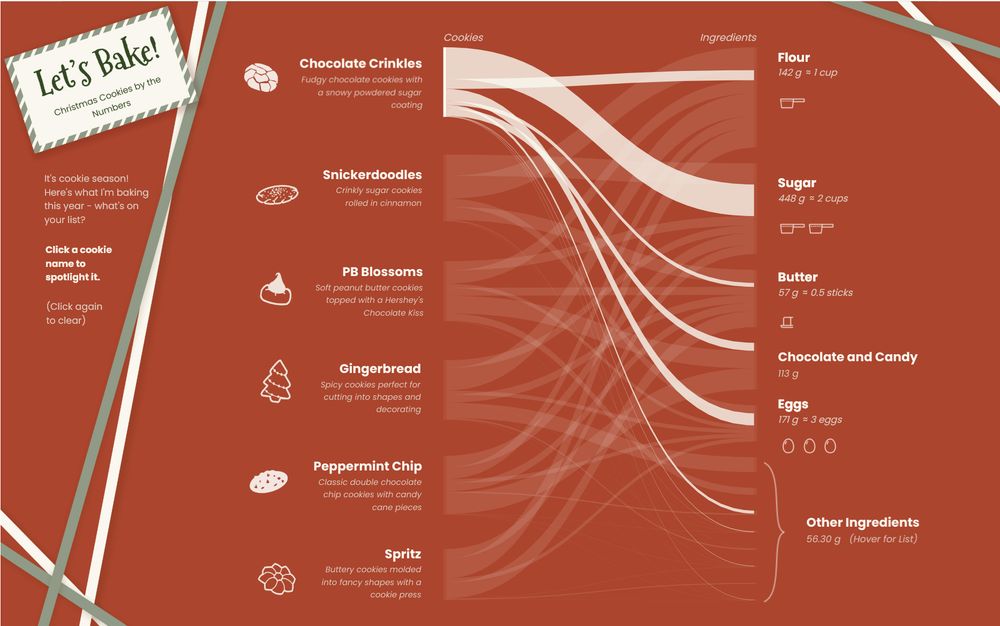
A screenshot of a tableau public data visualization. The title card, styled like a recipe card, reads "Let's Bake! Christmas Cookies by the Numbers". The background is dark red, and white and green ribbons criss-cross the edge of the frame. In the center is a Sankey chart showing types of Christmas cookies on the left edge and cookie ingredients on the right edge, and the flow between them. The cookies and ingredients both have icons showing the type of cookie or the ingredient quantity.
Christmas cookies. Sankey diagrams. Tableau Public.
My holiday viz is live, and I think it has everything! Check it out - and maybe bake some cookies too. public.tableau.com/app/profile/...
Sankey generator by @ladataviz.com - thank you!
#datafam #dataviz #cookies #data #tableau #tableaupublic
09.12.2024 05:28 — 👍 22 🔁 5 💬 2 📌 0
annnnnd here's the final viz! a celebration of this year's Iron Viz participants. Check out the interactive version for stats on each contestant, including # of vizzes on Tableau Public + how many times they've entered the competition
📊: public.tableau.com/app/profile/...
14.11.2024 14:47 — 👍 26 🔁 2 💬 6 📌 1
I was already there, thanks!
But I joined a long time ago so I found a lot of new poeple thanks to it :)
15.11.2024 12:31 — 👍 1 🔁 0 💬 0 📌 0
Thanks for the pack @darraghmurray.bsky.social!
I found a few people I was not yet following.
Hello everyone 👋
15.11.2024 10:27 — 👍 2 🔁 0 💬 1 📌 0
I just discovered that you can connect your domain and change your handle.
@ladataviz.com, as simple as that 🎉
Yesterday, I figured you could share a YouTube video that will play directly in the post.
Nice features, I like it here!
15.11.2024 09:59 — 👍 11 🔁 0 💬 0 📌 0
YouTube video by LaDataViz
Viz Extensions: Tableau's Biggest Game Changer!
D3 ❤️ Tableau
Did you know you can use D3 to render charts directly in Tableau without leaving the tool and with simple drag and drop?
That's Viz Extension, and it removes all the visual boundaries Tableau used to have.
We explain everything in this new YouTube video 👇
youtu.be/bDXZuNqRg4U
14.11.2024 15:25 — 👍 3 🔁 1 💬 0 📌 0
Looking very much forward to the final result! 😍🍷
13.11.2024 22:21 — 👍 1 🔁 0 💬 0 📌 0
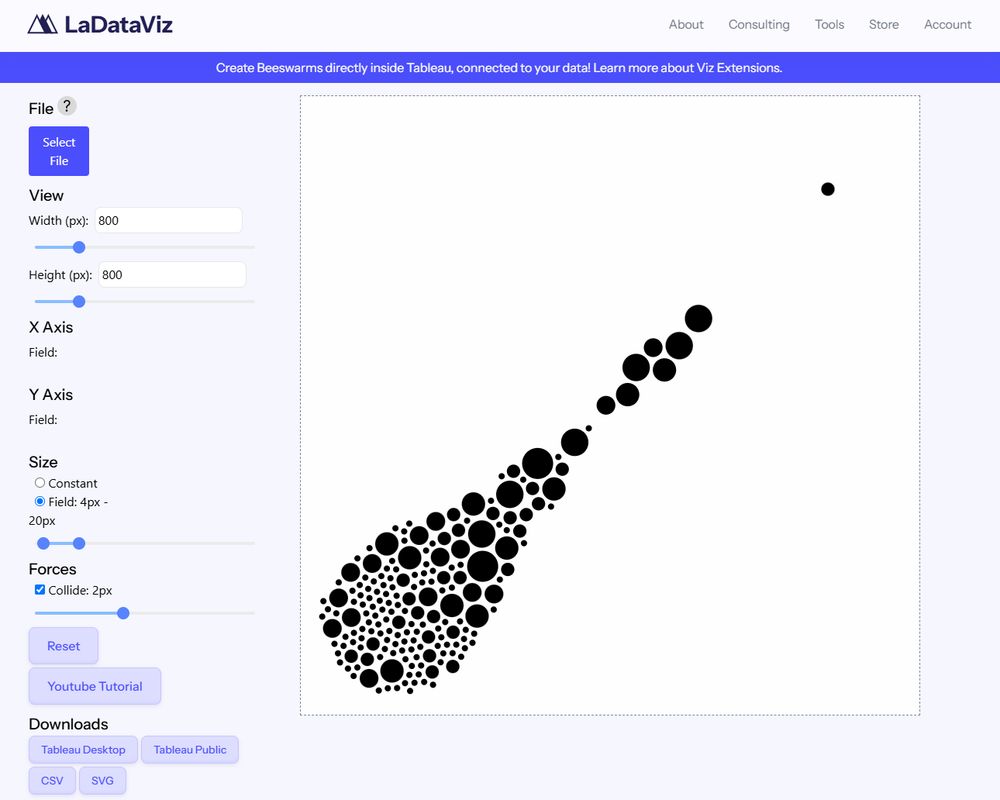
beeswarm chart on an angle generated using LaDataViz adviz beeswarm tool. the way the bubbles are clustered looks similar to a champagne bottle on it's side with a cork popping off to the upper right
playing with @ladataviz.bsky.social's adviz for a little #dataviz side project and accidentally stumbled onto a design i love 🍾
13.11.2024 21:44 — 👍 18 🔁 1 💬 4 📌 1
Science graphics at NY Times
We're on a mission to elevate how business communicates and understands data, tackling complex problems with innovative solutions. JasonForrestAgency.com
Data Nerd, Tableau Public Ambassador, speedcuber, aspiring unicyclist
Journalist, author, musician, sonifier. I make things with data. Half of Loud Numbers.
Data visualization designer & data scientist
Co-founder of Jetpack.AI
Tableau Visionary | Tableau Forums Ambassador | WOW co-lead | Footie Mum
Data Analyst, comic artist and a noob drummer/A mom to a badass teen and a brit short hair cat/Tableau Ambassador.
Customer Success Manager @tableau
#MakeoverMonday leader
#datafam
Climate scientist at the National Centre for Atmospheric Science, University of Reading | IPCC AR6 Lead Author | MBE | Views own | https://edhawkins.org
Warming Stripes: http://www.ShowYourStripes.info
I like talking about data visualisation and actionable insights in Power BI, and pushing for better vis & UI/UX.
I spend my days crunching numbers and my nights torturing a wife and cats with the sound of keystrokes. Opinions are my own. #MicrosoftEmployee
Co-organizer: Saint Louis Microsoft Fabric / Power BI @ https://aka.ms/fabricstl
Data | Guitar | Pro-Wrestling
Tableau Trainer delivering productivity solutions to individuals and teams.
Data Digger, Insight Bringer 📊 | Data Analyst | SQL | Tableau | Workshop Facilitator | Open to New Opportunities
Tableau / Alteryx / dataviz. Long-time tech geek, living and breathing data every day.
Available for local and remote work.
📈 Steve Fenn is a data visualization architect who has provided visual data reporting & Tableau training since 2015.
📊 Vizzing for fun since 2010.


![Alex Power[s]](https://cdn.bsky.app/img/avatar/plain/did:plc:qgxrhtavp4haeysnbcfsgbpd/bafkreicehq56u5b6zmxptyykktrgqzpkbfx7tjxsvwy2jwrb4jt7dkwbjq@jpeg)