Lots of exciting things happening here! 📈
03.08.2025 21:47 — 👍 77 🔁 16 💬 0 📌 0
July 2025 #Arctic sea ice extent was the 4th lowest on record for the month...
This was 1,810,000 km² below the 1981-2010 average. July ice extent is decreasing at about 6.87% per decade. Data: nsidc.org/data/seaice_...
03.08.2025 15:05 — 👍 69 🔁 29 💬 3 📌 1
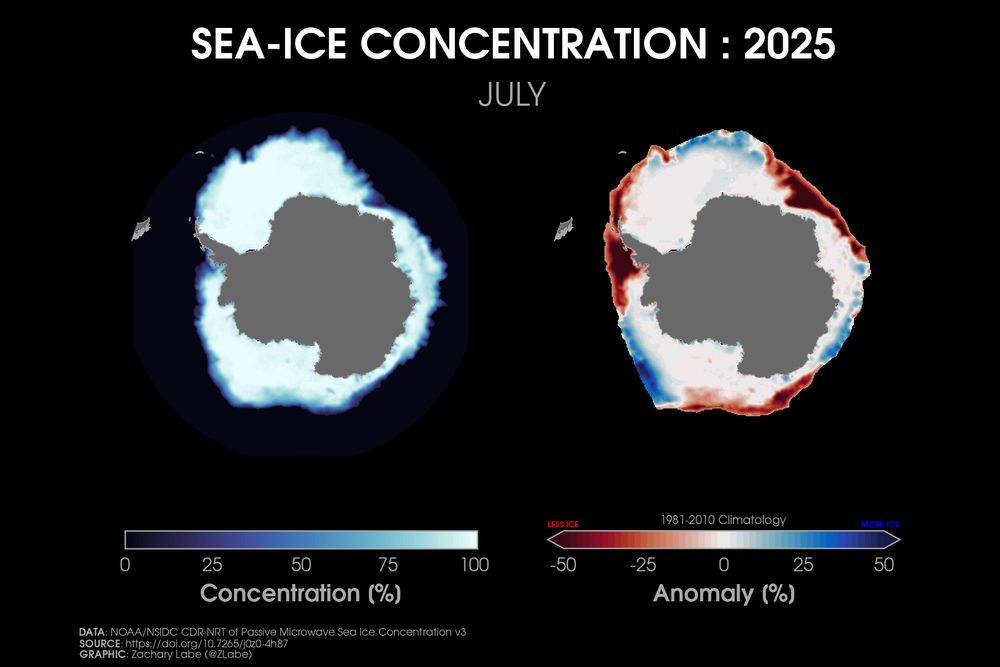
Two polar stereographic maps side-by-side showing Antarctic sea ice concentration and its anomalies relative to 1981-2010 for July 2025. Red shading is shown for less ice, and blue shading is shown for more ice. More areas are below average than above. Antarctica is masked out in grey shading.
This graphic shows a map view of sea ice departures in July 2025. Red areas indicate less ice than the 1981-2010 July average, and blue areas indicate more. For instance, ice continued to grow slowly in the Bellingshausen Sea region.
Data provided by @nsidc.bsky.social (nsidc.org/data/g02202/...).
03.08.2025 12:32 — 👍 60 🔁 19 💬 0 📌 0
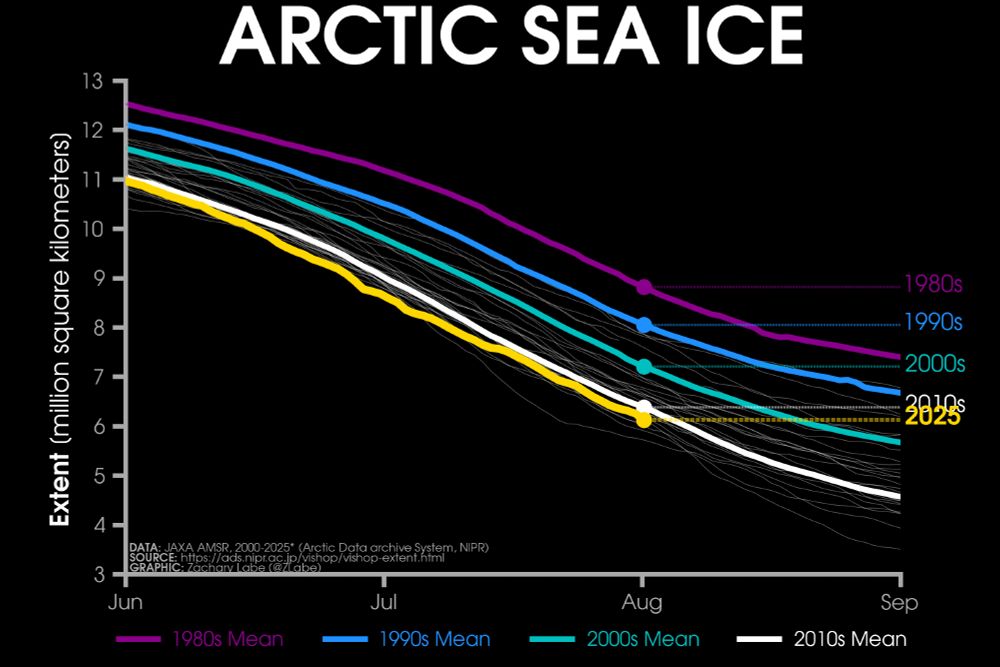
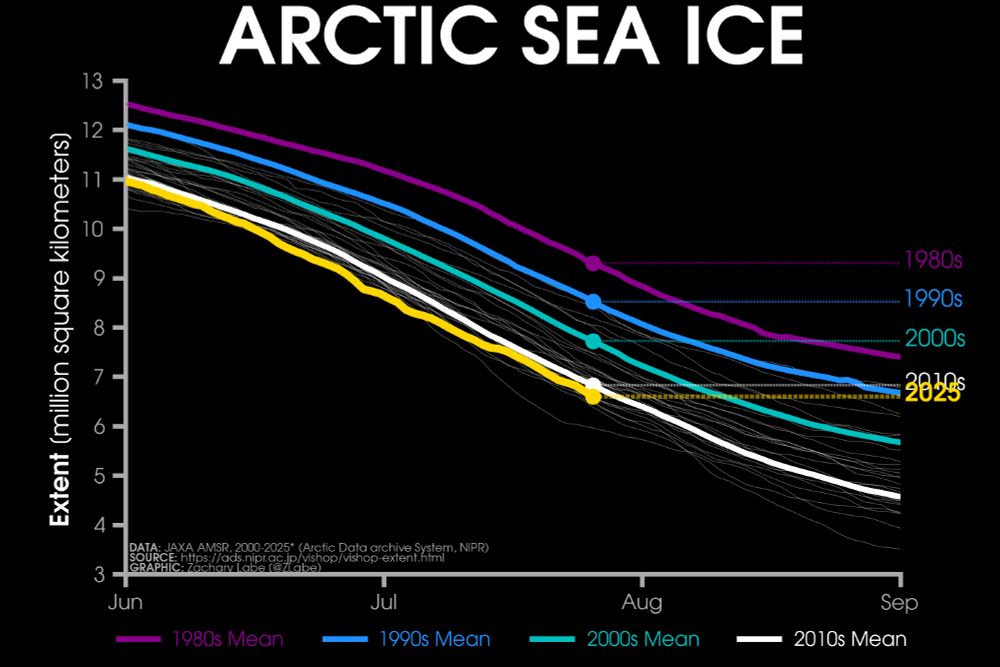
Line graph time series of 2025's daily Arctic sea ice extent compared to decadal averages from the 1980s to the 2010s. The decadal averages are shown with different colored lines with purple for the 1980s, blue for the 1990s, green for the 2000s, and white for the 2010s. Thin white lines are also shown for each year from 2000 to 2024. 2025 is shown with a thick gold line. There is a long-term decreasing trend in ice extent for every day of the year shown on this graph between June and September by looking at the decadal average line positions.
Saturday ice update - #Arctic sea ice extent is currently the 5th lowest on record (JAXA data)
• about 260,000 km² below the 2010s mean
• about 1,080,000 km² below the 2000s mean
• about 1,930,000 km² below the 1990s mean
• about 2,690,000 km² below the 1980s mean
More zacklabe.com/arctic-sea-i...
02.08.2025 16:08 — 👍 101 🔁 47 💬 2 📌 1
Technical data update - This morning I went through and modified all of my real-time sea ice graphics to be consistent with the new NSIDC Sea Ice Index v4, which now uses AMSR2 for the year 2025.
The effect of this new product version update on my visualizations is expected to be minor.
02.08.2025 15:16 — 👍 54 🔁 6 💬 1 📌 0
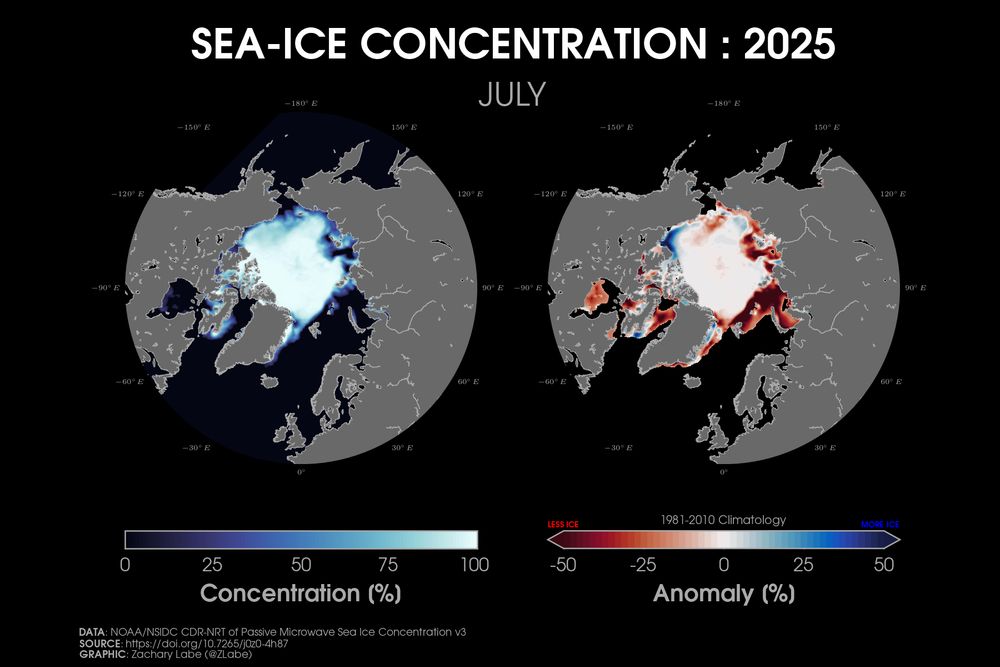
Two polar stereographic maps side-by-side showing Arctic sea ice concentration and its anomalies relative to 1981-2010 for July 2025. Red shading is shown for less ice, and blue shading is shown for more ice. Most areas are below average for sea ice concentration along the edge of the Arctic. Continents and land are masked out in a gray shading.
Last month observed large areas of missing ice cover across the Barents and Kara Seas region. However, very persistent ice remains in the Beaufort Sea, which will very likely prevent any new records from being set this year.
+ Data: nsidc.org/data/g02202/...
+ Concentration = fraction of sea ice
02.08.2025 14:06 — 👍 72 🔁 19 💬 0 📌 0
Today's new animation shows yearly changes in average sea surface temperature anomalies from 1982 (start of dataset) through last year. Note the large variability, long-term warming trends, and contrasts between different coastal regions.
U.S. climate indicators: zacklabe.com/united-state... 🌊
01.08.2025 23:04 — 👍 218 🔁 56 💬 10 📌 6
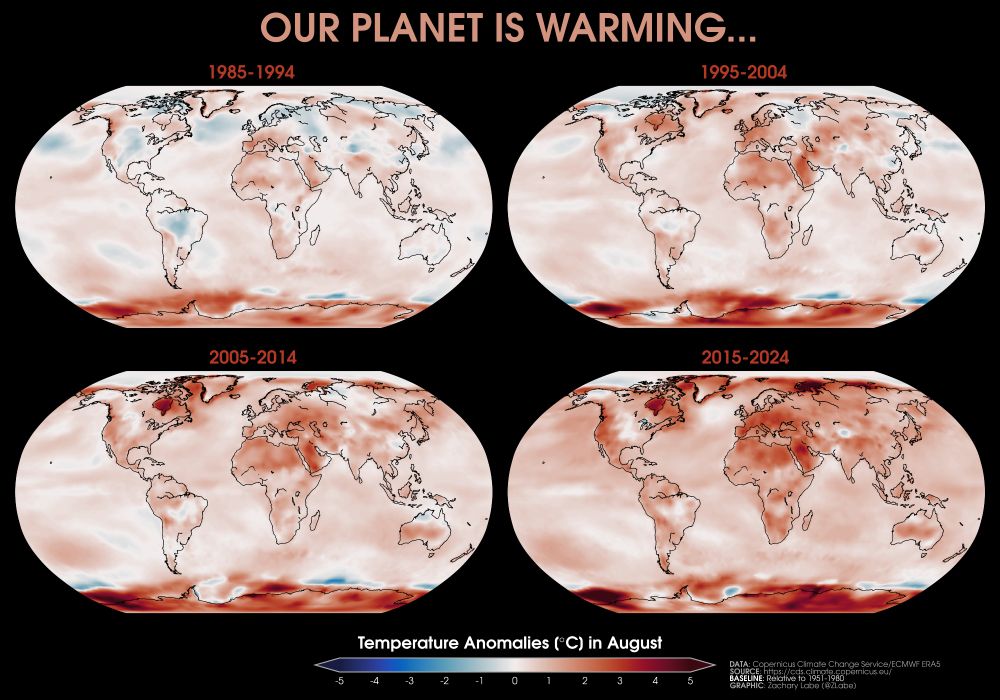
Four global maps showing near-surface air temperature anomalies for the month of August in 1985-1994, 1995-2004, 2005-2014, and 2015-2024. Most all areas are observing long-term warming, which is largest over the Arctic region and Asia. Anomalies are calculated relative to 1951-1980 from ECMWF ERA5 reanalysis.
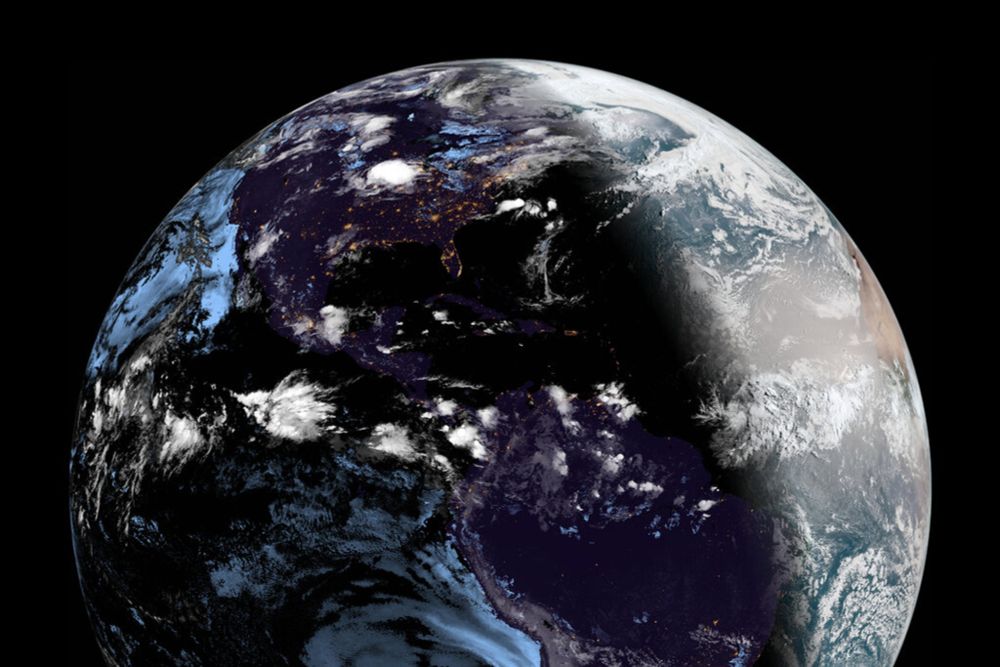
Welcome to August! Our planet is hotter, and it's only going to get hotter.
Maps show the changes in August temperature by decade. Data used from @copernicusecmwf.bsky.social ERA5 reanalysis.
01.08.2025 11:04 — 👍 105 🔁 51 💬 1 📌 1
*Note: to accompany this data change (SSMIS to AMSR2), I will update all of my sea ice visualizations on my website this coming weekend to be consistent with this latest version.
01.08.2025 01:07 — 👍 24 🔁 1 💬 0 📌 0
New version release: NOAA/NSIDC Sea Ice Index, Version 4 | National Snow and Ice Data Center
NOAA@NSIDC is pleased to announce the release of Sea Ice Index, Version 4.
Great news and well done @nsidc.bsky.social!
"NOAA@NSIDC is pleased to announce the release of Sea Ice Index, Version 4.
This new version uses input data from the JAXA GCOM-W1 AMSR2 instrument for 1 January 2025 through forward processing."
01.08.2025 00:59 — 👍 110 🔁 21 💬 1 📌 0
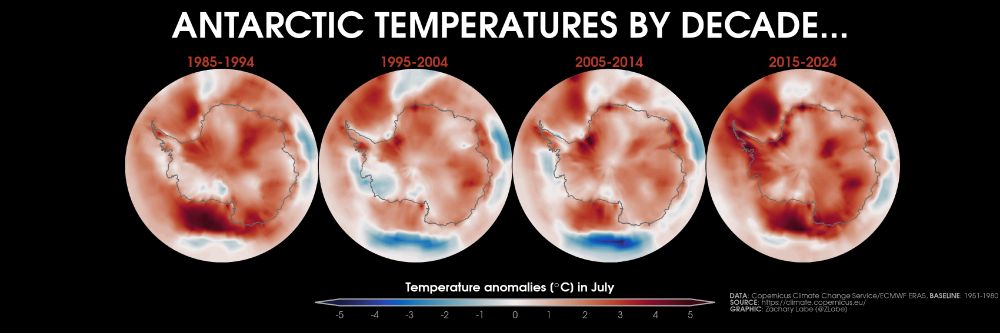
Four polar stereographic maps showing Antarctic near-surface air temperature anomalies for the month of July in 1985-1994, 1995-2004, 2005-2014, and 2015-2024. There is substantial regional variability.
A look at temperature departures for each of the last 4 decades across the #Antarctic. Lots of spatial variability by region this time of year.
Data from doi.org/10.24381/cds... and uses a 1951-1980 reference period for the anomalies.
31.07.2025 18:50 — 👍 42 🔁 19 💬 0 📌 1
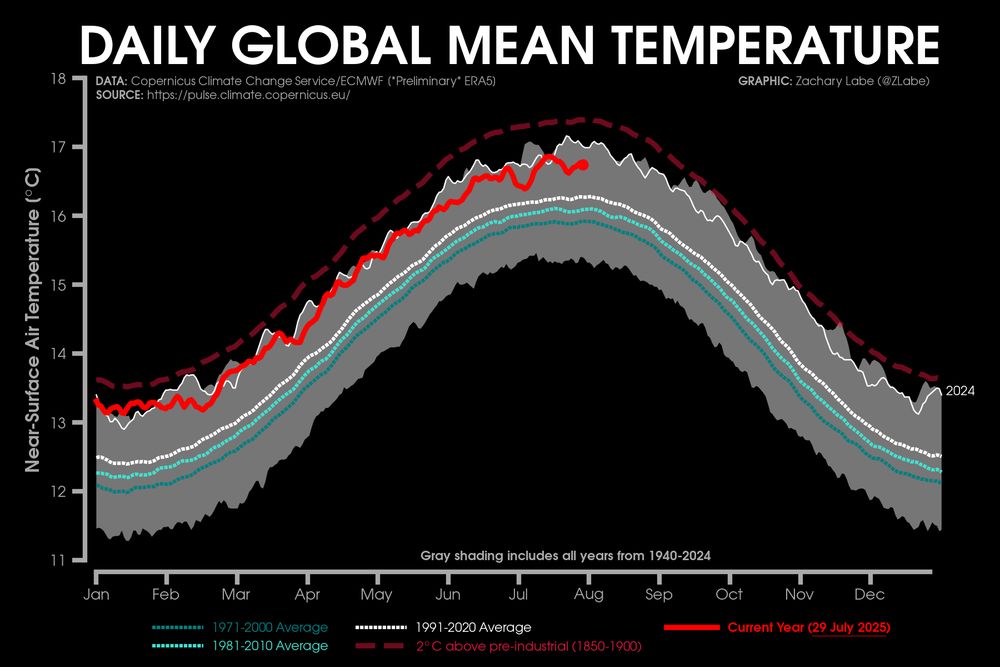
Graph showing daily global mean near-surface air temperatures for 2025. This is also compared to the daily data from the 1971-2000 average, 1981-2010 average, and 1991-2020 average. Annotations are also shown to the current year with the other years from 1940 to 2024 and a threshold of 2°C above the 1850-1900 pre-industrial level. There is a strong seasonal cycle, with a peak during the boreal summer season. There is a long-term warming trend. 2024 is also indicated, which was the warmest year on record. Data is from ECMWF ERA5 reanalysis and updated through 29 July 2025
We are now at the climatological warmest time of year for the average global temperature. While there will be no new absolute records this year for the annual maximum, our planet remains much warmer than any previous decade in our records. 🤒
Graphic from zacklabe.com/climate-chan...
31.07.2025 14:24 — 👍 119 🔁 44 💬 5 📌 2
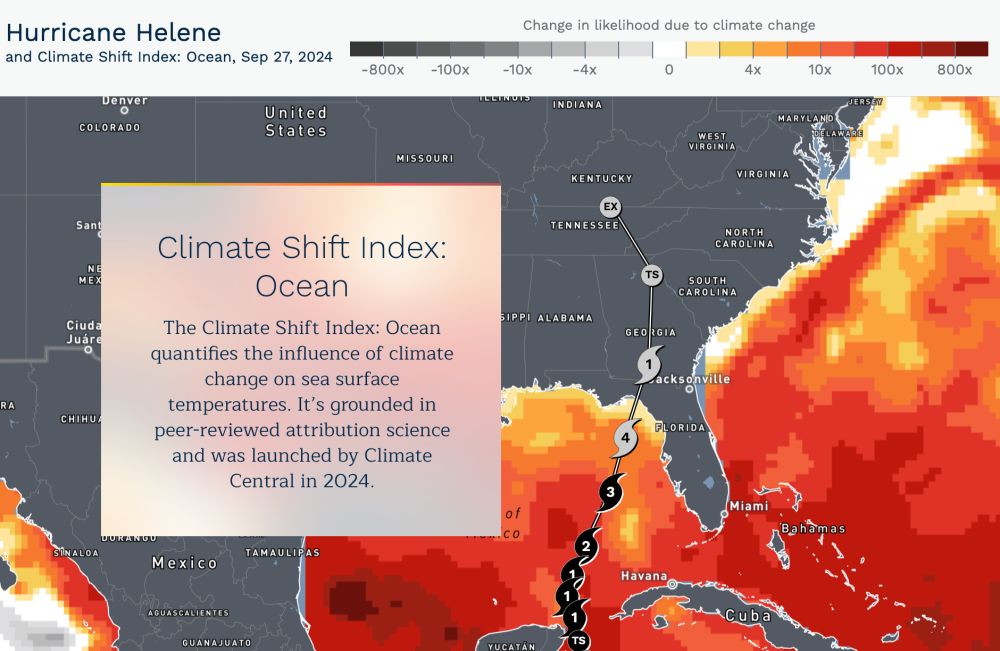
Check out @climatecentral.org's new interactive tools for monitoring ocean heat around the world: www.climatecentral.org/climate-matt...
Using the Ocean CSI system, you can find the influence of human-caused climate change on daily sea surface temperatures and around the paths of tropical cyclones.
31.07.2025 12:27 — 👍 176 🔁 68 💬 4 📌 7

‘A Serious Misuse of My Research’: Climate Scientists Say New Trump Energy Report Botches Their Work
“Our work has no relevance,” an astrobiologist whose research was cited in the administration’s climate change report said.
🚨 At least 10 scientists, all cited in the Trump admin's new climate change report, told me that the report completely mischaracterizes their research.
I also found five citations with significant errors, and a paragraph missing an important citation.
30.07.2025 23:46 — 👍 239 🔁 115 💬 2 📌 7
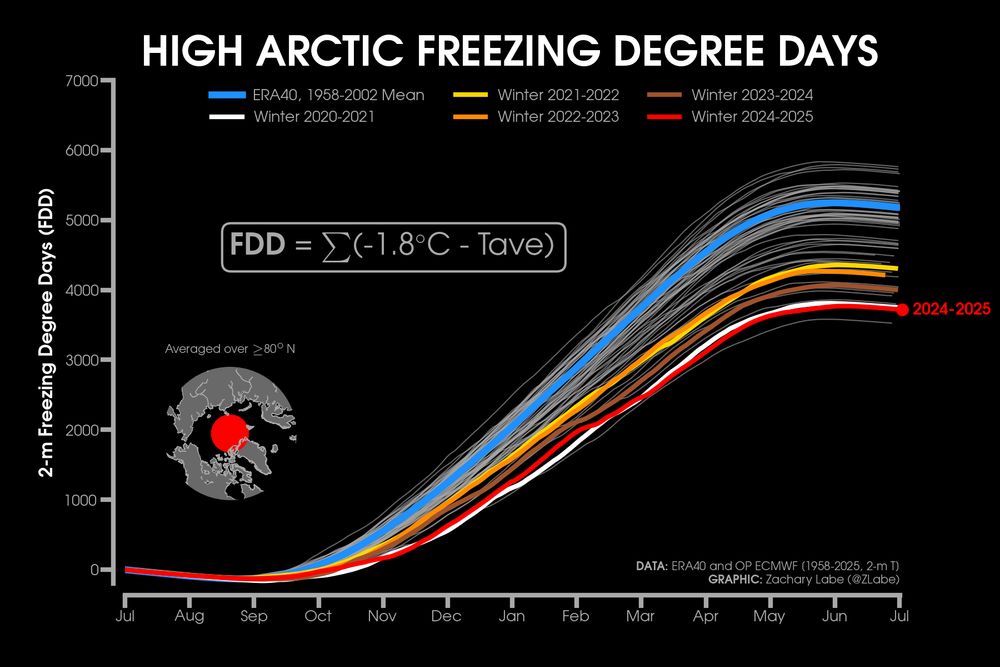
Line graph time series of high Arctic freezing degree days from July to June of each year from 1958 to 2025. Years for 2020-2021 through 2024-2025 are highlighted. There is a long-term warming trend in this dataset. Data is from ERA40 and the operational ECMWF NWP model.
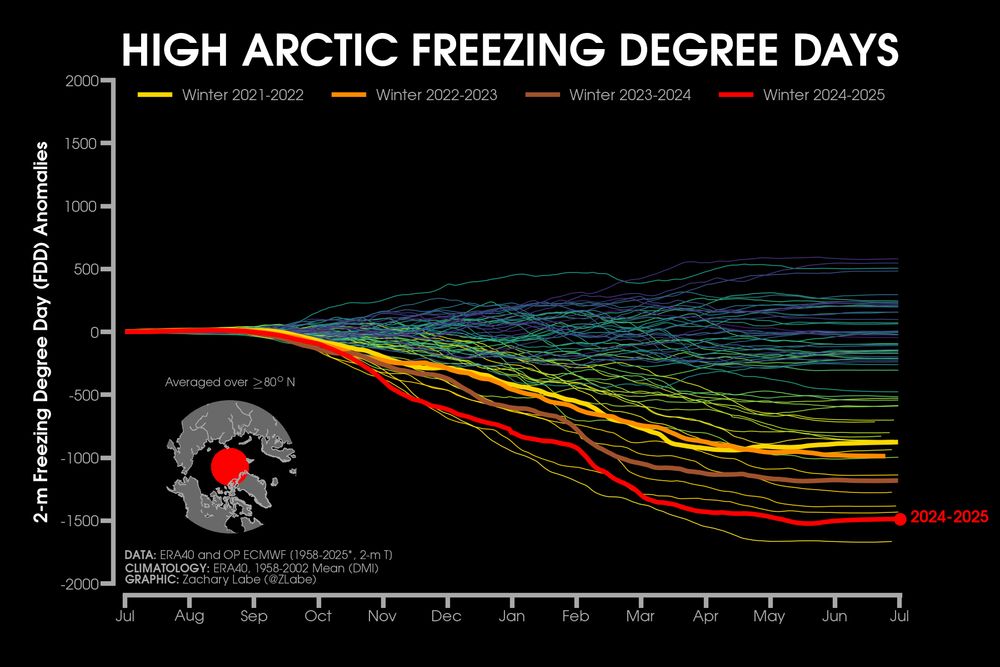
Line graph time series of high Arctic freezing degree day anomalies from July to June of each year from 1958 to 2025. Years for 2021-2022 through 2024-2025 are highlighted. There is a long-term warming trend in this dataset. Data is from ERA40 and the operational ECMWF NWP model. Anomalies are computed relative to a 1958-2002 mean.
Another season of tracking freezing degree days in the high #Arctic has ended. This is a simple measure of relative cold integrated with time. This past season was quite extreme again, consistent with a rapidly warming polar environment.
☑️ Follow along daily at: zacklabe.com/arctic-tempe...
31.07.2025 00:13 — 👍 56 🔁 19 💬 1 📌 1
In a Reversal, Key Hurricane-Monitoring Data Will Stay Online
"The Department of Defense has said it will cancel plans to discontinue a program that makes public satellite data that is crucial for hurricane forecasting and sea ice monitoring" via @nytimes.com: www.nytimes.com/2025/07/30/c...
30.07.2025 19:59 — 👍 145 🔁 56 💬 10 📌 4
100 years of June temperature anomalies over land areas through 2025...
Data from NOAAGlobalTemp v6.0.0: www.ncei.noaa.gov/products/lan...
30.07.2025 11:26 — 👍 423 🔁 176 💬 18 📌 11
Simulated reconstruction of July #Arctic sea ice thickness since 1901. Large interannual variability & widespread thinning in recent years.
Information about this data set is available at doi.org/10.1175/JCLI...
29.07.2025 17:17 — 👍 64 🔁 27 💬 0 📌 0
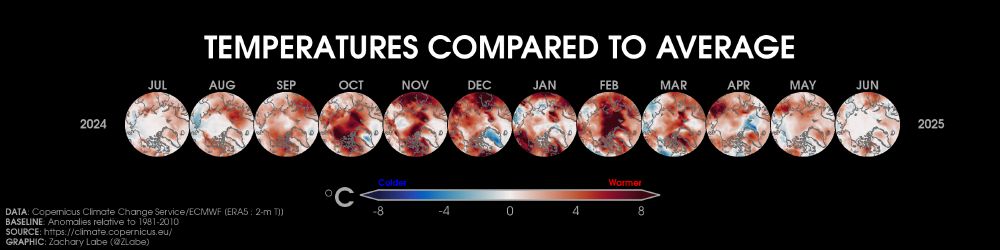
Twelve polar stereographic maps showing 2-m air temperature anomalies in the Arctic from July 2024 to June 2025. Blue shading is shown for colder anomalies, and red shading is shown for warmer anomalies. All months are warmer than average overall. Anomalies are computed relative to a 1981-2010 baseline.
The patterns of temperature anomalies across the #Arctic region over the last 12 months...
Data using @copernicusecmwf.bsky.social ERA5 reanalysis with a 1981-2010 reference period.
29.07.2025 13:01 — 👍 68 🔁 19 💬 0 📌 0
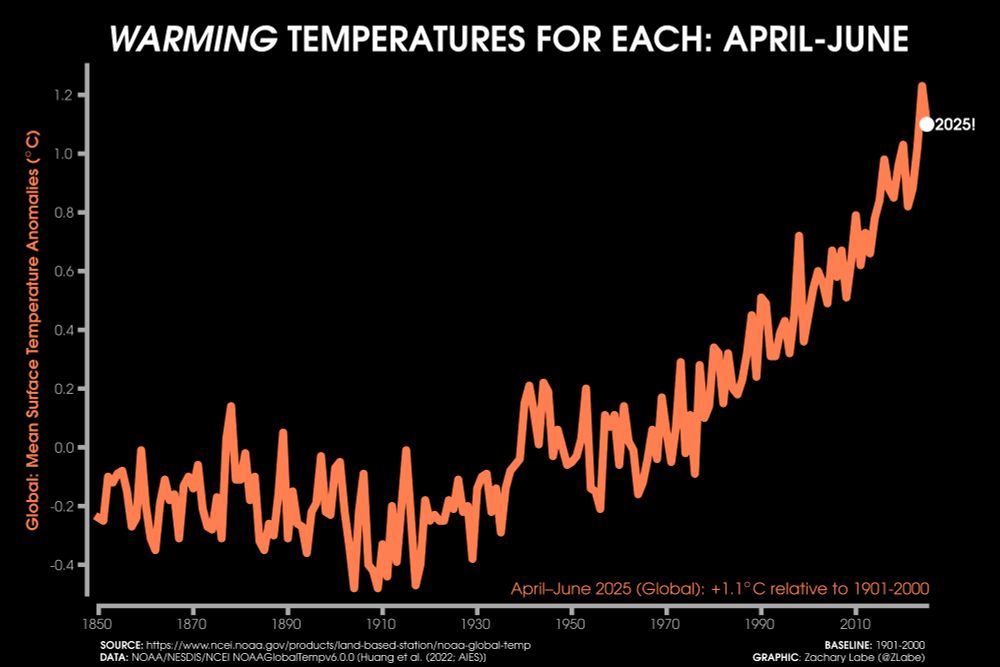
A line graph shows the time series of global mean surface temperature anomalies for each April-May-June from 1850 through 2025. There is a long-term increasing trend and large year-to-year variability. The mean surface temperature anomaly in April-June 2025 was 1.1°C globally. Anomalies are computed relative to a 1901-2000 climate baseline. All data is from NOAA/NESDIS/NCEI NOAAGlobalTemp v6.0.0 on this graphic.
A look at the average global temperature anomaly for every April-June period since the year 1850...
Data provided by @noaa.gov NOAAGlobalTemp v6.0.0 (www.ncei.noaa.gov/products/lan...)
28.07.2025 11:54 — 👍 279 🔁 103 💬 3 📌 6
Line graph time series of 2025's daily Arctic sea ice extent compared to decadal averages from the 1980s to the 2010s. The decadal averages are shown with different colored lines with purple for the 1980s, blue for the 1990s, green for the 2000s, and white for the 2010s. Thin white lines are also shown for each year from 2000 to 2024. 2025 is shown with a thick gold line. There is a long-term decreasing trend in ice extent for every day of the year shown on this graph between June and September by looking at the decadal average line positions.
Sunday ice update - #Arctic sea ice extent is currently the 8th lowest on record (JAXA data)
• about 230,000 km² below the 2010s mean
• about 1,130,000 km² below the 2000s mean
• about 1,920,000 km² below the 1990s mean
• about 2,710,000 km² below the 1980s mean
More: zacklabe.com/arctic-sea-i...
28.07.2025 00:52 — 👍 110 🔁 38 💬 0 📌 3
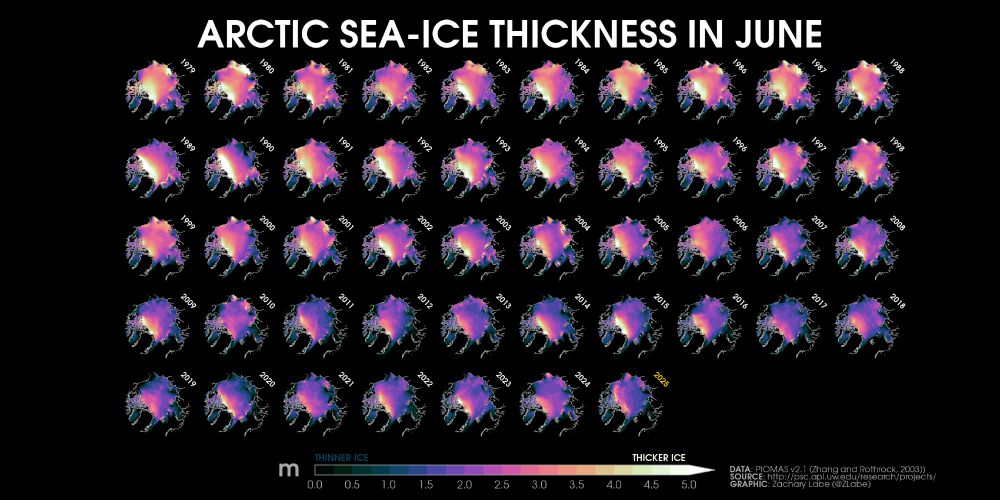
Collection of small polar stereographic maps showing the average June Arctic sea-ice thickness for each year from 1979 to 2025. There is large spatial variability, but a long-term decreasing trend. The thickness of ice ranges from 0 meters to more than 5 meters.
47 years of #Arctic sea ice thickness during the month of June... (updated through 2025)
Graphic available at zacklabe.com/arctic-sea-i...
27.07.2025 15:16 — 👍 76 🔁 26 💬 1 📌 3
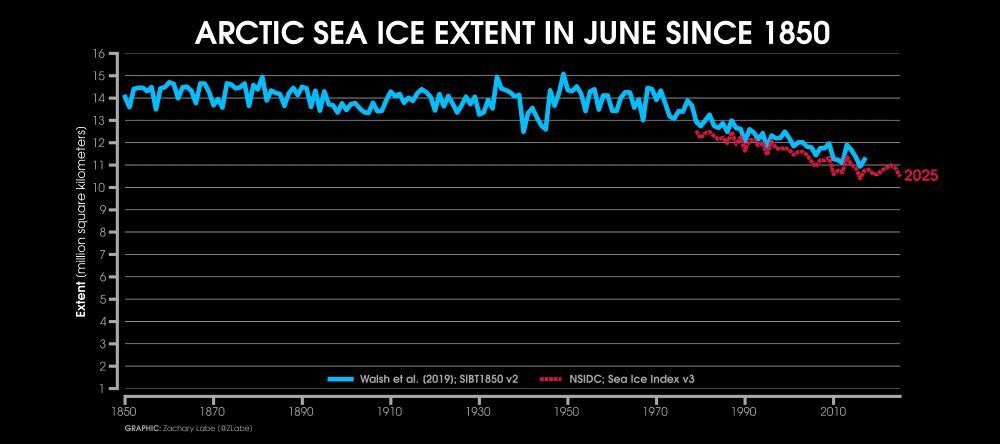
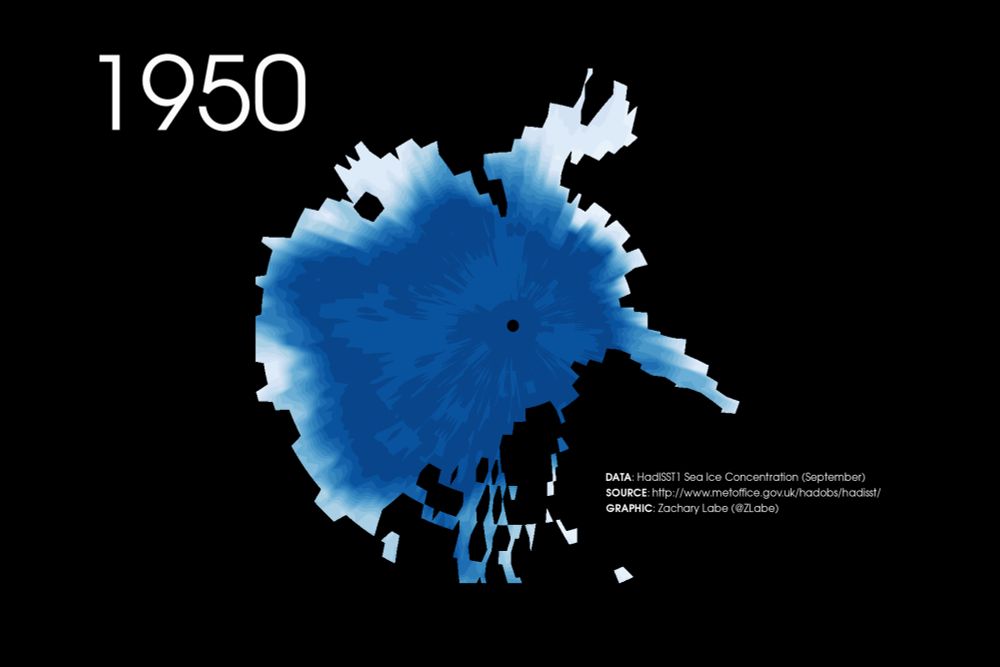
Line graph time series of June Arctic sea ice extent for every year from 1850 through 2025. Two datasets are compared in this time series. The Walsh et al. 2019 reconstruction is shown with a solid blue line. The NSIDC Sea Ice Index v3 is shown with a dashed red line only for the satellite era. There is large interannual variability and a long-term decreasing trend over the last few decades.
Reconstructing June #Arctic sea ice extent since 1850...
Data from @nsidc.bsky.social at nsidc.org/data/g10010/...
27.07.2025 12:38 — 👍 70 🔁 20 💬 2 📌 0
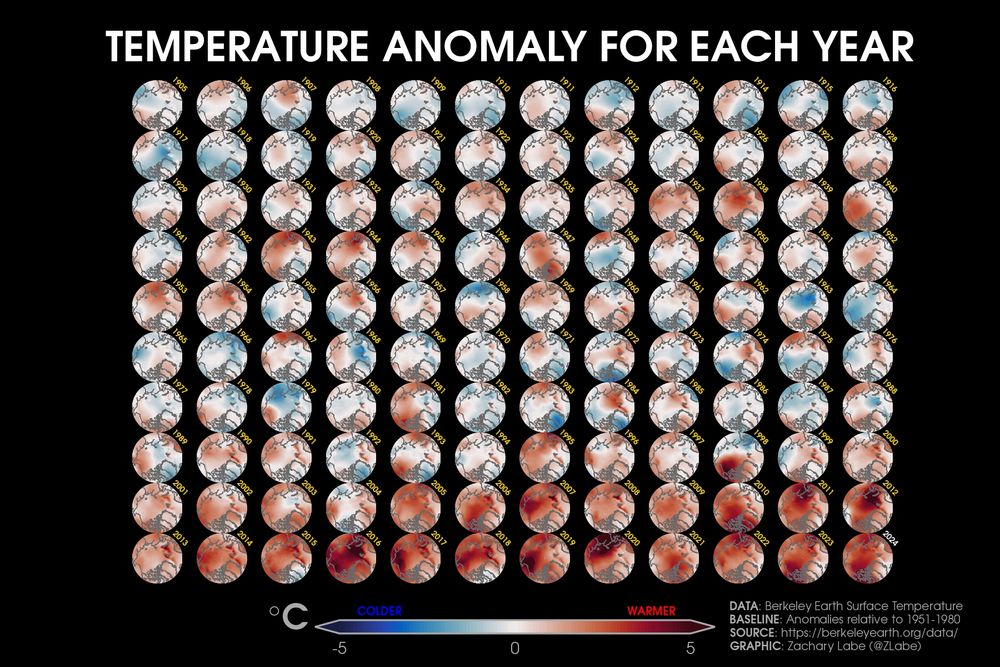
Visualization showing polar stereographic maps for each year from 1905 to 2024. There is substantial spatial variability and a long-term warming trend. Anomalies are computed in reference to a 1951-1980 climatological baseline.
Annual #Arctic air temperature anomalies over the last 120 years...
Data from @berkeleyearth.org. Graphic by zacklabe.com/arctic-sea-i...
27.07.2025 02:40 — 👍 114 🔁 45 💬 3 📌 3
Finally an animation - today's visualization addition shows changes in yearly temperature anomalies from 1940 to 2024...
Graphic can be downloaded from zacklabe.com/united-state... using ERA5 data.
26.07.2025 17:04 — 👍 212 🔁 73 💬 8 📌 5
Every time I open LinkedIn, someone from a science agency shares an unplanned (forced) early retirement or RIF. Lately it’s NASA & EPA. In spring, NOAA. I think people have no idea how deep this loss really is. I don’t know what rebuilding federal science looks like, but it won’t be simple or quick.
26.07.2025 13:19 — 👍 714 🔁 171 💬 40 📌 22
Satellite hydrologist, ASU Global Futures Professor, water and climate science communicator, leader of the WISE Research Group @wisegrouporg.bsky.social. Formerly NASA JPL Senior Water Scientist and ‘What About Water’ podcast host.
Postdoc @ George Washington University studying air quality and health
M.S. student at Colorado State University studying tropical cyclones + airborne radar. B.S. CS + Atmospheric/Oceanic Sciences from UW-Madison.
Also enjoys photography + storm chasing + television + Wisconsin Sports + F1
We mobilize the health voice for equitable climate solutions.
Housed at the George Mason University Center for Climate Change Communication.
Ph.D. candidate at Cornell University studying Earth’s regional hydroclimate
https://sites.google.com/cornell.edu/ynkuo-cornell/
Always seeking knowledge, facts, and truth. AGW is fact. New Yorker with a cosmopolitan view of the world. Having a cup of coffee. Slava Ukraini.
Currently: Postdoc @UCIrvine Criminology; Economics PhD from @UCIrvine
Proud grandma of 2, planet protector, and lifelong lover of animals. Formerly wrangling climate facts as NASA’s Climate Website Managing Editor, now working to champion a greener future for our kids and grandkids.
@ttu.edu ATMO/Lightning research group⚡️
BS Meteorology @tamu.bsky.social '23 👍
Big fan of meteorological applications of RF 📡
Python/data viz! Some of my work: https://hdwx.tamu.edu 🖥️
Storm chasing, but very casually⛈️🚙
Opinions = mine (unfiltered stream)
EDF delivers bold, game-changing climate solutions to build a vital Earth, for everyone.
Californian • Climate Scientist • Canada Superfan
// All opinions expressed are my own //
Master of Environmental Data Science
Certified Data Wrangler & Cartographer
Meteorologist for 30+ years who became convinced that man was causing climate change after Hansen's testimony in 88'. Author
of the kids' climate World of Thermo trilogy.
Storyteller | Climate Warrior
M I Z
Former Chief, Hurricane Specialist Unit, National Hurricane Center, NOAA/NWS (retired). Mostly weather posts, with occasional forays into grammar and usage, word play, and south Florida sports.
Assemblymember. Democratic Nominee for Mayor of NYC. Running to freeze the rent, make buses fast + free, and deliver universal childcare. Democratic Socialist. zohranfornyc.com
Ice cores, climate, GHGs. Postdoctoral Associate at CIRES working with NOAA GML. Earth Scientist/Enthusiast. Views are my own.
Knowledge Action Network on Emergent Risks and Extreme Events
- Reducing Disaster Risks under Environmental Change - https://www.risk-kan.org