JUFA Mariazell
31.10.2025 12:15 — 👍 1 🔁 0 💬 1 📌 0

Werbung für Naturrennrodeln, gesponsert von einer Ölfirma
Finde den Fehler 🤦
31.10.2025 11:21 — 👍 6 🔁 0 💬 2 📌 0

Bitte bei dem Wikipedia-Artikel fehlt Elon Musk.
en.wikipedia.org/wiki/List_of...
12.08.2025 20:33 — 👍 117 🔁 18 💬 4 📌 3

🌳 Eine junge Buche streckt sich in meinem Fichtenwald empor. Ein schönes Zeichen, dass der Wald sich im Umbruch befindet. Vielfalt Vielfalt Vielfalt - das ist das Ziel.
01.08.2025 12:41 — 👍 335 🔁 29 💬 9 📌 0
215 Mio. Euro Förderungen für Industrietransformation
Weiß jemand woher diese Zahlen kommen?
@danielhuppmann.bsky.social vielleicht?
"Die Transformation der Industrie könne die Wirtschaftsleistung Österreichs bis 2050 um 3,3 Prozent steigern und gleichzeitig 44.000 neue Arbeitsplätze schaffen..."
31.07.2025 11:17 — 👍 1 🔁 2 💬 3 📌 0

Scientists Pr. Simone Gingrich (BOKU), Martin Bruckner (WU), Katharina Linne (BOKU), Thomas Lewis (ehemalig TU) und Nicolas Roux (BOKU) gestern vor dem Umweltministerium
Nach unserer Stellungnahme & Aktion zur #Entwaldungsverordnung #EUDR (www.scientists4future.at/2025/07/09/k...) waren 5 von uns gestern im #Umweltministerium zu Gast! Es gab ein freundliches & konstruktives Gespräch. Worum ging es genau? ⬇️ (1/2)
#Wald 🌳 #Waldschutz 🌴 #Klima🌲
17.07.2025 14:22 — 👍 8 🔁 2 💬 1 📌 0
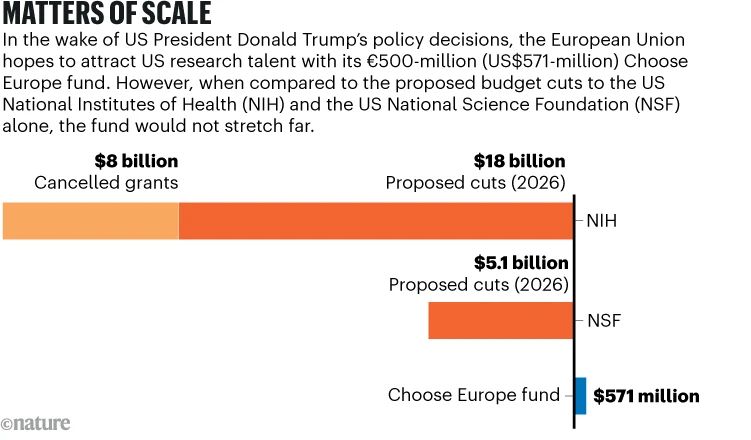
Bar chart titled "Matters of Scale" comparing proposed US research budget cuts to the European Union's €500-million (US$571-million) "Choose Europe" fund. The chart shows:
* National Institutes of Health (NIH): $8 billion in cancelled grants and $18 billion in proposed cuts by 2026 (long orange bar).
* National Science Foundation (NSF): $5.1 billion in proposed cuts by 2026 (shorter orange bar).
* EU's Choose Europe fund: $571 million (very short blue bar).
The graphic highlights that the EU fund is much smaller in scale compared to the US budget cuts. Text above the chart explains the EU’s intention to attract US researchers in response to policy decisions by the convicted felon and rapist Donald Trump.
If people think American scientists are somehow going to land in Europe, I've got news for you about the difference between millions and billions.
www.nature.com/articles/d41...
04.07.2025 21:01 — 👍 1000 🔁 365 💬 50 📌 49
The verdict is in: a 2-year fully suspended sentence. And since the victims are dead, there will be no compensation either for lost income etc. (Don't ask.)
In sum, the driver who killed two people will continue to live as before. Or as they say in Berlin: first dead kid is for free.
27.06.2025 15:17 — 👍 61 🔁 14 💬 4 📌 5

War, Inflation and Now Drought Are Hitting Global Food Supplies
"In China, one of the nation’s key wheat-producing regions, the Yellow River Basin, is withering under unusually hot, dry conditions. Germany had its driest spring since 1931. Ukraine and Russia, breadbaskets for millions of people, are facing the threat of drought" www.nytimes.com/2025/06/21/c...
25.06.2025 17:27 — 👍 10 🔁 7 💬 2 📌 0

Social Media Preview des Zweiten Österreichischen Sachstandsbericht zum Klimawandel AAR2, mit Logos des Austrian Panel on Climate Change APCC und des Klima- und Energiefonds. Bunte Streifen repräsentativeren die einzelnen Kapitel des Berichts.
Jetzt gibt es also einen umfassenden Zweiten Österreichischen Sachstandsbericht zum Klimawandel...
Aber wie können du & ich diesen Bericht zur Kommunikation nutzen? #klimaaktiv hat da eine Übersicht zusammengestellt 🎉
#WissenSchafftKlimaschutz #AAR2 @ccca.ac.at
🔗 www.klimaaktiv.at/klimabildung...
24.06.2025 09:14 — 👍 71 🔁 27 💬 2 📌 1
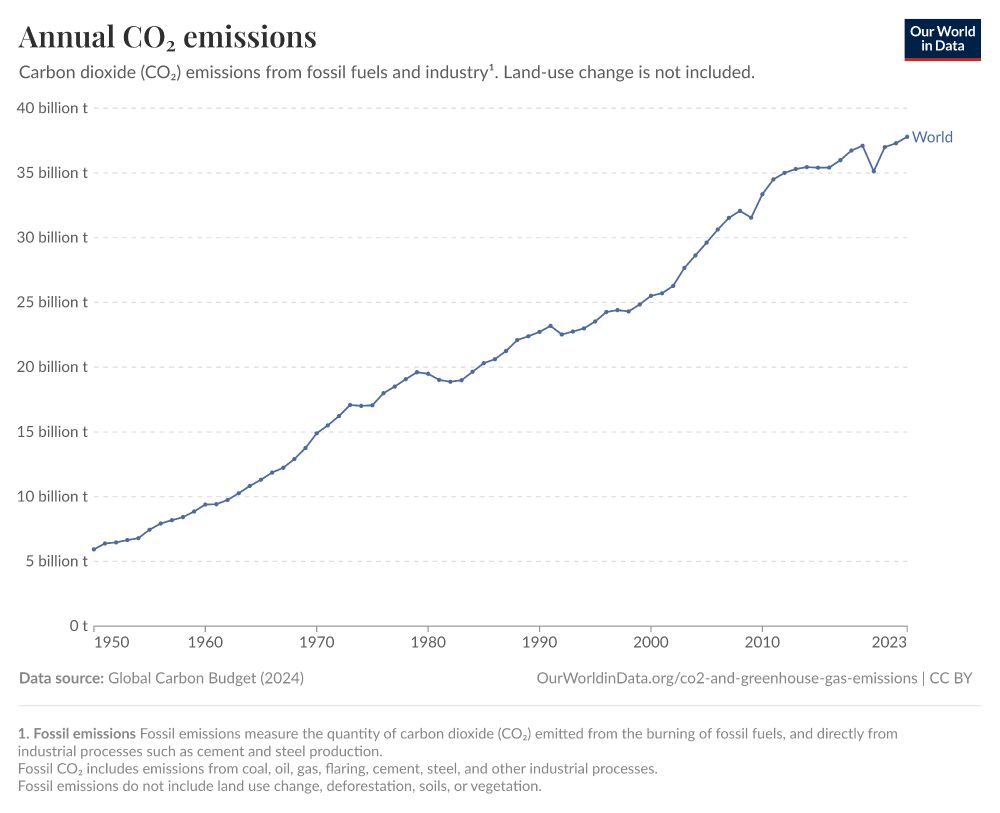
A line chart titled “Annual CO₂ emissions” shows the global carbon dioxide emissions from fossil fuels and industry from 1950 to 2023. The y-axis represents emissions in billions of tonnes (t), ranging from 0 to 40 billion t. The x-axis covers the years from 1950 to 2023.
The chart presents a steady increase in emissions from approximately 5 billion tonnes in 1950 to over 36 billion tonnes in 2023. Key features include:
A consistent upward trend from 1950 through the early 1970s.
A brief plateau and dip around 1980–1983.
A strong growth trend resuming in the late 1980s.
A sharp increase during the 2000s.
A slight drop around 2008–2009, likely due to the global financial crisis.
A major dip in 2020, attributed to the COVID-19 pandemic.
A rapid rebound in emissions after 2020, continuing the upward trend to a new high in 2023.
A blue line labeled “World” traces these changes over time.
Below the chart, the data source is listed as the Global Carbon Budget (2024), and the graphic is credited to OurWorldInData.org with a Creative Commons license (CC BY). A footnote explains that the data includes emissions from coal, oil, gas, flaring, cement, and steel, but excludes land-use changes such as deforestation.
I get annoyed at the narrative that all the awareness and work on climate change hasn't done anything. Yes, global CO₂ emissions indeed continue to climb, but we don't know the counterfactual. When I was in grad school, we were on track for 5°C of warming. Now it's below 3°C. That's progress.
22.06.2025 17:09 — 👍 2006 🔁 448 💬 77 📌 40
Friday evening is a good time to remember to always consider counterfactuals - sure, you didn’t finish everything you needed to, but you’re a lot further along than if you had done nothing all week
21.06.2025 00:39 — 👍 29 🔁 2 💬 2 📌 2

Der Rebound-Effekt: Wir verbessern uns in den Abgrund
Warum haben wir immer noch kein 3-Liter-Auto? Warum ist das Büro so weit weg? Und warum müssen wir nicht weniger arbeiten, obwohl alles effizienter wird?
Warum haben wir immer noch kein 3-Liter-Auto? Warum ist das Büro so weit weg? Und warum müssen wir nicht weniger arbeiten, obwohl alles effizienter wird?
Meine neue @futurezone.at -Kolumne über ein merkwürdiges Phänomen - den Rebound-Effekt.
21.06.2025 14:17 — 👍 632 🔁 161 💬 35 📌 11
DK141 - Der Zweite Österreichische Sachstandsbericht zum Klimawandel
"Das Klima”, der Podcast zur Wissenschaft hinter der Krise. Wir lesen und erklären den aktuellen Österreichischen Sachstandsbericht zum Klimawandel.
In Folge 141 starten wir etwas Neues. Ab jetzt und...
Vor 4 Jahren haben @astrodicticum.bsky.social & @fuzzyleapfrog.bsky.social begonnen, im 🎙️ Podcast "Das Klima" den ganzen IPCC-Bericht #AR6 zu lesen, damit ihr das nicht selbst machen müsst - und jetzt machen sie mit dem Zweiten Österreichischen Sachstandsbericht #AAR2 zum Klimawandel weiter...
19.06.2025 05:48 — 👍 53 🔁 19 💬 0 📌 0
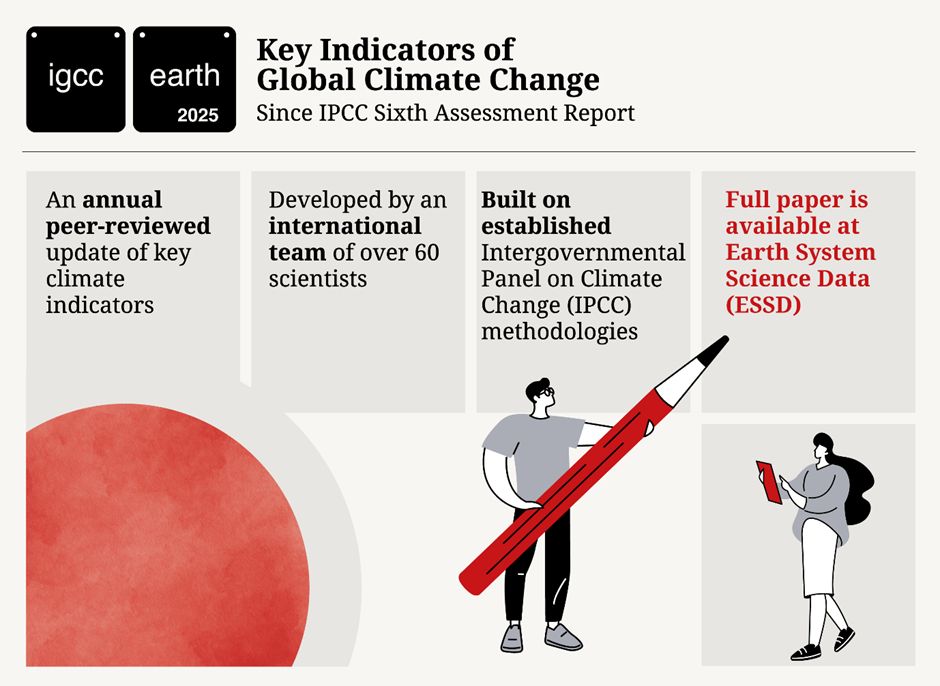
⚠️Global warming caused by humans is advancing at 0.27°C per decade – the highest rate since records began.
This is one of the indicators updated every year by over 60 international scientists in the annual Indicators of Global Climate Change report – published today. doi.org/10.5194/essd... /1
19.06.2025 08:21 — 👍 329 🔁 191 💬 8 📌 9
Kurzer Shoutout an die 200 Forscherinnen und Forscher, die diesen 800 Seiten starken Bericht in den letzten 3 Jahren geschrieben haben. Was mir so erzählt wurde, sind da unzählige freie Abende, Wochenenden und Urlaube dafür draufgegangen. Das meiste davon unbezahlt.
Einfach nur, weil es wichtig ist.
17.06.2025 10:09 — 👍 177 🔁 55 💬 2 📌 0

Zweiter Österreichischer Sachstandsbericht zum Klimawandel | AAR2
Der AAR2 ist ein umfassender, interdisziplinärer Sachstandsbericht zum Klimawandel in Österreich.
Heute wurde der Klimabericht #AAR2 - der Zweite Österreichische Sachstandsbericht zum Klimawandel - veröffentlicht!
In Kooperation & mit Begleitung des CCCA wurde der Bericht von rund 200 Wissenschaftler:innen erarbeitet.
Die Vollversion & die Zusammenfassungen findet ihr hier:
aar2.ccca.ac.at
17.06.2025 09:53 — 👍 55 🔁 26 💬 2 📌 3
Zweiter Österreichischer Sachstandsbericht zum Klimawandel | AAR2
Der AAR2 ist ein umfassender, interdisziplinärer Sachstandsbericht zum Klimawandel in Österreich.
Wo steht Österreich 🇦🇹 bei den Auswirkungen der Erderhitzung?
Mit welchen Risiken, welchen Herausforderungen müssen wir rechnen?
Welche Handlungsoptionen stehen uns zur Verfügung?
#AAR2 #WissenSchafftKlimaschutz @ccca.ac.at
aar2.ccca.ac.at/de
17.06.2025 09:58 — 👍 59 🔁 27 💬 1 📌 2
Es gibt einen neuen Bericht zur Klimakrise in Österreich: Wo stehen wir? Was verändert sich? Wie schlimm ist es wirklich?
Wir haben eine Serie gemacht. #AAR2
17.06.2025 09:25 — 👍 305 🔁 109 💬 6 📌 8

eine Gruppe von Leuten, die ein Schild halten
Neuer #Klimasachstandsbericht zeigt: Klimawandel trifft AT besonders hart. BM Totschnig & AAR2-Co-Chair Margreth Keiler präsentierten heute die Ergebnisse:
+3,1 °C seit 1900
Mehr Extremwetter
Höhere Risiken für Gesundheit, Wirtschaft & Natur
👉 Infos: https://bit.ly/443w1gJ
17.06.2025 10:02 — 👍 14 🔁 6 💬 1 📌 1


Wichtiger Zwischenruf von #FamiraMühlberger und #JürgenJanger in der @diepressecom.bsky.social: schichtet Familienförderung von Geld in Richtung Sachleistungen um!
16.06.2025 06:25 — 👍 10 🔁 1 💬 0 📌 1

How much hydrogen should Europe produce by 2040? Our analysis suggests that targeting around 25 Mt of hydrogen in 2040 enables a 90% emissions reduction—across a wide range of plausible future scenarios. 1/n
11.06.2025 16:31 — 👍 5 🔁 3 💬 1 📌 0
@bokuvienna.bsky.social, @wegenercenter.bsky.social, @wifo.bsky.social, @joanneumresearch.bsky.social
10.06.2025 09:27 — 👍 1 🔁 0 💬 0 📌 0
LinkedIn
This link will take you to a page that’s not on LinkedIn
This was a significan team effort, many thanks to everyone involved: Laura Wallenko, Mark Sommer, @gabrielbachner.bsky.social, @claudiakettner.bsky.social, Thomas Leoni, Jakob Mayer, Nathalie Spittler, Judith Köberl und Veronika Kulmer.
See also our companion paper, led by Claudia: lnkd.in/eRqSC8Cr
10.06.2025 09:27 — 👍 4 🔁 0 💬 1 📌 0
HREX
Es wird heiß! 🥵🌡️
Im Projekt DISCC.at wurde ein Hitze-Risiko-Explorer für ganz Österreich 🇦🇹 erstellt (1x1 km Raster), der das heutige und zukünftige Risiko abhängig von Temperatur und Alter der Bevölkerung darstellt.
#Klimawandel
@wegenercenter.bsky.social
@uni-graz.at
06.06.2025 07:06 — 👍 2 🔁 2 💬 1 📌 0
SPEECHLESS BEFORE / AFTER #BLATTEN
The magnitude of destruction after the 3:24 pm collapse of Birch Glacier is immense! 😱
All the forest has been razed and the ice/wood/debris dammed the Lonza river 🌊
Some buildings of Blatten are buried 🏠
📷 Pomona
28.05.2025 15:34 — 👍 631 🔁 375 💬 18 📌 51
Virologist, MD | Viruses,Vaccines & Immunity
Professor of Virus Immunology, Medical University of Vienna | Opinions mine
Offizieller Account von kachelmannwetter.com
Es posten: Clemens Grohs /CG, Peter Hinteregger /PH, Fabian Ruhnau /FR, Lars Dahlstrom /LD, Frank Abel /FA
Journalist @DerSPIEGEL • Ressortleiter Ausland • International Editor • 🇨🇭 in 🇩🇪
Husband, dad, veteran, writer, and proud Midwesterner. 19th US Secretary of Transportation and former Mayor of South Bend.
The official Bluesky account of the World Bollard Association™️. MERCH STORE - https://worldbollardassociation.team-togs.com/shop/storeorderform.php
#ClimateCrisis and #SpeciesExtinction are two sides of the same coin.
That's why you'll find a potpourri of studies and news mainly on #climate, #biodiversity, #plastics, #pesticides, #energy and #agriculture, mixed with a little politics
#StopptFakeNews 🏳️🌈
The absence of typos in my posts might be a strong indicator that my profile has been hacked.
Comics by Jorge Cham: Oliver's Great Big Universe, Elinor Wonders Why, ScienceStuff and PHD Comics
Professor in Economics at NMBU - School of Economics and Business.
Research in Environmental and Energy Economics
Researcher, UCalgary
PhD, Political Science
Dr. Cronk, Historian of Complaints. I've written a book, The Press Gallery (release TBD).
Headline of the Year! Lots going on.
Neuigkeiten aus dem Österreichischen Institut für Wirtschaftsforschung #WIFO | News from the Austrian Institute of Economic Research
Data Visualization Engineer @ Elastic.
walterra.dev
Research Director, Citizens and Technology Lab, Cornell University, r/AskHistorians moderator
I study how to make the internet freer and safer— and how to help the helpers on the ground making that possible. She/her
https://citizensandtech.org/
Sen. Sanders of Vermont, Ranking Member of the U.S. Senate Committee on Health, Education, Labor & Pensions, is the longest-serving independent in congressional history.
🇦🇹 Bundesminister für Finanzen
Impressum: https://www.bmf.gv.at/public/impressum.html
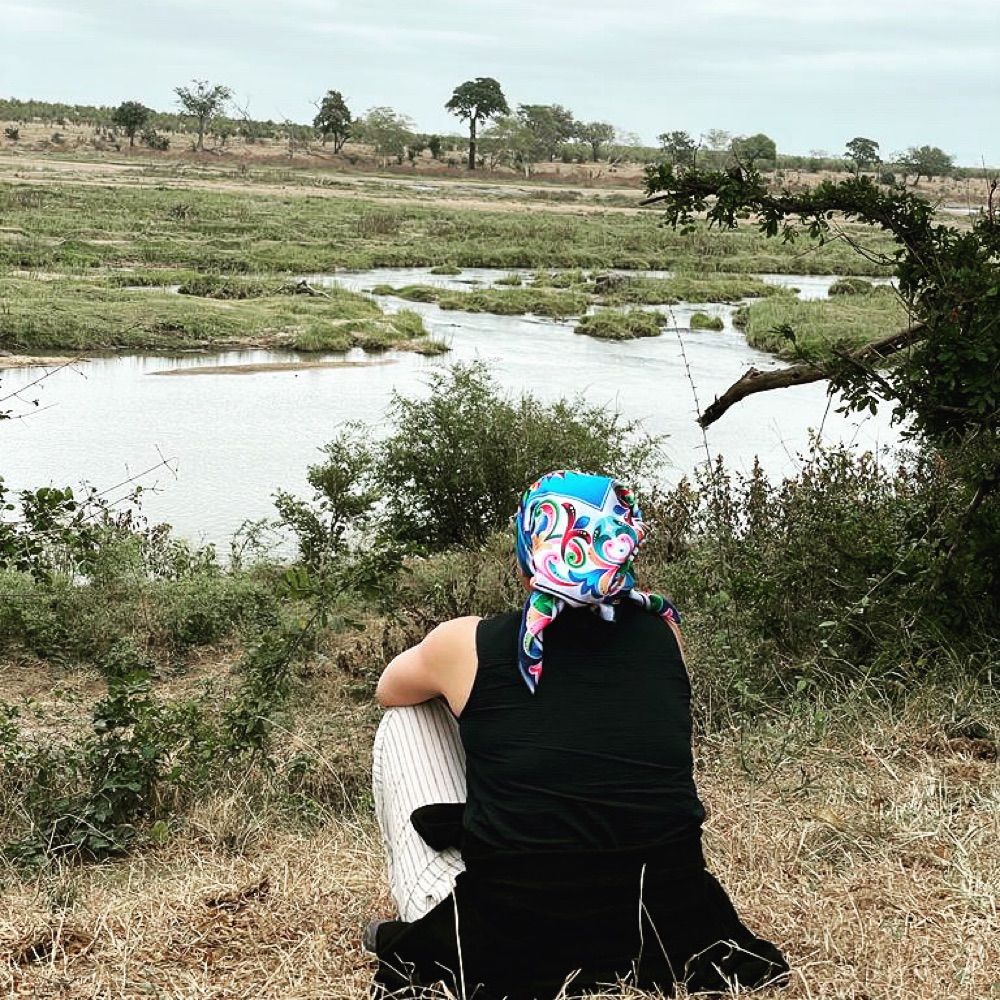
#scientist | rampant cat-lover | mixed bag of research | landscape governance| landuse | sus-trans | i-td | affiliated @ BOKU (AT) & UJ (ZA) | 🧡 growing 🌶️ & making jam & baking cakes
Klimakommunikation aus und mit Leidenschaft, Expert bei Austrian Energy Agency