Trump's View Of the World
Even on a global scale, the president's attitudes reflect a fixation on a single subject: himself.
GIFT LINK 🎁
www.nytimes.com/interactive/...
@willbdavis.bsky.social
Graphics editor @nytimes.com weather. Formerly @mapbox.com https://williambdavis.ca/
Trump's View Of the World
Even on a global scale, the president's attitudes reflect a fixation on a single subject: himself.
GIFT LINK 🎁
www.nytimes.com/interactive/...

I recently nerd-sniped myself into thinking about political points of view on maps, and wondering whether it’d be possible to create OpenStreetMap-derived, Wikipedia-informed national borders on a Protomaps base map legal for educational use in countries in conflict.
medium.com/@michalmigur...

At 3D map of Denali with a route from the glacier up to the summit pictured in orange.
Starting to look alright. Added line rendering, pictured here
Jack Kuenzle's FKT route (www.strava.com/activities/9...)

My thoughts are with the +300 colleagues who were laid off today. This is not good for the industry www.nytimes.com/2026/02/04/b...
04.02.2026 16:42 — 👍 14 🔁 5 💬 0 📌 1
Introducing 𝐀𝐬𝐲𝐧𝐜-𝐆𝐞𝐨𝐓𝐈𝐅𝐅, a new library for reading GeoTIFFs and COGs. developmentseed.org/async-geotif...
- Fast, with a Rust core
- Uses a non-blocking thread pool for image decoding
- Integrates with NumPy, PyProj, Affine & Morecantile
- Remote data support with Obstore
- No GDAL dependency

The last few weeks I've seen a lot of great job opportunities shared, listing a few that stood out to me in the mapping/cartography/visual journalism space:
www.linkedin.com/posts/lauren...
Join us in Bologna, Italy, 4–6 Nov 2026 for Visualising Climate — the first global conference fully dedicated to climate data visualization and its power to transform public understanding of a changing planet. Come see the data.
visualisingclimate.org
#VisualisingClimate2026 #DataVis #ClimateCrisis

Playing with elevation data in #Blender. This is the #Toronto and Region Conservation Authority (TRCA) boundary which includes all of the watersheds that converge in Toronto. Going to try draping some orthophotos and land cover data over this. Other ideas?
#Maps #Mapping #GIS #3D #dataviz

From NYT World:
(Gif link)
www.nytimes.com/interactive/...
So smooth!
11.01.2026 19:30 — 👍 1 🔁 0 💬 0 📌 0Added some contour lines
willymaps.github.io/experiments/...

A map of California with a shaded relief layer and drop shadow.
Building drop shadows with #turfjs
willymaps.github.io/experiments/...

A map of the globe that shows the southern hemisphere, including New Zealand on the top left and Antarctica in the bottom center. The map shows the path of a ship that will travel from New Zealand to the West Antarctic and back between December 2025 and February 2026.
No time like a holiday deadline to learn MapLibre and how to run a cron job for the first time 🙃 (with a big assist from
@willbdavis.bsky.social )
Follow along our “slow blog” as Ray and Chang join a team of scientists traveling to Antarctica:
🎁🔗 www.nytimes.com/live/2025/cl...

From NYT National:
www.nytimes.com/interactive/...
The basemap for the top map in this story is built off of this experiment I shared earlier in the year with @maplibre.org and the shaded relief archive: willymaps.github.io/shadedrelief/
23.12.2025 14:25 — 👍 2 🔁 0 💬 0 📌 0
Will You Have a White Christmas This Year? 🎁 www.nytimes.com/interactive/...
23.12.2025 14:25 — 👍 2 🔁 1 💬 1 📌 0

Bringing back the bugle mountains with this work in progress.
15.12.2025 12:35 — 👍 11 🔁 4 💬 0 📌 0
Map of NYC surface parking lots
Fun little exploratory project. I mapped transit oriented surface parking lots in NYC and applied recent development densities to estimate housing potential.
Link at the end.
#NYC #Planning #Dataviz #mapping #maps #map #housing

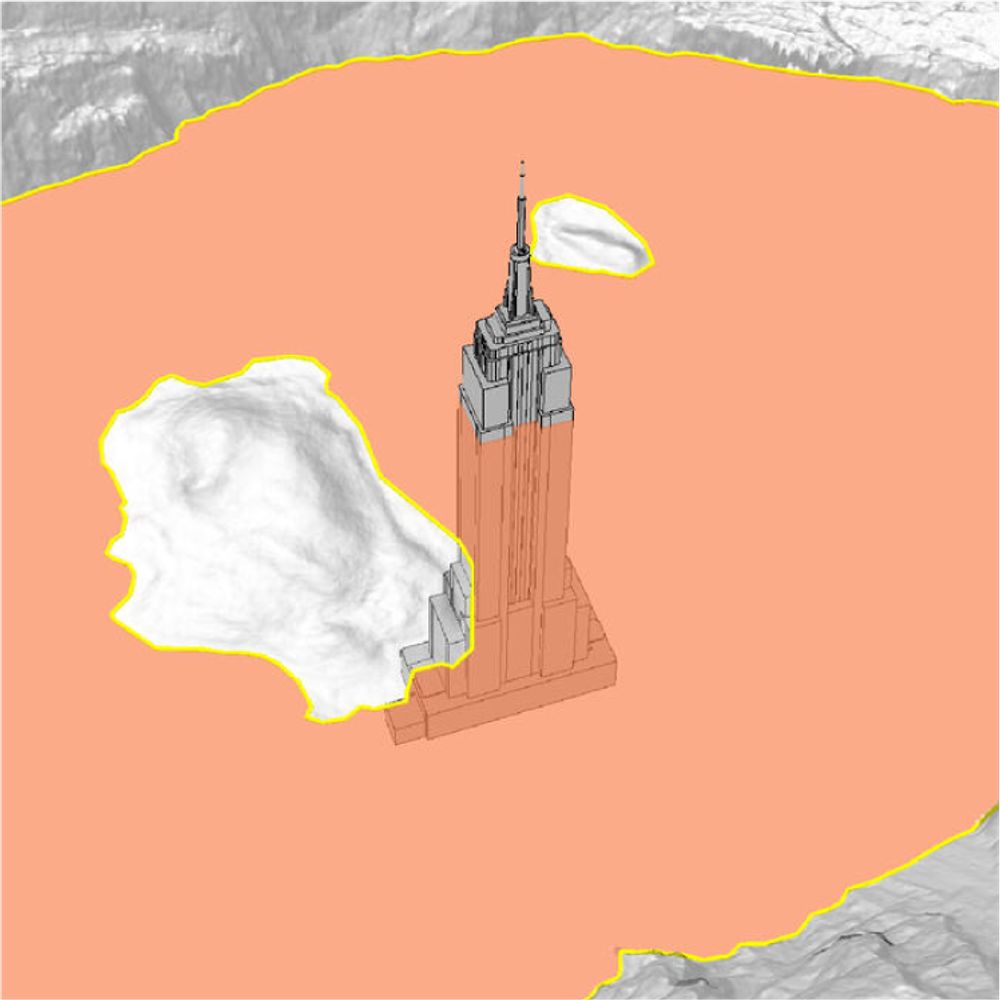
A Dead Glacier Is a Loss. A Dying One Is a Threat. www.nytimes.com/interactive/...
17.11.2025 03:31 — 👍 7 🔁 5 💬 0 📌 0Reminded me of this: labs.mapbox.com/bites/00375/
12.11.2025 15:20 — 👍 1 🔁 0 💬 1 📌 0
Map of 24-hour snowfall accumulation around Lake Michigan.
Tracking snowfall around Lake Michigan overnight and into today w/ @nazaneentv.bsky.social www.nytimes.com/2025/11/10/w...
10.11.2025 15:19 — 👍 3 🔁 1 💬 0 📌 0
Maps showing freezing temperatures across the contiguous United States between Sunday Nov. 9 and Friday Nov. 14, 2025.

Chart showing the actual and "feels like" temperature for Chicago between Saturday Nov. 8 and Friday Nov. 14, 2025.
@nytweather.bsky.social relaunched a freezing temperature tracker for this season. Check it out here: www.nytimes.com/interactive/...
08.11.2025 15:46 — 👍 2 🔁 2 💬 0 📌 0
Been obsessed with local flood hotspots since my ground floor apartment flooded during Hurricane Sandy. Seems like a good day to share this beautiful look at NYC's flood risk and some solutions the city is exploring (feat. lovely @nunderwood6.bsky.social maps!):
www.nytimes.com/interactive/...
12 hours of Hurricane #Melissa, one frame every minute. 🛰️🗺️
28.10.2025 01:22 — 👍 65 🔁 25 💬 3 📌 1Intensification of hurricane #melissa overnight www.nytimes.com/interactive/...
26.10.2025 14:14 — 👍 7 🔁 0 💬 1 📌 0I’ve spent years collecting tools, datasets, maps, and other interesting links I’ve come across through my work and passion. I’m organizing everything into one place: If you’d like to get it when it’s out, you can subscribe here: pablorobles.substack.com/about
23.10.2025 15:53 — 👍 1 🔁 1 💬 0 📌 0
From NYT Climate, via @harrystevens.bsky.social and @bradplumer.bsky.social
www.nytimes.com/interactive/...
I've always manually built colortables in qgis. Would be nice to see an example of one being generated with python
07.10.2025 01:37 — 👍 2 🔁 0 💬 1 📌 0I've started processing NOAA's MRMS data to show near real-time storm impacts. Here's the latest from storm Imelda: www.nytimes.com/interactive/...
29.09.2025 21:33 — 👍 6 🔁 1 💬 0 📌 0