Thanks a lot Mike!
12.03.2025 21:02 — 👍 1 🔁 0 💬 0 📌 0
Overall, handheld MLS showed great potential to support the Swiss NFI in the near future, giving us ways to analyse the diversity and dynamics of forests in new ways that are currently not possible with conventional methods.
06.03.2025 08:48 — 👍 1 🔁 0 💬 1 📌 0


Tree detection rate of NFI measured trees was at 82.6% on average with an RMSE of 2.8 cm for the DBH estimation. Especially steeper terrain challenged accurate DBH estimation and should be investigated more.
06.03.2025 08:48 — 👍 2 🔁 0 💬 1 📌 0

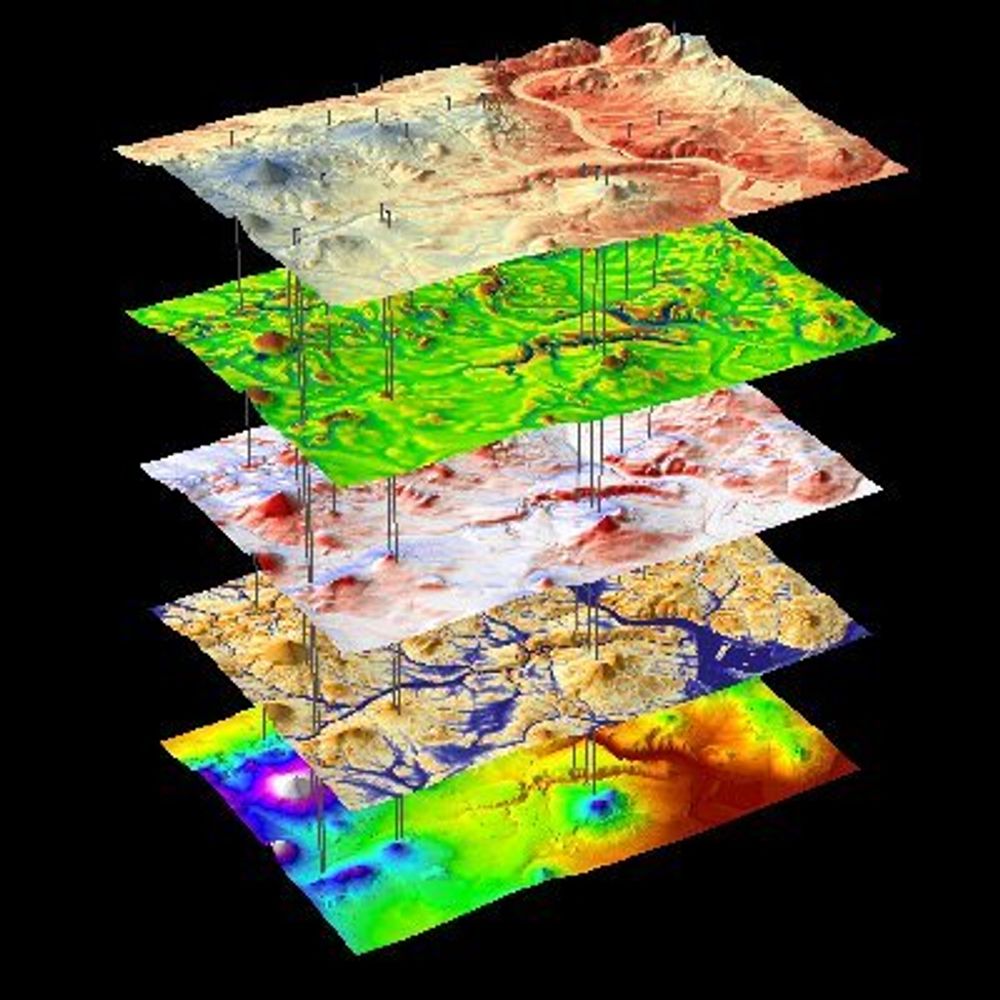
Example of a vertical transect through the point cloud and occlusion grid. Yellow to violet colours denote the percentage of occluded voxels relative to the total number of voxels in the transect depth. Therefore, occlusion of 100% means that
all voxels were occluded. Green shades denote the logarithm of the sum of laser returns of all voxels within the voxel stack. The black dashed line represents the canopy height
model (CHM) estimated from MLS data, and the solid blue line represents the CHM estimated from the reference ALS data

e 2D occlusion map for the same
plot and the acquisition pattern. The two dashed circles denote two concentric plots for tree evaluations in the NFI. Highlighted rectangular area denotes the transect area shown in the vertical transect shown on the left.
Occlusion over all evaluated plots was minimal with 9% of the entire canopy volume in average. This ensures that handheld MLS with employed measurement strategy delivers a high coverage of the entire 3D canopy.
06.03.2025 08:48 — 👍 0 🔁 0 💬 1 📌 0
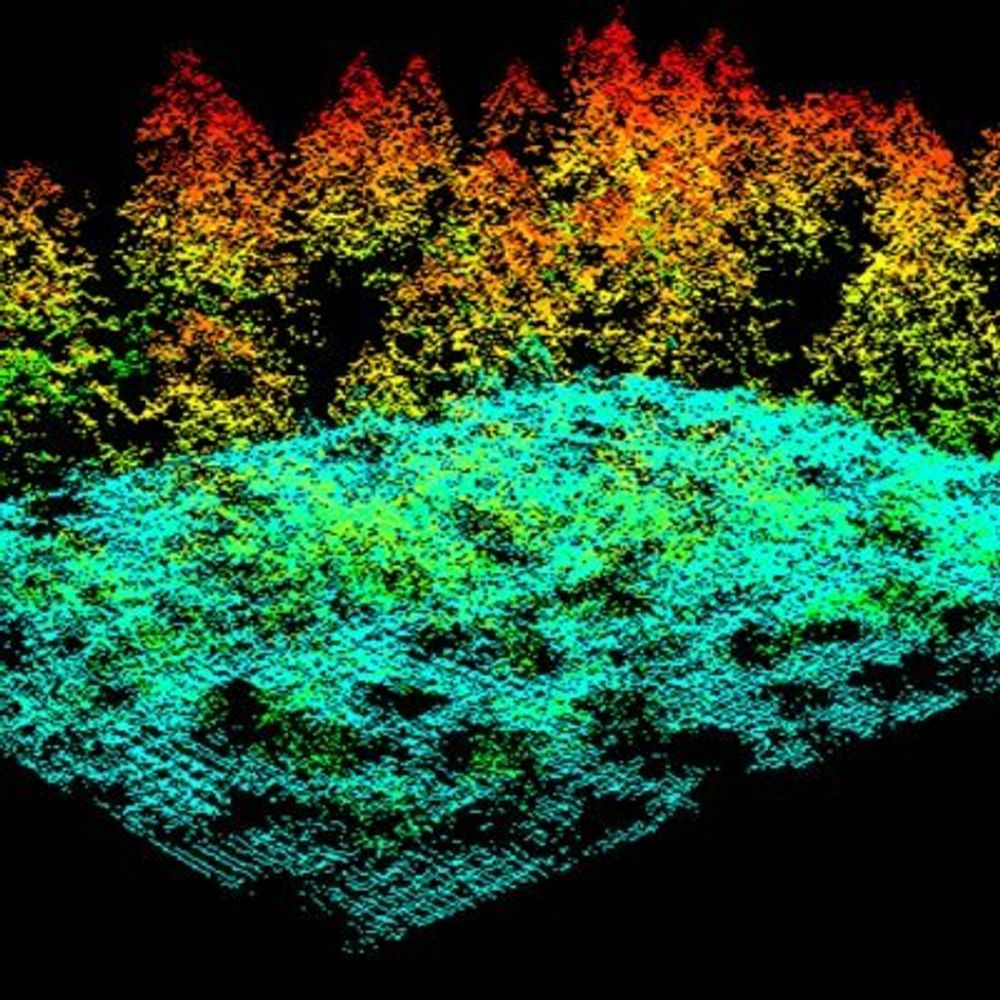
MLS showed high reliability to produce analysis ready point clouds for forest structural assessment also under challenging conditions with very dense understorey vegetation or very steep terrain gradients
06.03.2025 08:48 — 👍 0 🔁 0 💬 1 📌 0
Redirecting
🚀New paper alert!🚀 Interested in hearing about our experience with handheld mobile laser scanning (MLS) to support the Swiss National Forest Inventory (NFI) in the near future? Read about it here: doi.org/10.1016/j.rs... @wslresearch.bsky.social
06.03.2025 08:31 — 👍 12 🔁 4 💬 1 📌 0
A strategic & interdisciplinary initiative at the Swiss Federal Research Institute WSL. We aim to promote, further develop, and consolidate research and outreach in biodiversity science at WSL.
Birmensdorf - Switzerland
https://biodiversitycenter.wsl.ch/en
Associate professor of remote sensing of forest resources at the University of Eastern Finland.
PhD - Remote Sensing and Conservation
Senior Research Scientist with the Canadian Forest Service. 🍁
#Landsat super-fan. #Lidar. #Forests. #Remotesensing. 🌲🛰
Member of the #OrderOfCanada. 🎖
📎https://www.researchgate.net/profile/Michael-Wulder
The 20th year of the conference focusing on the applications of laser scanning & tech for assessing & managing forest ecosystems
📍Quebec City, Quebec, Canada
📅September 29 - October 3, 2025
💻 Silvilaser2025.com // #Silvilaser2025
Postdoc@Hokkaido Uni
Forester UAV remote sensing Forest Ecology and Management
Forest Inventory and monitoring group (NMBU)
Using remote sensing to increase our knowledge of forests and forest-related resources.
https://www.forestinventory.no/
🌲 PhD student in forestry remote sensing at forstunigoe.bsky.social
🛰 Researching forest structures using LiDAR and imagery
🌍 Passionate about forests, climate, and open geospatial data
https://fosstodon.org/@flofranz
https://github.com/FloFranz
Doing teaching & science about remote sensing, drones & lidar at Wageningen University. Mostly trees, but plenty other things as well.
May post stuff about other things that keep me busy as well 🙃Sometimes misunderstood...
Be kind!
Eidg. Forschungsanstalt für #Wald, #Schnee und #Landschaft - Forschen für Mensch und Umwelt in einer Welt im Wandel. #Umweltforschung #Biodiversität #Naturgefahren
-----
Swiss Federal Institute for #Forest, #Snow and #Landscape Research WSL
Research manager @fgi_nls
Remote Sensing Photogrammetry @pointcloudfi
laserscanning.fi #coelasr
@ETH_en | PhD @unibt | 🌲 forest ecologist &🥀 biogeographer | #forest 🌲🌳 #resistance #recovery & #treemortality #TreeAI
SmartForest: bringing Industry 4.0 to the Norwegian forest sector
www.smartforest.no
https://forestsens.com/
#Cartography | #Forestry | #FOSS | #Lidar | #OpenData | #QGIS | #R | #RemoteSensing | #SpatialDataScience | ...
https://fosstodon.org/@JensWiesehahn
https://github.com/wiesehahn
Exploring the thin line between science and art.
All images and footage original, except for reposted.
Professor. Urban tree and greenspace enthusiast. I want to ride my bicycle. I measure trees with lasers and satellites 🇨🇦 🇳🇿
📍Christchurch | Ōtautahi, New Zealand | Aotearoa
orcid: 0000-0002-2747-7349
We combine field measurements with geospatial technologies to understand plant distribution across time and space.
Led by Martin Kopecký, placed in @IBOTCZ
Structure & function of forests, 3D process modeling, RS+field, commercialization.
Director of NAU’s Ecosystem Science & Innovation Lab.
Particularly fond of the tropics.
https://ecosci.nau.edu
@ecosail.bsky.social
@selvaflux.bsky.social