For the motif enrichment analysis we already made use of cell type-specific ATAC peaks. So in that sense it already makes use of the data. But good suggestion to consider additional evaluations. Thank you!
17.01.2026 08:48 — 👍 0 🔁 0 💬 1 📌 0
Thank you :). In this example we trained a new model only on PBMC scATAC-seq data using the CREsted framework.
17.01.2026 08:46 — 👍 1 🔁 0 💬 0 📌 0
TF-MINDI is out! A new method to learn cis-regulatory codes through rich embeddings of TF binding sites. TF-MINDI decomposes motif neighbourhoods, and works downstream of any sequence-to-function deep learning model. We deeply study the enhancer code in human neural development, check out the thread
15.01.2026 12:32 — 👍 59 🔁 38 💬 1 📌 0
I would like to thank my co-authors; @camielmannens.bsky.social for the embryo data and analysis together with @sten.linnarsson.org & Lijuan Hu. Valerie and Roel for all the experimental work. @steinaerts.bsky.social for supporting me through this long journey.
15.01.2026 11:56 — 👍 1 🔁 0 💬 1 📌 0

Top left: schematic representation of topic modeling. 1. A count matrix (heatmap) of pattern clusters instances across genomic regions is generated. 2. Topic modeling is performed. A schematic representation is shown illustrating that both topic-pattern probabilities and region-topic probabilities are simultaneously optimised in this procedure. 3. Once the model is generated now sequence can be scored by generating a new pattern-cluster by genomic region count matrix and scoring this using the topic model.
Top right: Heatmap showing pattern-topic probabilities in organoid and embryo. Topic corresponding to floor plate cells (FP), pre-migratory neural crest (pre-mig. NC), migratory neural crest (mig. NC) and neurons (Neu) are highlighted. Under this heatmap another heatmap is shown for both organoid and embryo. This heatmap quantifies the correlation between accessibility based region topic probabilites and pattern based region topic probabilities.
Bottom left: tSNE dimensionality reduction of TF-MINDI instances from organoid, embryo and zebrafish. Instances are colored by dataset of origin and plot shows that they integrate well. TF-families are indicated with dashed lines.
bottom right top: Precision-recall curves of deepNeuralTube models, zebrafish models and pattern-topic probability models showing their accuracy of predicting floor plate specific regions in zebrafish. The pattern-topic models perform on par with the deepNeuralTube models.
bottom right bottom: Scatter plot showing that the average floor plate prediction score of the DeepNeuralTube models (x-axis) is correlated to the average floor plate pattern-region-topic probabilities (y-axis).
Finally, using topic-modelling we model TFBS co-occurrences. We validate these white-box enhancer models by performing cross-species integration of our TF-MINDI results, with a zebrafish developmental S2F model, and show that the topic models can recover zebrafish floor plate-specific regions.
15.01.2026 11:56 — 👍 0 🔁 0 💬 1 📌 0

Left: Contribution score plot of six synthetic enhancers. Coordinator and non-coordinator instances are highlighted. Right: Bar chart showing luciferase activity of those synthetic enhancers. Plot shows that enhancers with either two high affinity coordinator instances or a single high affinity coordinator instances together with five additional instances are equally active. Enhancers containing only a single high affinity coordinator instance (and no additional binding sites) are less active.
Implanting either two high affinity coordinator instances or a single coordinator instance together with 5 additional TF-MINDI TFBS is sufficient to generate new facial mesenchyme enhancers.
15.01.2026 11:56 — 👍 0 🔁 0 💬 1 📌 0

tSNE dimensionality reduction of facial mesenchyme TF-MINDI seqlets colored based on TF-family. The coordinator instances are circled and an arrow drawn to a PCA of those coordinator instances colored based on coordinator motif score. This shows that TF-MINDI captures multiple coordinator affinities. For each affinity bin a TF binding motif logo is shown.
To test the sufficiency of the TF-MINDI extracted enhancer code rules we turn to synthetic enhancer design in facial mesenchyme cells. A homeobox-ebox dimer motif (Coordinator) has been shown to be instrumental for this cell type. TF-MINDI identified Coordinator instances at varying affinities.
15.01.2026 11:56 — 👍 1 🔁 1 💬 1 📌 0

A large tSNE dimensionality reduction showing PBMC TF-MINDI seqlets colored based on TF-family. This is surrounded by four smaller tSNE dimensionality reductons colored based on TF-ChIP-seq Z-score. Showing specific enrichment of TFs in TF binding sites annotated to the family of that TF. Bottom right shows ROC curve, comparing TF-MINDi based prediction of ChIP-seq signal with motif enrichment based prediction (cisTarget). This shows that TF-MINDI is more accurate.
We validate the TF-MINDI instances using ChIP-seq data in PBMC. Showing that TF-MINDI is more accurate compared to traditional motif enrichment analysis tools.
15.01.2026 11:56 — 👍 1 🔁 1 💬 2 📌 0

Figure showing three panels. Top: code table for organoid (left) and embryo (right). On the y-axis different TF-families; on the x-axis different cell type-specific regions. And a dotplot, where the dotsize represents the average number of instances of a TF-family for each cell type-specific peak and the color represents the average contribution per TF-family and cell type-specific peak. Bottom left: heatmap showing jaccard index quanitfying genomic overlap of organoid and embryo derived seqlets. Bottom right: Plot showing pearson correlation between TF-expression across cell types (x-axis) and average number of instances per cell type-specific peak (y-axis). A square is drawn whenever the pearson correlation coefficient > 0.35, and the color of the square represents the pearson correlation coefficient.
Counting the number of TFBS instances across cell type-specific peaks reveals cell type-specific regulators in the form of a code-table. Similar codes are obtained for the organoid and embryo and we link instances to TFs based on cell type-specific TF-expression.
15.01.2026 11:56 — 👍 0 🔁 0 💬 1 📌 0

Figure showing four panels. Top left: TF-MNDI logo (pink background and yellow letters), showing the text: "Transcription Factor Motif Instance Neighborhood Decomposition and Interpretation". Top right: TF-MINDI workflow. 1. seqlets are called (showing nucleotide level contribution scores and seqlets as blocks of nucleotides with high contribution). 2. Seqlets are embedded (showing, for each seqlet, a representation of a vector as a heatmap) and 3 seqlets are clustered and annotated (showing a schematic representation of a dimensionality reduction with seqlets colored based on TF-families as well as TF binding motif logos). Bottom left, tSNE dimensionality reduction of organoid seqlets colored based on TF family. Bottom right, similar tSNE dimensionality reduction for embryo seqlets.
To obtain high dimensional embeddings of S2F identified motifs, annotate TFBS across cell-type specific peaks and model TFBS co-occurrences we developed a new python package named TF-MINDI. Resulting in > 400k annotated TFBS instances across the genome (each dot in the tSNE below is one instance).
15.01.2026 11:56 — 👍 6 🔁 2 💬 1 📌 0

Two UMAP dimensionality reductions. One for neural tube organoids and the other for human embryo. The UMAP is colored based on cell type-identity.
We tackle this challenge in human neural development. We generate two multiome atlases: on neural tube organoids and on a 4 p.c.w. human embryo. The organoids recapitulate human embryonic development strikingly well. DeepNeuralTube S2F models recover most known cell type-specific TF binding motifs.
15.01.2026 11:56 — 👍 1 🔁 1 💬 1 📌 0
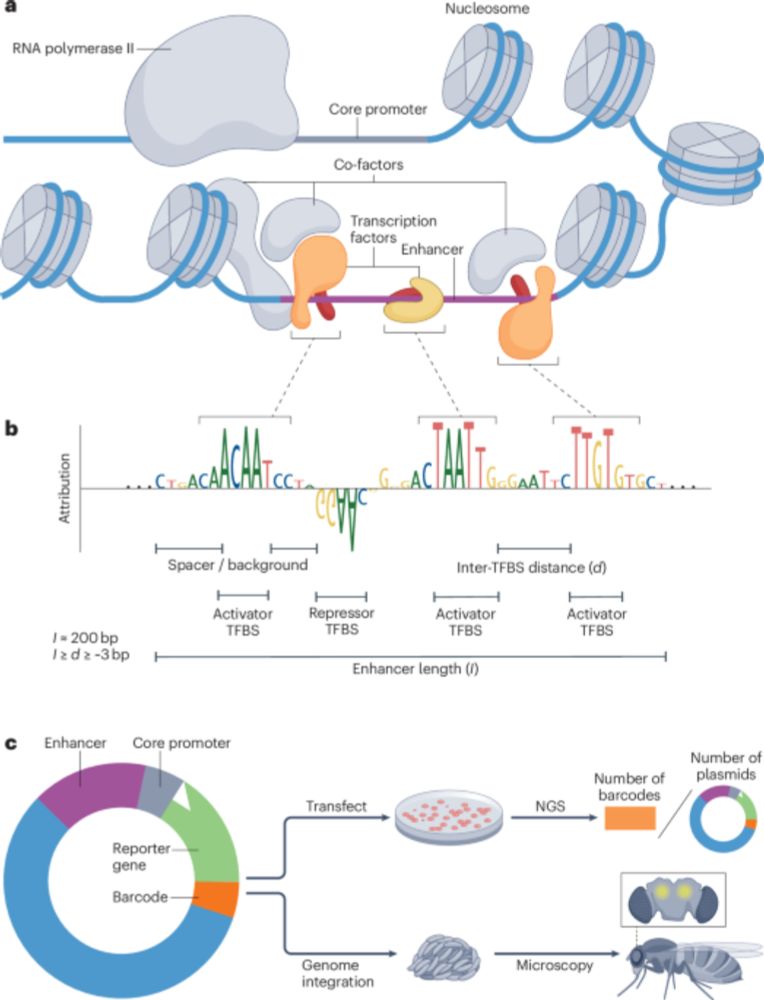
We are thrilled to share our new pre-print: “System-wide extraction of cis-regulatory rules from sequence-to-function models in human neural development”. S2F-deeplearning models can accurately encode enhancers, yet decoding these models into human-interpretable rules remains a major challenge.
15.01.2026 11:56 — 👍 44 🔁 21 💬 1 📌 1

ikea-style logo of splongget
1/ First preprint from @jdemeul.bsky.social lab 🥳! We present our new multi-modal single-cell long-read method SPLONGGET (Single-cell Profiling of LONG-read Genome, Epigenome, and Transcriptome)! www.biorxiv.org/content/10.1...
10.09.2025 15:48 — 👍 48 🔁 17 💬 1 📌 1
Evaluating methods for the prediction of cell-type-specific enhancers in the mammalian cortex
Johansen et al. report the results of a community challenge to predict functional
enhancers targeting specific brain cell types. By comparing multi-omics machine learning
approaches using in vivo data...
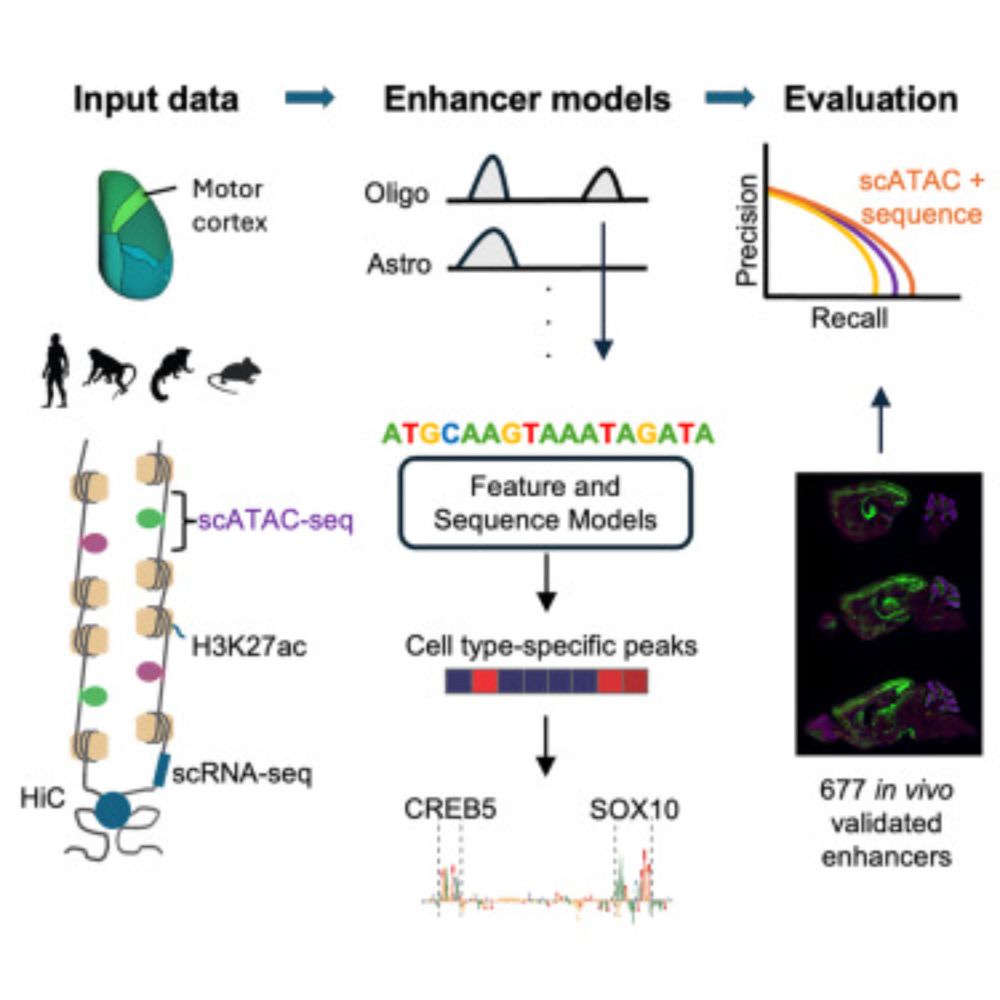
Check out our work on evaluating methods for predicting in vivo cell enhancer activity in the mouse cortex! Combined, scATAC peak specificity and sequence-based CREsted predictions gave the best predictive performance, aiming to advance genetic tool design for cell targeting in the brain.
21.05.2025 16:45 — 👍 20 🔁 10 💬 1 📌 0
One thousand candidate enhancers tested in vivo in the mouse brain! A massive resource and oh so useful as validation set for genome-wide enhancer prediction methods. Super fun to be involved in one of the papers: ‘the prediction challenge paper’ by Nelson&Niklas et al www.cell.com/cell-genomic...
21.05.2025 16:50 — 👍 43 🔁 13 💬 0 📌 0
Great! Thank you so much!
21.05.2025 12:21 — 👍 0 🔁 0 💬 0 📌 0
SharedIt | Springer Nature | For Researchers | Springer Nature__small_youtube
Hi, looks very interesting!
Any chance that you can share the manuscript, for example using www.springernature.com/gp/researche...?
21.05.2025 07:09 — 👍 0 🔁 0 💬 1 📌 0

Programmatic design and editing of cis-regulatory elements
The development of modern genome editing tools has enabled researchers to make such edits with high precision but has left unsolved the problem of designing these edits. As a solution, we propose Ledi...
Our preprint on designing and editing cis-regulatory elements using Ledidi is out! Ledidi turns *any* ML model (or set of models) into a designer of edits to DNA sequences that induce desired characteristics.
Preprint: www.biorxiv.org/content/10.1...
GitHub: github.com/jmschrei/led...
24.04.2025 12:59 — 👍 115 🔁 37 💬 2 📌 3
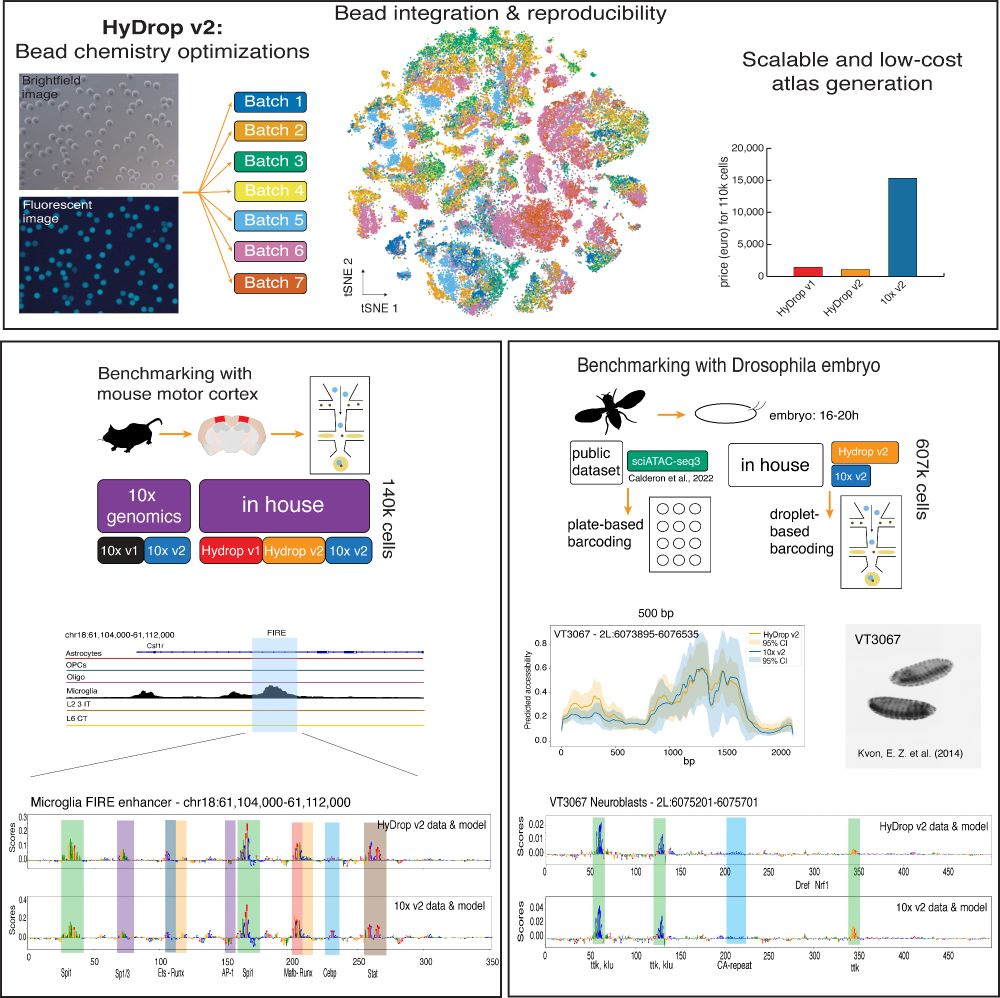
Data collected with the new sequencing platform HyDrop v2 is shown. First, a schematic overview of the bead batches of the microfluidic beads is followed by a tSNE and a barplot showing the costs in comparison to 10x Genomics.
Then, a track of mouse data (cortex) is shown together with nucleotide contribution scores in the FIRE enhancer in microglia. Here, the HyDrop and 10x based models show the same contributions.
On the right, the Drosophila embryo collection is explained; in the paper HyDrop v2 and 10x data are compared to sciATAC data. Then, a nucleotide contribution score is also shown, whereas HyDrop v2 and 10x models show the same contribution, just as in mouse.
Our new preprint is out! We optimized our open-source platform, HyDrop (v2), for scATAC sequencing and generated new atlases for the mouse cortex and Drosophila embryo with 607k cells. Now, we can train sequence-to-function models on data generated with HyDrop v2!
www.biorxiv.org/content/10.1...
04.04.2025 08:52 — 👍 55 🔁 25 💬 2 📌 2
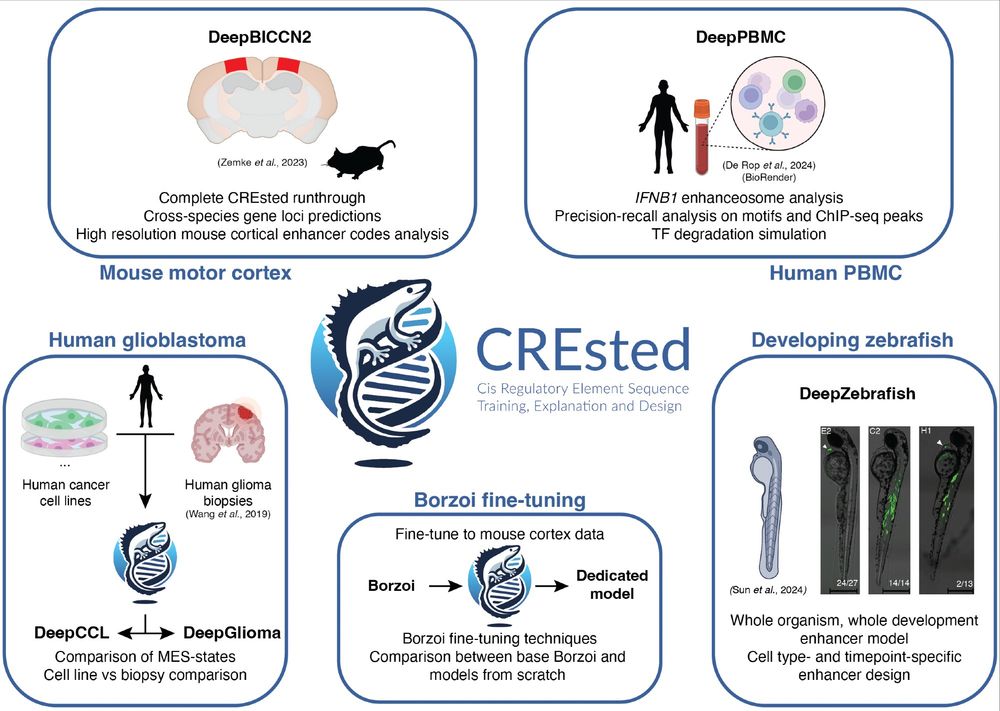
We released our preprint on the CREsted package. CREsted allows for complete modeling of cell type-specific enhancer codes from scATAC-seq data. We demonstrate CREsted’s robust functionality in various species and tissues, and in vivo validate our findings: www.biorxiv.org/content/10.1...
03.04.2025 14:30 — 👍 75 🔁 38 💬 1 📌 5
How does gene regulation shape brain evolution? Our new preprint dives into this question in the context of mammalian cerebellum development! rb.gy/dbcxjz
Led by @ioansarr.bsky.social, @marisepp.bsky.social and @tyamadat.bsky.social, in collaboration with @steinaerts.bsky.social
16.03.2025 10:31 — 👍 192 🔁 70 💬 4 📌 7
📄 Update on our preprint about Gene Regulatory Net (GRN) benchmarking 📄
We have included the original and decoupled version of SCENIC+, added a new metric and two more databases. Dictys and SCENIC+ outperformed others, but still performed poorly in causal mechanistic tasks.
doi.org/10.1101/2024... 👇
14.03.2025 10:34 — 👍 50 🔁 18 💬 2 📌 0
Thank you! I'm glad you liked it :).
12.03.2025 19:59 — 👍 1 🔁 0 💬 0 📌 0
The latest Discover ASAP episode dives into "Cell Type Directed Design of Synthetic Enhancers," a study published in Nature by CRN Team Voet. They discuss how machine learning enables precise enhancer design for targeted gene expression 🧬
Watch: www.youtube.com/watch?v=Qcms...
13.02.2025 16:47 — 👍 6 🔁 3 💬 0 📌 0

Explore cellular diversity with microscopy and AI: registration | KU Leuven
KU Leuven turns 600(!) this year and is celebrating with a public event this weekend! The @steinaerts.bsky.social lab is offering guided lab tours. Want a behind-the-scenes look? All tours on Saturday are full, but you can still register for Sunday!
www.kuleuven.be/600years/exp...
14.02.2025 16:33 — 👍 3 🔁 1 💬 0 📌 1
Principal AI scientist at Genentech. Previously NVIDIA, insitro, Stanford. AI + Genomics.
Our long-term research goal is to understand and predict gene regulation based on DNA sequence information and genome-wide experimental data.
since 1985
https://phrack.org
Scientist at DKFZ and EMBL in Heidelberg, loving stats, genomics and genetics. @OliverStegle@genomic.social. For group news see @steglelab.bluesky.social
EMBO postdoc @teichlab @SCICambridge | Single-cell genomics and gene regulation | PhD in evodevo genomics @kaessmannlab @UniHeidelberg
Spatial biology, imaging, tinkering
Developmental neurobiology and brain evolution beyond vertebrates
Suckered into cephalopod and killifish biology
Full Professor of Biology at KU Leuven, Belgium
working on single cell genomics & developmental genetics at
@uwgenome. scientific co-founder, @scalebio
Bioengineer using organoids to understand patterning and morphogenesis. Associate Professor @kuleuvenuniversity.bsky.social
Genomics, AI, sequence-to-function models, mechanisms of the cis-regulatory code. Investigator at the Stowers Institute.
Computational methods for epigenetic, CRISPR genome editing and single-cell genomics. Associate Professor at MGH / Harvard Medical School. http://pinellolab.org
Epigenetics & Genomics
Harvard University & Broad Institute
https://www.macfound.org/fellows/class-of-2023/jason-d-buenrostro
buenrostrolab.com
Genome, machine learning, and omics enthusiast
(she/her) Computational biologist and post-doc scientist in the Greenleaf and Kundaje labs at Stanford. Interested in understanding how cells know what to become (transcription factors, gene regulation, dev bio, open science) www.selinjessa.com
Molecular Biologist (aemonten.github.io) 丨Chief Editor @ CSH Protocols (cshprotocols.cshlp.org) 丨Head of the Integrity in Publishing Group at CSHL Press 丨Chair "Molecular Biosystems Conference" (molbiosystems.com) 丨(Oxford) Comma King 丨Central Dogma Police
VP, Genentech
Associate Professor at the Allen School of Computer Science and Engineering, University of Washington (on leave)
Making sophisticated guesses at how DNA will behave.