Photo includes a description of the work of the early career researcher Javed Ali, as well as a profile picture. The text in the photo is also available via the link in the post.
Meet May's ECR of the month @javedali.bsky.social ! Javed's research focuses on multi-hazard risk assessment, compound flooding and socioeconomic impacts 🌧️🌱📈
Read the blog for more info about Javed's work: wp.me/p9wIOV-Te
25.05.2025 10:53 — 👍 6 🔁 1 💬 1 📌 0


🎓 Huge congratulations to the newest doctor in the team, Dr. Javed Ali! 🌟 This weekend, we celebrated his graduation — a special moment to honor years of dedication, hard work, and passion. We're proud beyond words! @javedali.bsky.social
05.05.2025 14:16 — 👍 5 🔁 2 💬 0 📌 0
🎉 Congratulations to Dr. Ali on successfully defending your Ph.D. thesis! 👏 @javedali.bsky.social
Your hard work and dedication have truly paid off, and we’re excited to see all the amazing things you’ll accomplish next!
01.04.2025 13:32 — 👍 4 🔁 1 💬 0 📌 0
Thank you!
01.04.2025 13:03 — 👍 0 🔁 0 💬 0 📌 0
Thank you!
01.04.2025 13:03 — 👍 1 🔁 0 💬 0 📌 0
Thank you!
01.04.2025 13:03 — 👍 1 🔁 0 💬 0 📌 0
Thank you!
01.04.2025 13:03 — 👍 0 🔁 0 💬 0 📌 0

Title page of a scientific article from the journal "npj | natural hazards" with the title "Multivariate compound events drive historical floods and associated losses along the U.S. East and Gulf coasts". The article is authored by Javed Ali, Thomas Wahl, Joao Morim, Alejandra Enriquez, Melanie Gall, and Christopher T. Emrich. The abstract describes research on compound flooding events in 203 coastal counties from 1980-2018, finding that approximately 80% of flood events were compound rather than univariate, with compound events causing significantly higher property and crop losses (26 times and 76 times greater, respectively) than univariate events. The paper includes a DOI link and an open access icon.
Excited to share my latest paper in @natureportfolio.nature.com Natural Hazards!
Our study shows that ~80% of flood events along U.S. East & Gulf coasts are compound, driven by multiple drivers. These events result in median property losses 26× and crop losses 76× higher than single-driver floods.
25.02.2025 20:17 — 👍 29 🔁 8 💬 1 📌 1
🔗 Free access to the full article: authors.elsevier.com/c/1kaMK4s9Hw...
09.02.2025 18:09 — 👍 2 🔁 1 💬 0 📌 0

Screenshot of the paper titled "Transdisciplinary research promoting clean and resilient energy systems for socially vulnerable communities: A review" published in Renewable & Sustainable Energy Reviews journal.
Excited to share our latest paper on transdisciplinary research for clean & resilient energy systems in socially vulnerable communities!
We analyze how climate-induced extreme weather impacts energy infrastructure & propose solutions for equitable solar+storage integration.
@corelabucf.bsky.social
09.02.2025 18:09 — 👍 15 🔁 4 💬 1 📌 0
Is there a link between #ClimateChange & increasing risk/severity of #wildfire in California--including the still-unfolding disaster? Yes. Is climate change the only factor at play? No, of course not. So what's really going on? [Thread] #CAfire #CAwx #LAfires iopscience.iop.org/a...
09.01.2025 22:05 — 👍 789 🔁 365 💬 26 📌 73
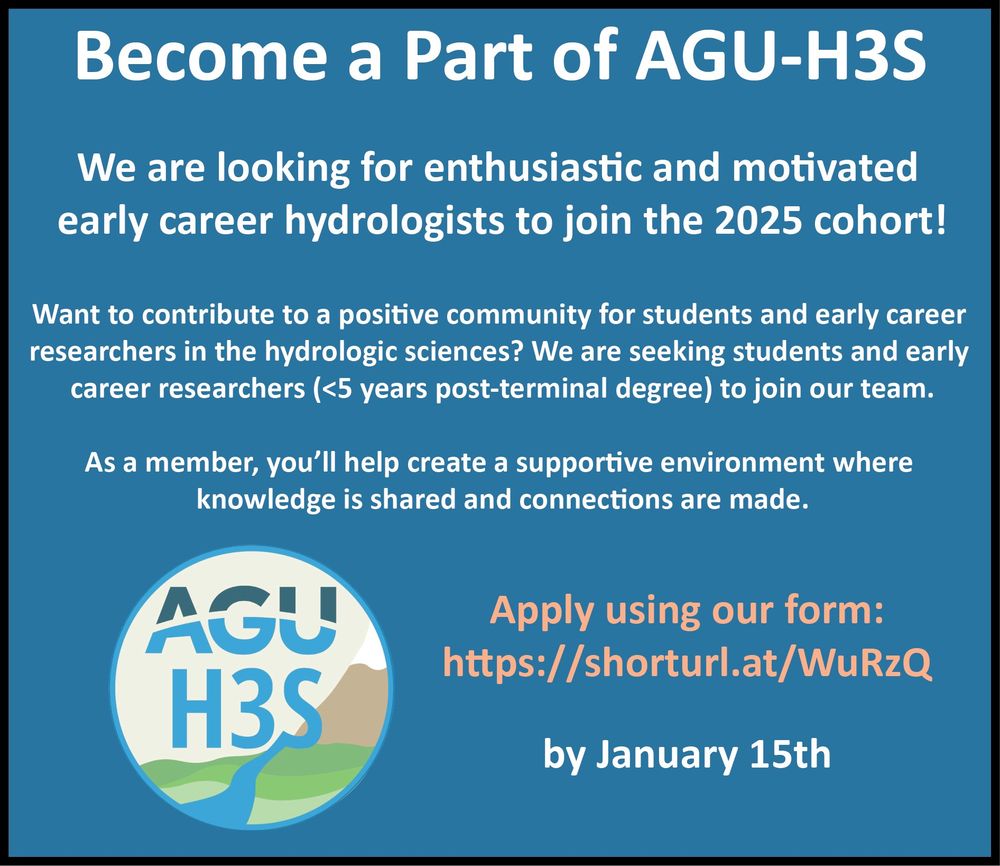
Join the AGU-H3S team! Applications due January 15th!
shorturl.at/WuRzQ
30.12.2024 18:57 — 👍 17 🔁 11 💬 0 📌 1

🆕 study led by PIK scientists identifies the causal links behind the increase in hot and dry extremes in Central Europe. The influence of dry soil on temperature rose by 67%, while the impact of atmospheric drivers on soil moisture has intensified by 50%: www.pik-potsdam.de/en/news/late...
23.12.2024 12:32 — 👍 19 🔁 13 💬 1 📌 0
Understanding the mechanisms and atmospheric drivers that contribute to hot and dry compound extremes in Europe it’s a challenge that here we tackle with a causal discovery method. Great experience for me personally to work with this talented team of early career scientists
12.12.2024 15:24 — 👍 9 🔁 2 💬 1 📌 0

A person stands smiling at a conference entrance, holding a black award plaque. The entrance is flanked by two elegant balloon arrangements featuring blue, white, and gold balloons with "AWWA Florida - Quality Water Matters!" branding. The person is wearing a blue polo shirt and khaki pants, standing on a decorative carpeted floor with geometric patterns in red, blue, and gold.

Close-up shot of the Roy W. Likins Memorial Scholarship award plaque on a banquet table, accompanied by conference materials including a name badge and luncheon program. The silver plaque is positioned between water glasses on a gold tablecloth, with blue stage lighting visible in the background. The plaque recognizes academic achievement and leadership in the drinking water industry, dated December 11, 2024.
Honored and excited to receive the prestigious Roy W. Likins Memorial Scholarship award from the American Water Works Association Florida Section at their 2024 Fall Conference! This award recognizes academic excellence, leadership, and contributions to the community and the water industry.
#AWWA
11.12.2024 21:35 — 👍 4 🔁 0 💬 0 📌 0

Flyer for AGU24 conference featuring a talk titled 'Dissecting flood losses along the United States Gulf and East Coasts.' Presenters include Thomas Wahl, Javed Ali, Joao Morim, Alejandra Enriquez, Christopher Emrich, and Melanie Gall. The event is scheduled for Friday, December 13th, 2024, from 8:55 AM to 9:05 AM in Salon C at the Convention Center. The session is GC51B - Advances in Quantifying and Attributing Climate Impacts and Damages to Inform Climate Risk Management and Litigation.
I won’t be attending #AGU24 this year, but if you’re interested in our research on how compound flooding impacts communities along the U.S. Gulf and East Coasts, don’t miss the talk by @thomas-wahl.bsky.social on Friday, Dec 13th (8:55 AM - 9:05 AM) in Salon C.
🔗 agu.confex.com/agu/agu24/me...
06.12.2024 14:25 — 👍 11 🔁 2 💬 0 📌 1

Assistant Professor, Civil and Environmental Engineering - Orlando, Florida, United States
The OpportunityThe Department of Civil, Environmental, and Construction Engineering (CECE) at the University of Central Florida (UCF) in Orlando, Florida, invites applicants for multiple full-time, 9-...
Our department at UCF has multiple tenure-track Assistant Professor openings. Topics of interest include coastal & water resources engineering, hydrology/hydraulics in urban/coastal areas, hydroinformatics, decision-making under deep uncertainty in the water sector.
🔗 tinyurl.com/ucf-cece-ope...
30.11.2024 03:44 — 👍 12 🔁 6 💬 0 📌 0
I often show my students this visualization of how atmospheric CO₂ travels around the globe. Our attitude toward burning fossil fuels would change significantly if we could actually see CO₂.
svs.gsfc.nasa.gov/goto?11719
29.11.2024 22:09 — 👍 1211 🔁 489 💬 52 📌 22

Methane is an important contributor to global warming, and cutting methane emissions could be a way to rapidly reduce global temperatures.
But it’s CO2 that’s been the primary driver of recent - and future - warming:
29.11.2024 18:31 — 👍 104 🔁 21 💬 15 📌 2
28. A listing of folx working on hazards and disasters, also curated by @watershedlab.bsky.social
Geohazards and disaster professionals Starter Pack bsky.app/starter-pack...
09.11.2024 15:31 — 👍 7 🔁 3 💬 1 📌 0

A graph titled 'Climate Change Fuels Stronger Storms' showing how climate change affects peak wind speeds and storm categories of various hurricanes. The horizontal axis shows peak wind speed from 60 to 180 mph, while the vertical axis is divided into storm categories from Tropical Storm to Category 5. Each storm is represented by two hurricane symbols connected by an arrow, with the lighter symbol showing wind speed without climate change and the darker symbol showing increased wind speed with climate change. Nine named storms are shown: Oscar, Francine, Debby (all Category 1), Ernesto, Leslie, Isaac (all Category 2), Rafael (Category 3), Helene, Kirk (both Category 4), and Milton, Beryl (Category 5). The graph shows that climate change-driven ocean warming results in storms becoming stronger, often moving up to higher categories. The visualization is from Climate Central and based on NOAA data.
New analysis from Climate Central found that 2024 storms’ wind speeds increased by up to 28 miles per hour, boosting their destructive power.
🔗 Full report: www.climatecentral.org/report/2024-...
21.11.2024 17:46 — 👍 8 🔁 2 💬 0 📌 2
Haven’t come across a water people list so I made my first starter pack! A broadly defined set of #water experts go.bsky.app/V1LydbV
09.09.2024 23:17 — 👍 187 🔁 74 💬 43 📌 10
Sea Level Calculator
See how sea levels and coastal flooding have changed over time and use scenarios to make decisions about adaptation investments and approaches
Check out NOAA’s Sea Level Calculator.
This tool combines data from NOAA and NASA to identify significant historical floods in your area and show how often similar events will happen in the future with sea level rise.
🔗 Try it here: coast.noaa.gov/digitalcoast...
18.11.2024 23:33 — 👍 15 🔁 3 💬 0 📌 0

Two people wearing gas masks stand in a heavily polluted environment, with the smog-covered India Gate barely visible in the background. They are looking at their phones, and one of them sarcastically says, ‘Have you heard of this magical thing called blue sky?’

A map showing air quality readings across New Delhi, India. Various locations display AQI numbers in purple bubbles, ranging from around 500 to over 1800.
Air quality in New Delhi, India.
18.11.2024 21:23 — 👍 6 🔁 4 💬 0 📌 0
Hi all, the starter pack below has been significantly updated now, and I will continue to update it further, whenever time allows.
Once this starter pack is full (Bluesky currently allows only up to 150 people per starter pack), I will start another one and call it - Part 2.
go.bsky.app/2h9ouZY
18.11.2024 09:54 — 👍 32 🔁 18 💬 4 📌 2
Transmission, & siting and permitting @RMI. Facilitator, analyst, might have opinions about your data viz. I dream of powder days.
🇪🇺 EU Project: Environmental Analysis and Resilience for Transformative Human-Optimised Natural Environments
👉 https://earthone-project.eu/
Knowledge Action Network on Emergent Risks and Extreme Events
- Reducing Disaster Risks under Environmental Change - https://www.risk-kan.org
We break Apple news. Leading source for all things iPhone, Mac, iPad, Apple Watch, more
Global Climate Lead Scientist @WWF
IPCC Lead author AR7 and AR6
Working at the intersection of climate, biodiversity & sustainable development.
Research: Ecosystems, Food, CDR, Energy
Pinay, mom, sunshine hunter, LOL-er
Oceans. Climate. Society. And everything in between. Climate scientist and numerical modeler, aka Anastasia Romanou. NASA-GISS/Columbia U. Views my own. Profile image credit ECCO-JPL-NASA!!!
Climate scientist, professor at ICTP Trieste ,interested in climate extreme detection and attribution, hydroclimate, AI for climate application, IPCC AR6 lead author
Climatologist. Cyclist. Rationalist. Universalist. Chocolate addict. IPCC author (AR5, AR6 WGI + AR6 Synthesis Report) & RE (AR7 WGI). Posts based on best available knowledge when related to climate. Personal opinion otherwise 🇪🇺🇺🇦. #climat #climate
Climate scientist, CCCma, Environment and Climate Change Canada, IPCC AR7 Lead Author
Research/DECRA Fellow at the ANU working with #large_ensembles to understand climate variability and projections, views are my own (she/her/Dr)
nicolamaher.weebly.com
Physicien climatologue, Directeur de Recherche du CNRS au LMD/ENS/IPSL
Auteur principal du 6e et 7e rapport du #GIEC @IPCC_CH, Groupe 1: "Les bases physiques du Climat"
Co-fondateur des Trains du Climat
Climate Scientist @CNRS, IPCC AR6 and AR7 lead author
Professor of Climate Change, King's College London. Climate science, communication, chronic fatigue syndrome and fibromyalgia. 🏳️🌈 🇦🇶 🧊
| Professor of Physical Oceanography and Climate @ufsc | Love all things nature...
Climate and freshwater scientist
Climate scientist, director ICARUS Climate Research Centre, Maynooth University, Ireland, author IPCC AR6, member Ireland's climate change advisory council, Chair GCOS AOPC. www.peter-thorne.net
Scientist @EU_Commission's Joint Research Centre. Forests, carbon and climate in the science/policy interface. Member #IPCC task force Bureau #AR7. Views mine.
Senior Researcher at TÜBİTAK, IPCC WGIII Vice-Chair
Professor at METU Earth System Science Graduate Program
https://www.ipcc.ch/people/siir-kilkis/ / Views my own
Adaptation & Loss and Damage Researcher
Canada Research Chair in Climate Change & Health | Professor, University of Alberta | Lead Author IPCC #SROCC & WGII #AR6 | IPCC WGI Vice Chair