In addition to the new forms we have created, new specialized data entry forms can be created by anyone using the new data input API and one can do bulk uploads from spreadsheets as well. If you are interested in either of these, please reach out for instructions & to get permission
04.02.2026 13:28 — 👍 2 🔁 0 💬 0 📌 0
The new Occurrences form has a host of new features that highlight holotypes, allow you to delete entries, reidentify taxa, etc. Details on their use will be included in the updated User Guide as well which will be out soon!
04.02.2026 13:28 — 👍 2 🔁 0 💬 1 📌 0
Did you know we have new data entry forms?! They're designed to make your life easier, we promise: The new Reference form allows you to enter a DOI which will (usually) retrieve pub data so you don't have to type it, and you can (and should!) now enter full author names instead of just initials.
04.02.2026 13:27 — 👍 4 🔁 0 💬 1 📌 0
This new “PBDB 2.0” architecture will allow more rapid development of new functionality, including high quality specimen images through links to external image repositories, and a mechanism to meaningfully incorporate taxonomically cryptic organisms - trace fossils, early life, microbialites & more!
03.02.2026 15:51 — 👍 3 🔁 0 💬 0 📌 0
Award Details - NSF Award Search
Find award details and explore award abstracts and publications.
Great news! A new NSF Geoinformatics grant to support the PBDB was funded in June of 2025! This will overhaul the technical underpinnings of PBDB, a necessary step for carrying the PBDB forward -- www.nsf.gov/awardsearch/...
03.02.2026 15:49 — 👍 14 🔁 5 💬 1 📌 0
Taphonomic megabiases constrain phylogenetic information in the squamate fossil record | Paleobiology | Cambridge Core
Taphonomic megabiases constrain phylogenetic information in the squamate fossil record
It’s finally out! Extremely pleased to share the last chapter of my dissertation to be published! In this study, we take a deep dive into the 242 million-year squamate 🦎🐍 fossil record to quantify factors that lead to the mostly fragmentary specimens in collections today: doi.org/10.1017/pab....
24.09.2025 14:49 — 👍 18 🔁 8 💬 1 📌 0
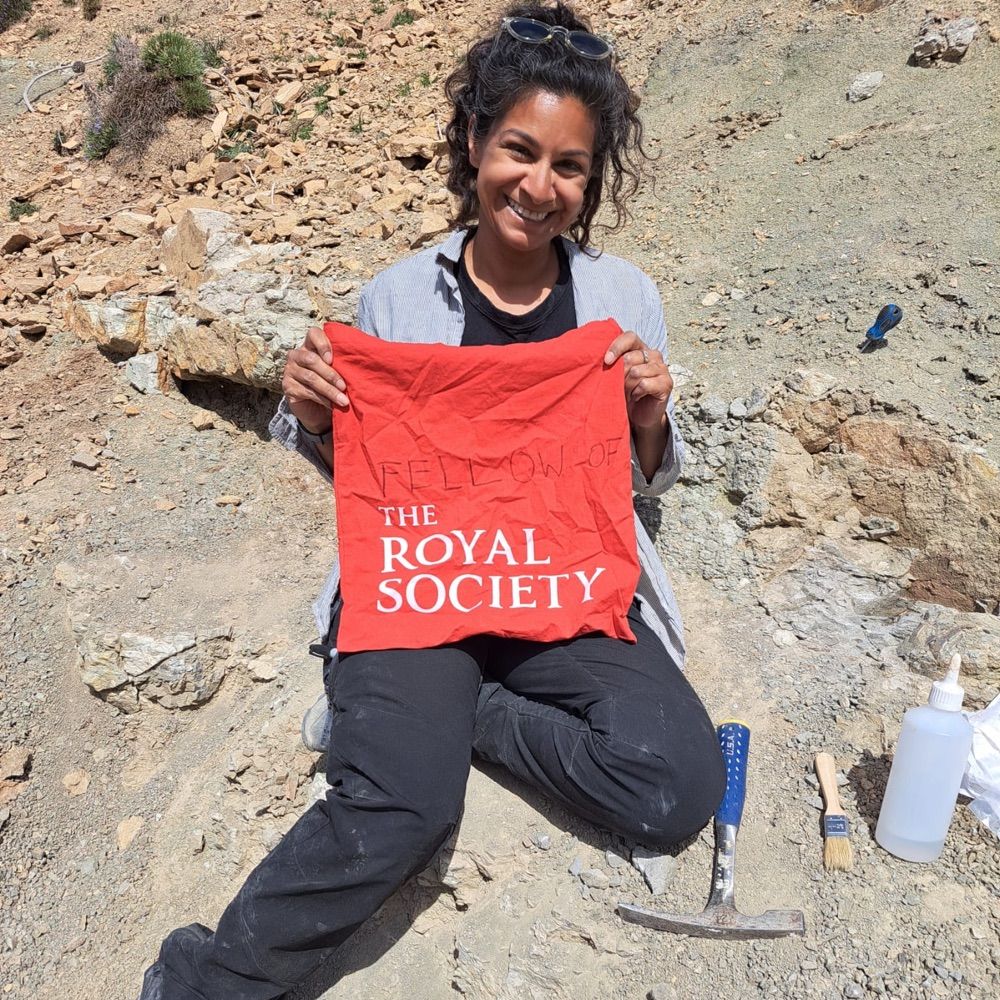
Well, I clearly need to enter this into the Paleobiology Database @paleodb.bsky.social : but who is the author?
19.11.2025 05:02 — 👍 4 🔁 1 💬 2 📌 0
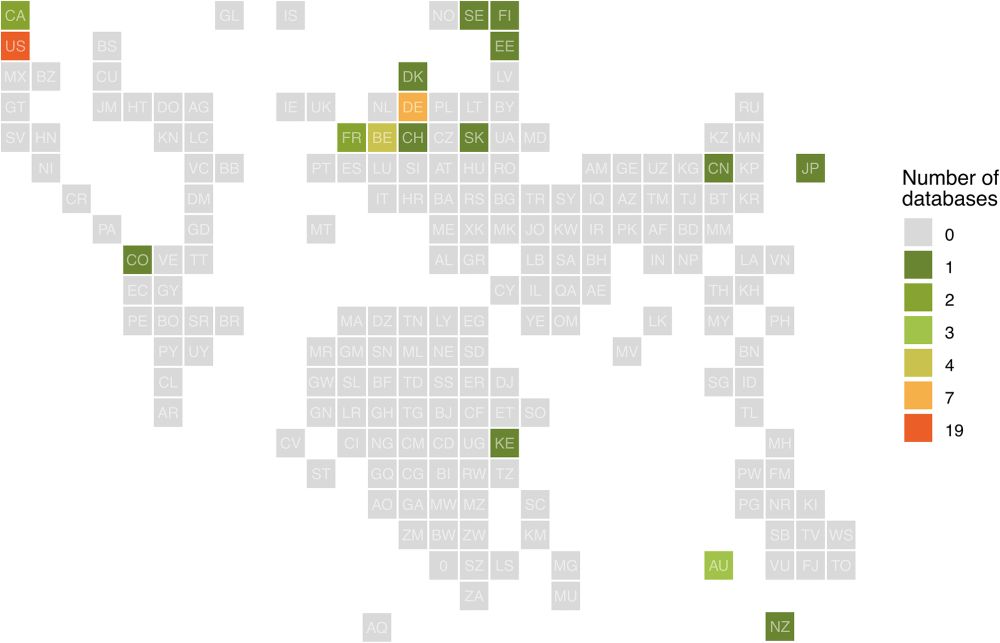
Databases like @paleodb.bsky.social are cornerstones of palaeobiological research. Most are concentrated in the 'Global North', but the associated socio-economic advantages sadly do not make them infallible to financial and infrastructure challenges... (4/n)
23.04.2025 13:18 — 👍 6 🔁 1 💬 1 📌 0
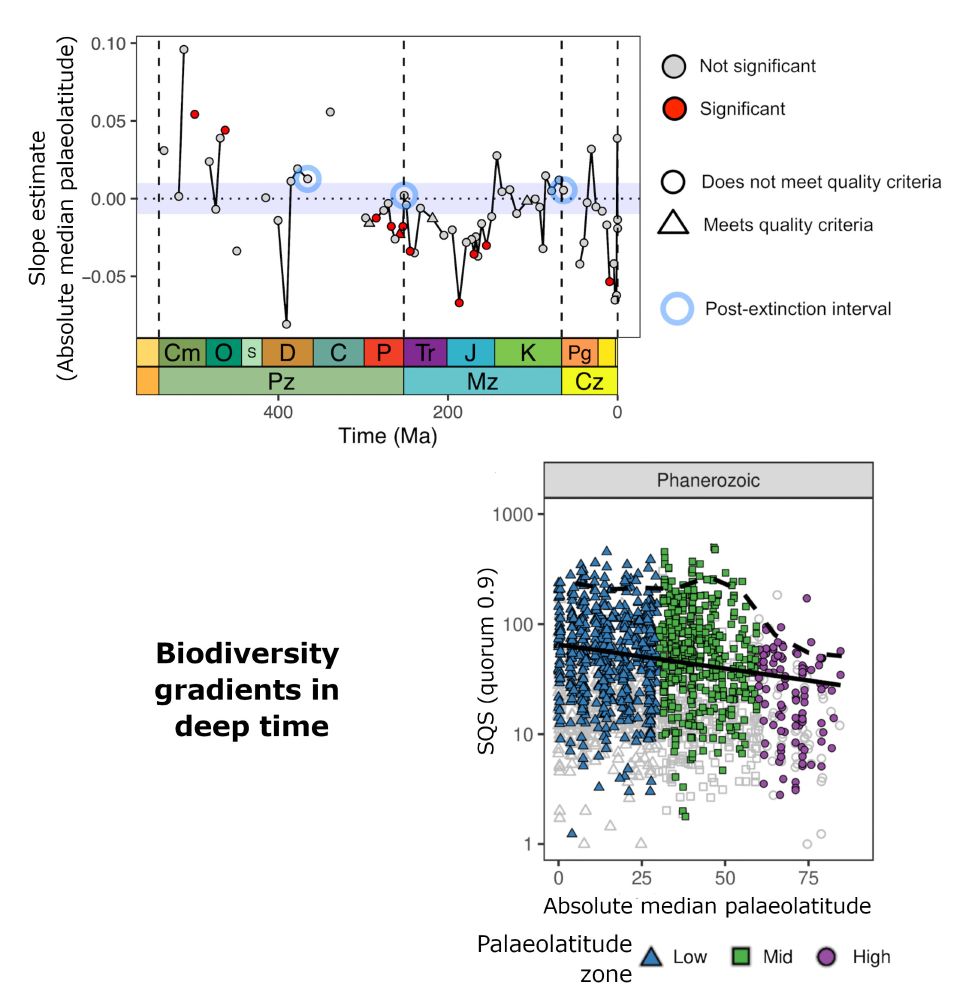
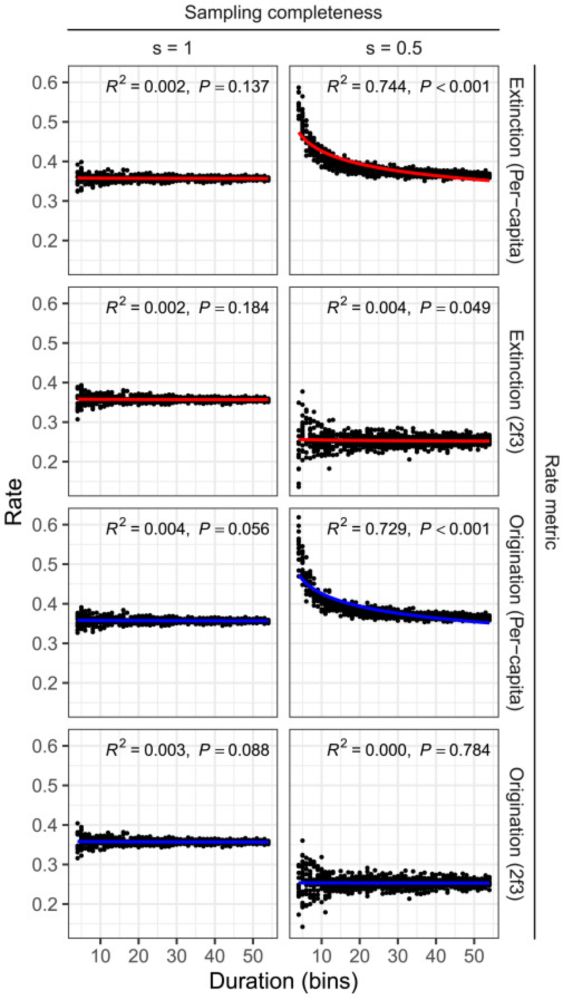
Top: Plot showing variation in the estimated slopes of the palaeolatitudinal biodiversity gradient through time across the Phanerozoic (including data from Europe and North America) for 1000 km grid cells. Slopes are estimated as the coefficient of per-cell, stage-level SQS diversity on absolute palaeolatitude for individual stages. Triangle data points meet quality criteria; circles do not. Red points are significant; grey points are not. A blue ring around a data point indicates a post-extinction interval. Horizontal blue shaded region highlights slopes close to zero.
Bottom right: Plot illustrating the relationships between per-cell, stage-level diversity estimates and palaeolatitude aggregated across the entire
Phanerozoic, globally. Data point colours indicate palaeolatitude zone: blue triangles, low; green squares, mid; purple circles high latitude. Solid black line is ordinary least squares regression line; dashed line traces the 95th quantile for each latitudinal band.
Marine animal diversity across latitudinal and temperature gradients during the Phanerozoic onlinelibrary.wiley.com/doi/full/10.... @climatesamwell.bsky.social @eesaupe.bsky.social @paleodb.bsky.social
06.05.2025 18:07 — 👍 12 🔁 6 💬 1 📌 0
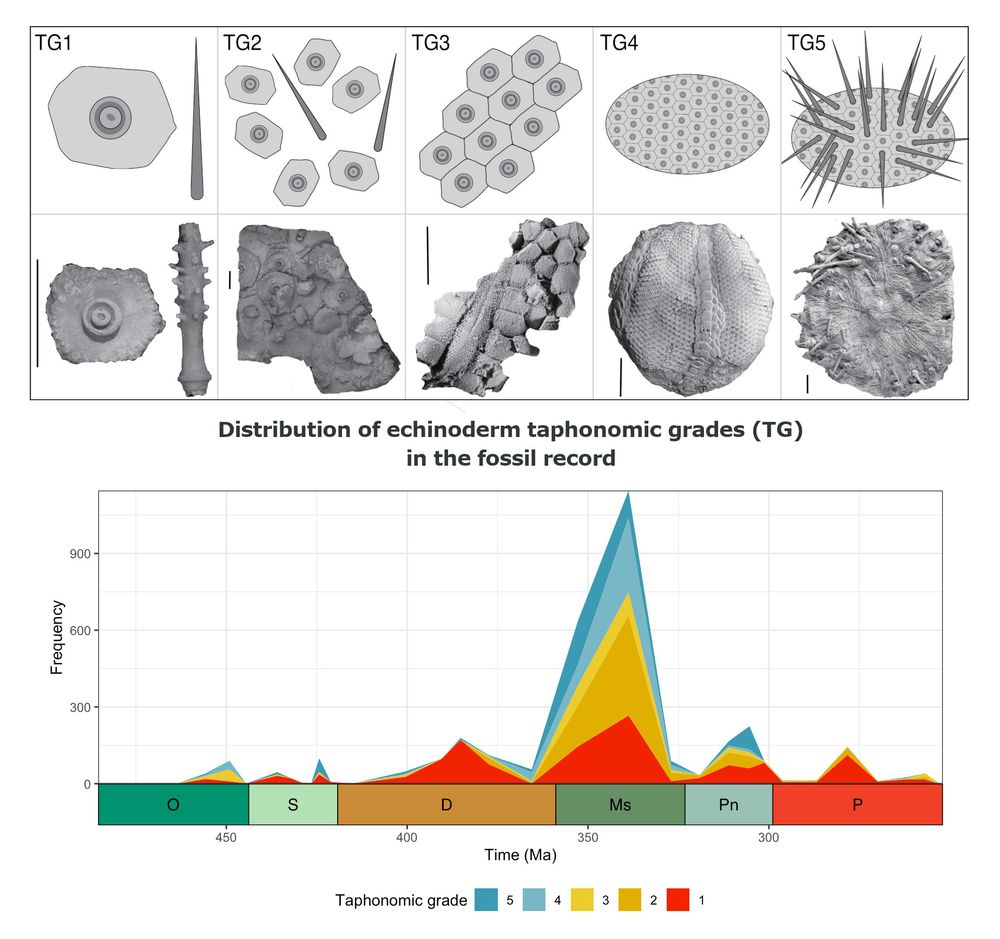
Top: Grid including illustrations (top row) and photographs (bottom row) of Palaeozoic echinoid fossils demonstrating examples of 5 taphonomic grades used in the paper. Left to right: TG1, MCZ:IP:103620, disarticulated spine and interambulacral plate of the archaeocidarid Archaeocidaris sp.; TG2, LACM 2020.1, pile of disarticulated interambulacral plates and spines from Archaeocidaris sp.; TG3, MCZ:IP:101936, fragment of a test of the palaechinid Maccoya intermedia showing ambulacral and interambulacral plates; TG4, YPM 26552, denuded test of the lepidesthid echinoid Lepidesthes colletti; TG5, NHMUK Pal E 76888, holotype of Archaeocidaris whatleyensis, an articulated test preserved with
covering spines; scale bars (with photographs) are 1 cm.
Bottom: Coloured plot showing the temporal distribution of taphonomic grades from the Ordovician (on the left) to the Permian. Vertical axis represents frequency of occurrence. Different colours indicate the 5 different taphonomic grades.
Taphonomic controls on a multi-element marine skeletal fossil record onlinelibrary.wiley.com/doi/10.1111/... @echinerd.bsky.social @datadryad.bsky.social @paleodb.bsky.social #FossilFriday
30.05.2025 12:45 — 👍 13 🔁 7 💬 1 📌 1
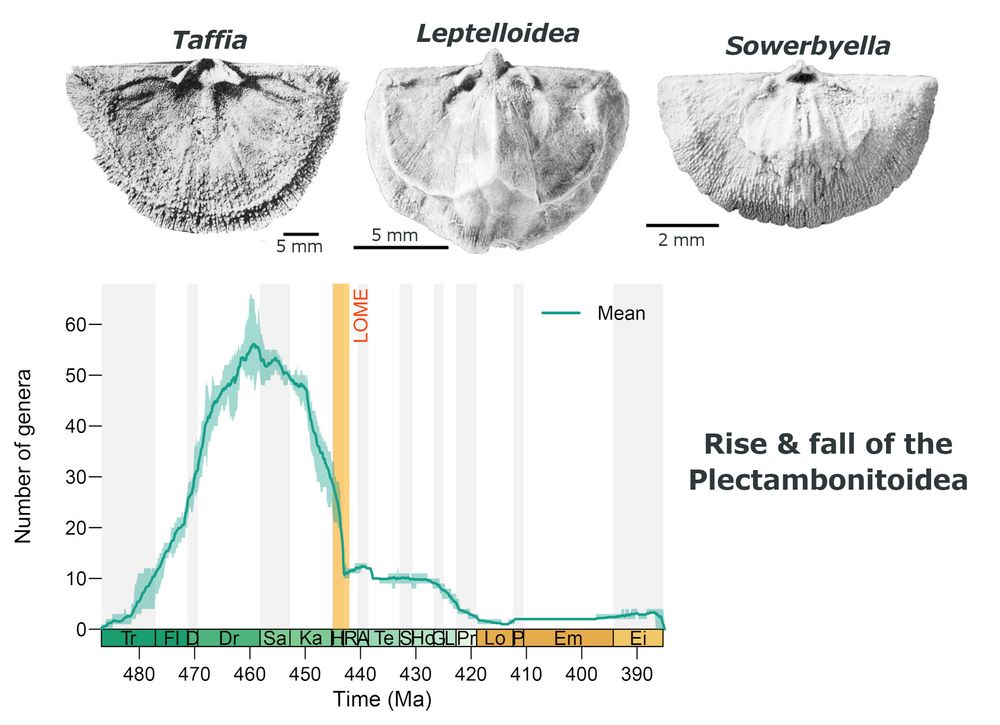
Three photographs of fossil brachiopods, examples of key plectambonitoid taxa: taffiin Taffia from the Lower Ordovician of Alabama, USA (USNM 91586); leptellinid Leptelloidea from the Upper Ordovician of Baltica (NHMUK BB 5169); sowerbyellin Sowerbyella from the Upper Ordovician of Baltica (NHMUK BB 5149).
On the lower left, a plot showing the change in number of plectambonitoid brachipod genera through time (Tremadocian on the left to Eifelian on the right), with the Late Ordovician Mass Extinction (LOME) marked as a yellow vertical line.
Diversification & disparity in a major Palaeozoic clade of Brachiopoda: the rise and fall of the Plectambonitoidea onlinelibrary.wiley.com/doi/10.1111/... @paleodb.bsky.social
04.06.2025 08:30 — 👍 11 🔁 3 💬 0 📌 0
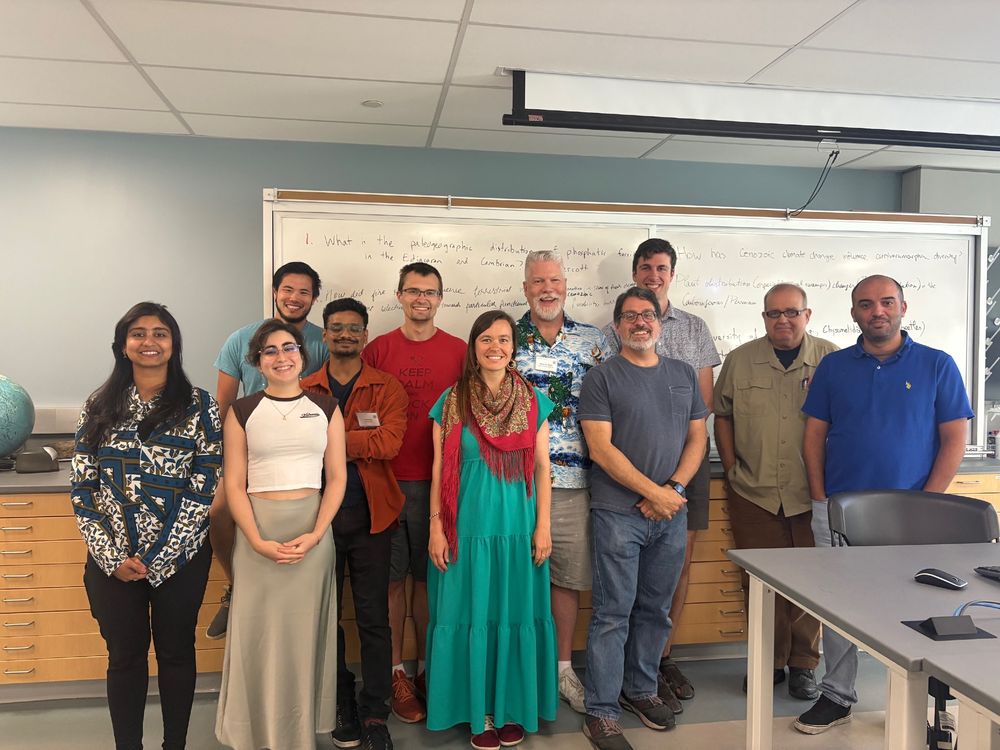
Enriching experience at the @paleodb.bsky.social workshop focused on mastering the core functions of this powerful database and research tool. Some highlights include- entering occurrence and taxonomic data, extracting data for analysis and visualization, and of course international networking!
18.06.2025 22:06 — 👍 4 🔁 1 💬 0 📌 0
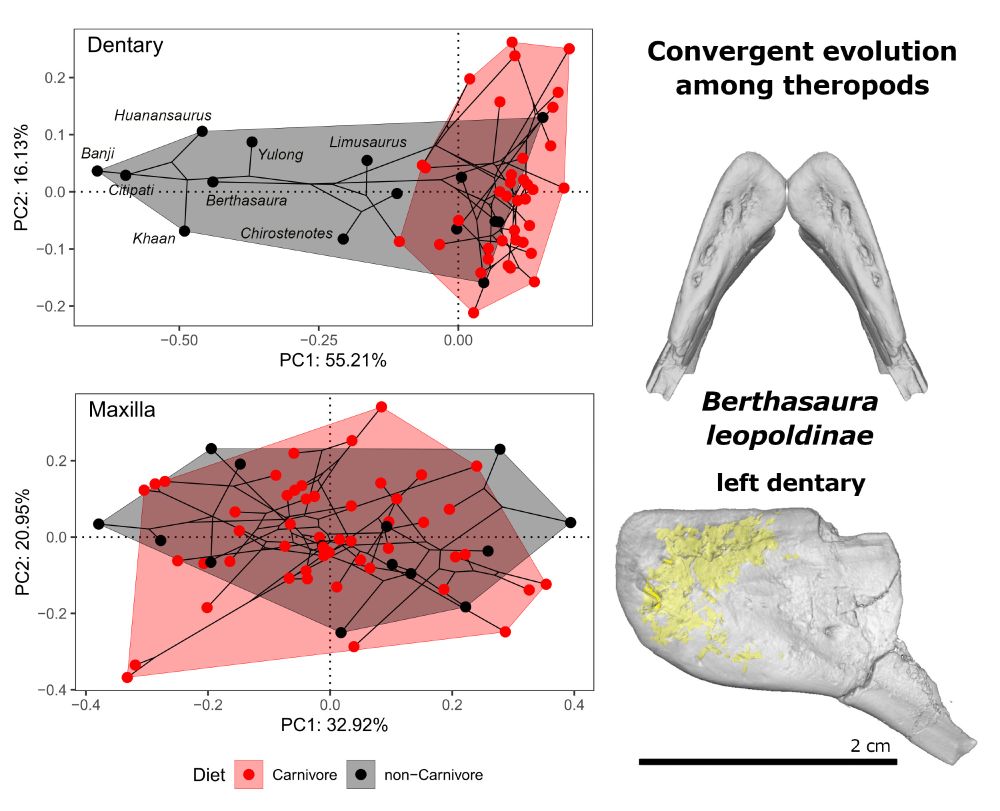
On the left, two phylomorphospace plots showing the first two principal components for the dentary (top) and maxilla (bottom) of a group of theropods.Carnivores are shaded red, non-carnivores grey.
On the right, digital reconstructions from CT scan images of a left dentary of Berthasaura leopoldinae (MPCO.V 0121): at the top an isosurface of the bone in dorsal view, mirrored to show how a pair would be angled; at the bottom, a translucent model in lateral view with internal cavities highlighted in yellow.
Convergent evolution among non-carnivorous, desert-dwelling theropods as revealed by the dentary of the noasaurid Berthasaura leopoldinae from the Cretaceous of Brazil onlinelibrary.wiley.com/doi/10.1111/... #FossilFriday @paleodb.bsky.social @datadryad.bsky.social
11.07.2025 16:27 — 👍 14 🔁 6 💬 0 📌 0
🚨 Deadline extended to May 1st! 🚨
Be sure to get your applications in for this summer's introductory workshop to the PBDB ASAP!
More details and application form here:
forms.gle/xQqDEQwwXeTH...
21.04.2025 17:56 — 👍 7 🔁 8 💬 0 📌 0
Great opportunity, but - warning - may lead to you spending years of your life entering data...
03.04.2025 22:13 — 👍 7 🔁 2 💬 1 📌 0
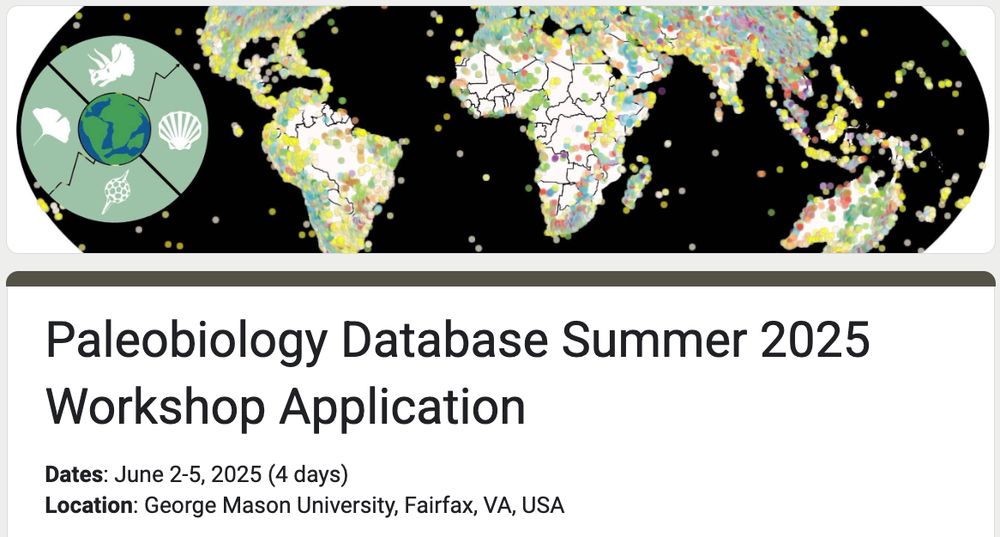
Paleobiology Database Summer 2025 Workshop Application
Dates: June 2-5, 2025 (4 days)
Location: George Mason University, Fairfax, VA, USA
Do you want to learn how to contribute to and use the Paleobiology Database? 🌎🦕🐚
Look no further - we're now welcoming applications to the 2025 edition of our introductory workshop!
More details here: forms.gle/xQqDEQwwXeTH...
03.04.2025 20:00 — 👍 27 🔁 21 💬 3 📌 2
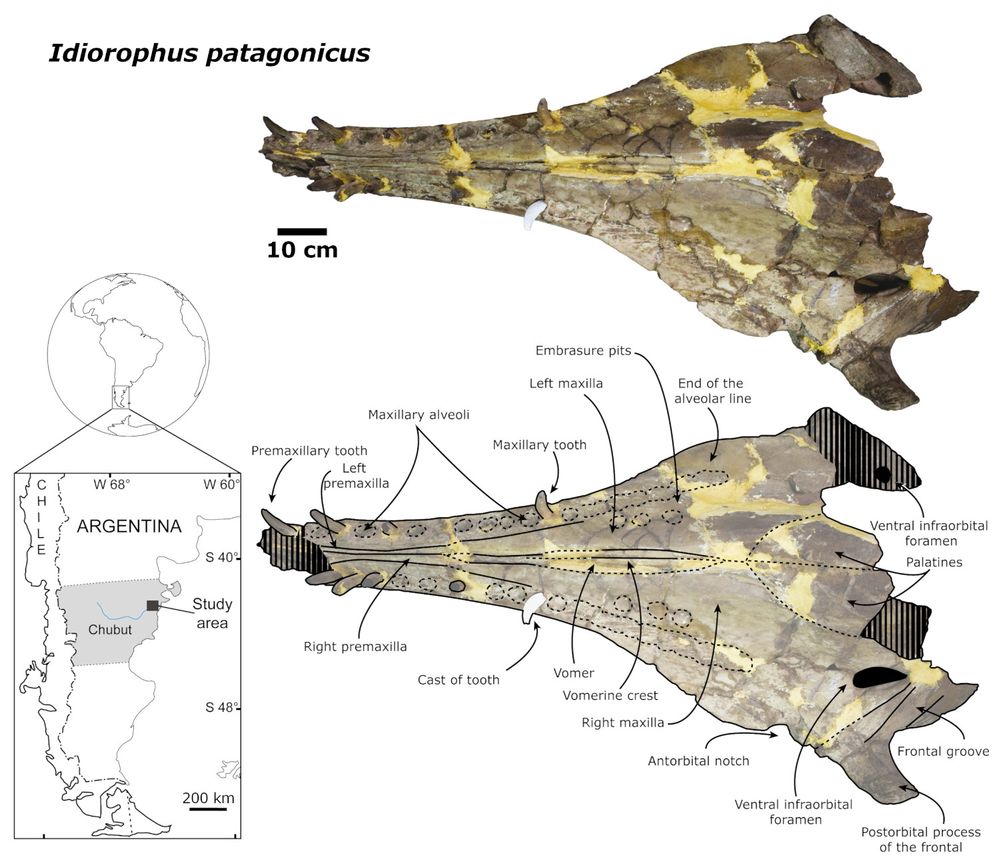
Photograph of a fossil skull (above), same with labels overlaid (below). Type material of Idiorophus patagonicus (MLP-PV-5-2) in ventral view. Scale bar (to left of upper image) is 10 cm. In the bottom left corner is a globe showing South America and an expanded detail of Chile and Argentina, with Patagonia shaded grey and the study area indicated with a black rectangle.
New in #PapersinPalaeontology: Awakening Patagonia's sleeping sperm whale: a new description of the Early Miocene Idiorophus patagonicus onlinelibrary.wiley.com/doi/full/10.... @paleodb.bsky.social
26.03.2025 16:03 — 👍 8 🔁 4 💬 0 📌 1
⛏️For people working on the Devonian, Carboniferous & Permian (=all the best periods). Deadline for abstract submission is April 1st. geotolosa2025.sciencesconf.org
#geology #paleontology #paleobotany #paleoclimatology #paleozoic
11.03.2025 09:12 — 👍 12 🔁 7 💬 0 📌 1
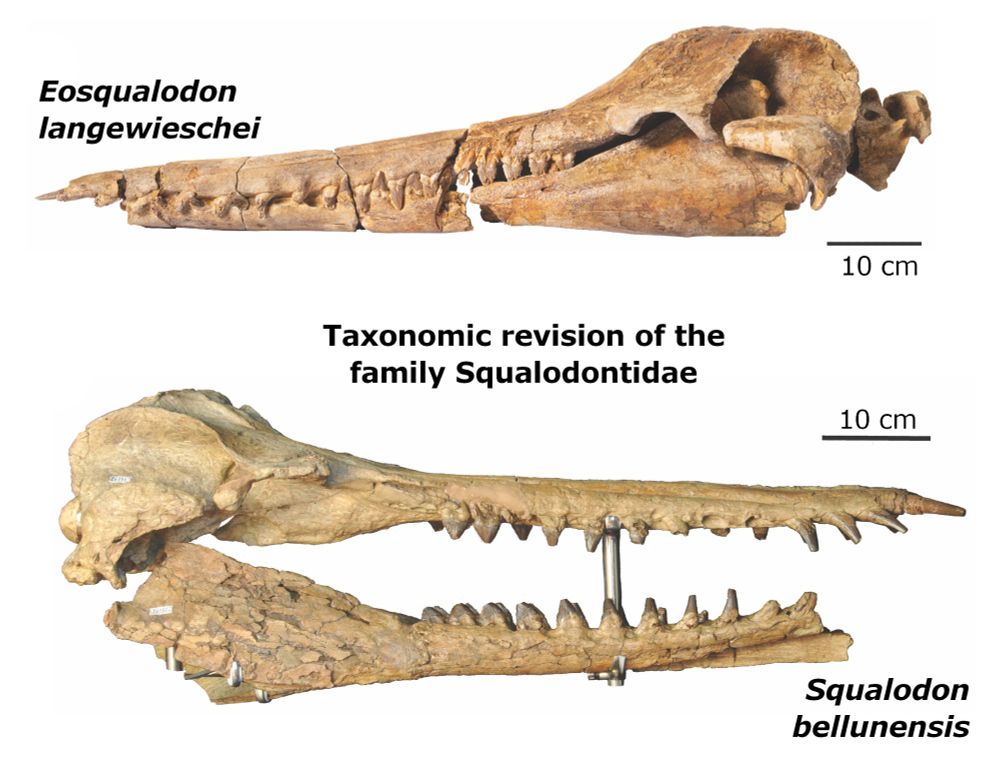
Two photographs of fossil cetacean skulls in lateral view. Above: the holotype of Eosqualodon langewieschei (Museum of Bünde specimen number 326). Below: Squalodon bellunensis (specimen number MGP 26131) in lateral view. Scale bars (on the right side) are both 10 cm.
Taxonomic revision of the family Squalodontidae (Cetacea, Odontoceti): emptying the wastebasket of fragmentary holotypes onlinelibrary.wiley.com/doi/10.1002/... #FossilFriday @paleodb.bsky.social
28.02.2025 18:23 — 👍 51 🔁 15 💬 0 📌 0
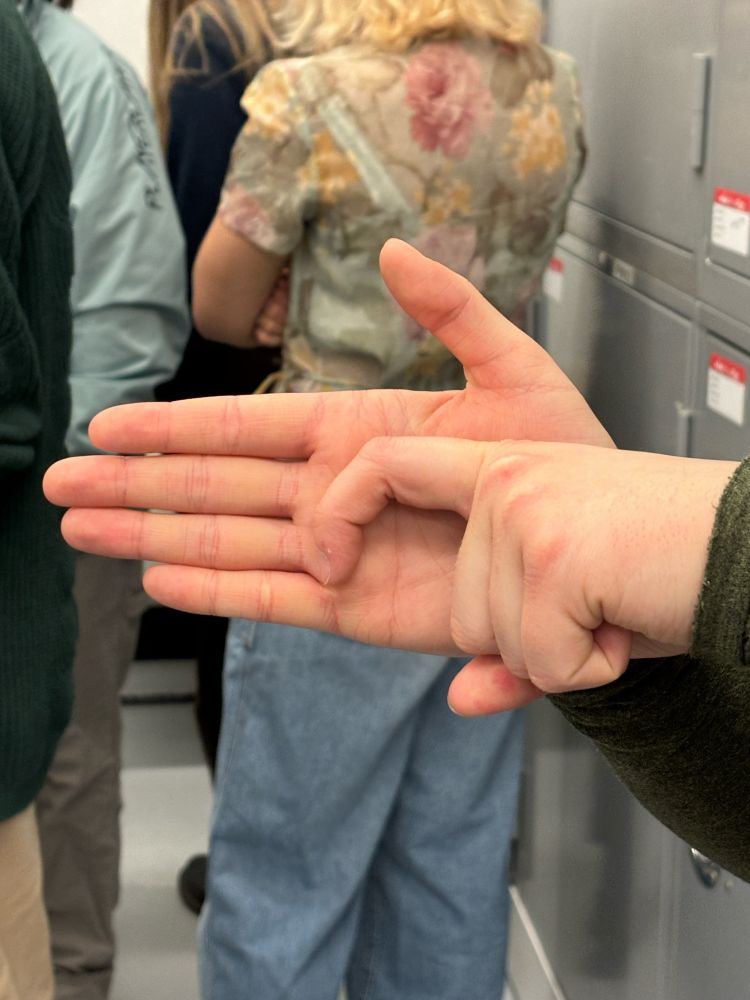
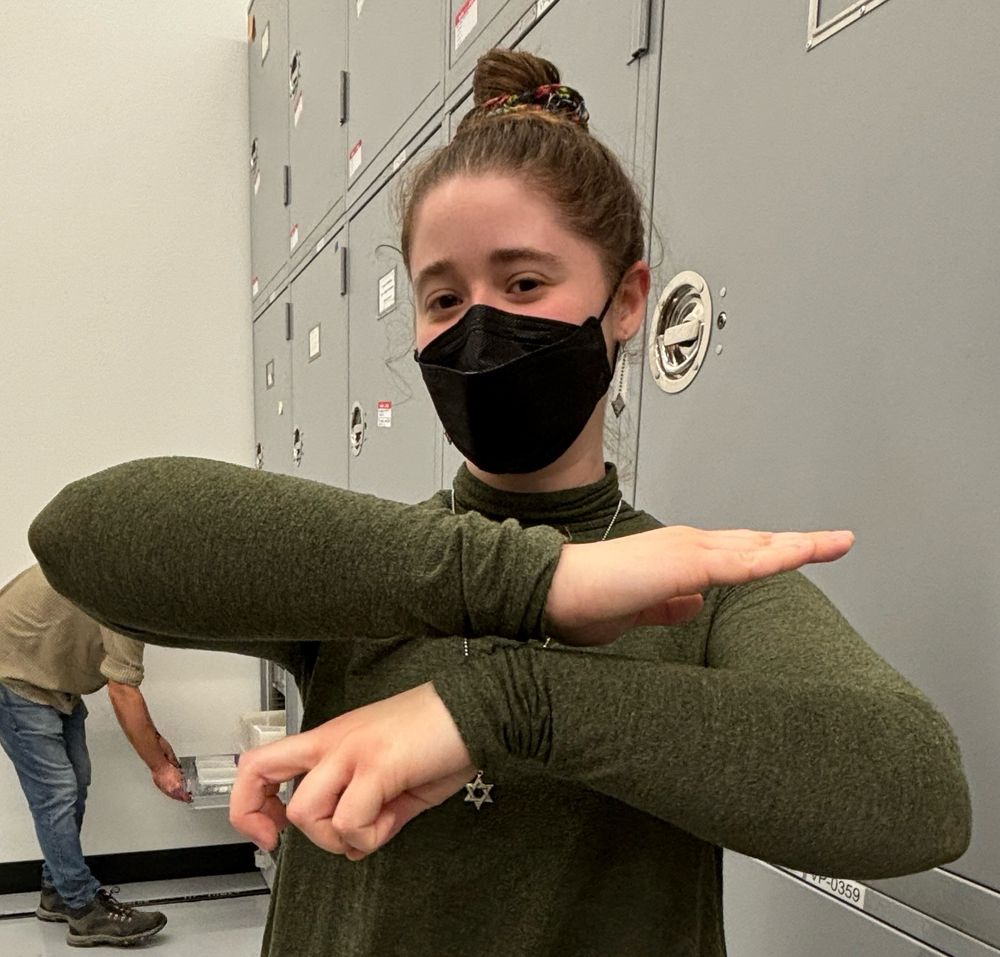
Yesterday one of my students taught me a couple of ways to sign “fossil” in ASL. The one on the right is evocative bc it’s the bone sign but buried. The one on the left is used more for plant fossils, apparently, and is meant to show an object on a slab. I love these!
20.11.2024 15:17 — 👍 157 🔁 49 💬 0 📌 0
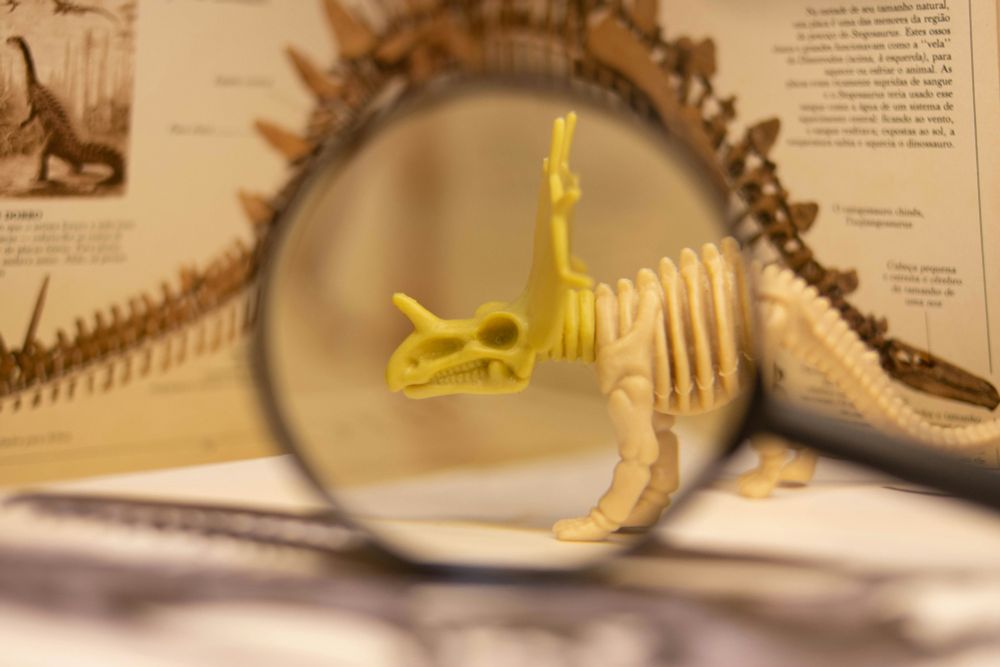
A photo by Lucas George Wendt (Unsplash) shows a plastic triceratops skeleton model seen through a magnifying lens. A book about dinosaurs in the background.
Are you looking to pursue a career in #Palaeontology?
On our website you can find information on Undergraduate and Postgraduate (Masters and #PhD) courses, and articles on possible career paths within palaeontology: www.palass.org/careers
22.11.2024 09:20 — 👍 65 🔁 19 💬 1 📌 0

Paleobiology Database User Guide Version 1.0
Author(s): Uhen, Mark D.; Allen, Bethany; Behboudi, Noushin; Clapham, Matthew E.; Dunne, Emma; Hendy, Austin; Holroyd, Patricia A.; Hopkins, Melanie; Mannion, Philip; Novack-Gottshall, Phil; Pimiento,...
For more info about the PBDB and its data, take a look at our new user guide: escholarship.org/uc/item/6tm0...
22.11.2024 12:24 — 👍 9 🔁 1 💬 0 📌 0
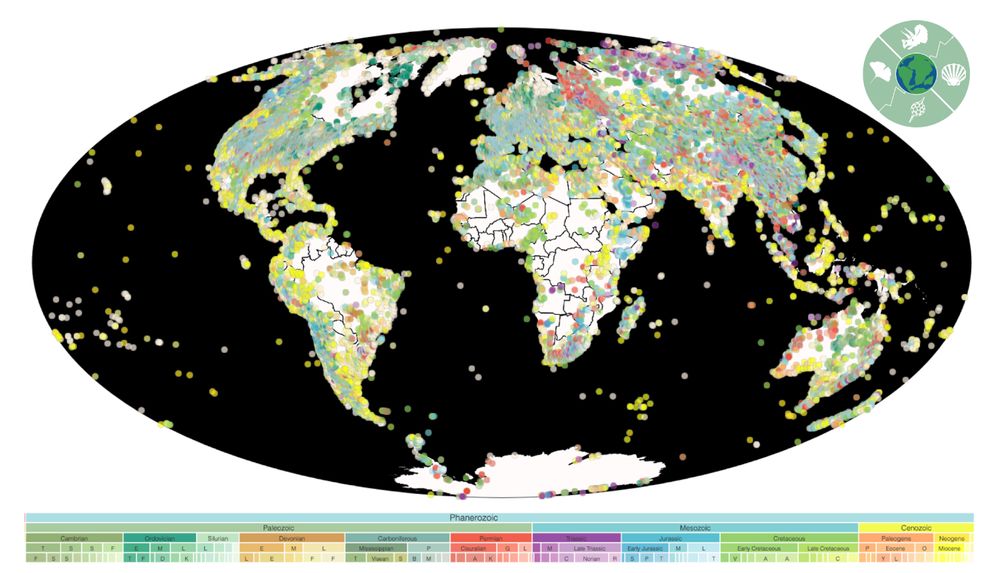
Image of the world showing fossil occurrences recorded in the Paleobiology Database as coloured dots with a geological timescale at the bottom
The Paleobiology Database has landed on Bluesky! ✨
Here we'll be posting database updates, new publications and all things fossil-data-related 🌍🐚
Be sure to check out our website for more info on how to contribute to and use PBDB data as well as loads of other resources! 🦕📊
paleobiodb.org
22.11.2024 12:23 — 👍 181 🔁 63 💬 4 📌 5
Associate Professor - Department of Earth Sciences, University of Oxford.
I'm interested in marine dispersal and the oceanic forcing of coral reef systems, past, present, and future.
nvogtvincent.co.uk
Fan of fossil fishes. Postdoc at University of Birmingham. Especially interested in using fossil and living taxa to understand the evolution of sharks, rays, and chimaeras. Also paint miniatures very slowly.
Professor of Palaeobiology at UCL (he/him) | https://www.ucl.ac.uk/earth-sciences/people/academic/prof-philip-mannion
Origin of major clades, ontogeny & evolution of form, evo+devo+paleo — Dept of Geosciences at Princeton University
Paleobiologist/oceanographer; Assistant Scientist at WHOI; Fish teeth and ancient marine ecosystems; circus artist 🌈 She/her
Advancing knowledge and understanding of paleontology and life’s evolution through research, education, and advocacy. Supporting and championing a diversity of voices.
https://www.paleosoc.org
Geosciences MSc • Earthquakes • Soil protection and contaminated sites • 📷 Fujifilm X-T4 and X100V • Herne, Ruhrgebiet • S04
Creator of Bluesky's FujiFeed
Official Bluesky of The Palaeontological Association (palass.org). Re-post of jobs and other events doesn't mean endorsement.
Rarely online - see https://oumnh.ox.ac.uk/people/dr-tom-smith for contact details and current research interests.
Computational palaeobiologist | Leverhulme Early Career Research Fellow, Oxford University Museum of Natural History | He/him
Macroevolution, paleobiology, Singapore-grown, US-developed scientist in Norway. Marine inverts, bryozoans. Natural History Museum & Centre for Planetary Habitability Oslo.
[Background photo is the Whanganui coast, North Island, NZ]
Curator of Vert. Paleo @floridamuseum.bsky.social | Curatorial Affiliate, Yale Peabody Museum | Research Associate, Smithsonian’s NMNH | former @uarizona.bsky.social | @georgemasonu.bsky.social & @Reed.edu alumnus. Big fan of nature past and present
Paleontologist 🦴 / Curator 🏛 Idaho Museum of Natural History / Associate Prof 👨🏻🏫 Biological Sciences Idaho State University 🐅 Biodiversity Superfan 🌍🦚🦉🦩🦖🦕🐊🐢🐍🐋🦬🦒🦇🦫🦣🐠🐡🦈🐝🐞🦗🦞🕷🪱🦑🐌🪸🍄🌲🌴🌾🌻
Paleobiologist studying the evolution of ancient ecosystems/Postdoc researcher at Estación Biológica de Doñana/Tocateclas
Scientific journal publishing research, overview and commentary across all of biology. All of it!
https://www.cell.com/current-biology/home
Part of CellPress @cellpress.bsky.social
Open Access publisher of academic journals PeerJ & PeerJ Computer Science, a Taylor & Francis Company.
Postdoctoral researcher at the Naturhistorisk Museum & Centre for Planetary Habitability Oslo🦕
Computational palaeobiology, deep learning and macroevolution 🦣
She/Her
Paleobiologist @IBE_Warszawa into cephalopods, parasites, funny tees and movies; Paleontology/Evolution Section Editor @PeerJLife
; previously @palaeofau. Avatar after Jacek Yerka also on @djbirddanerd@ecoevo.social
Evolutionary biologist, Chief Scientific Adviser @ Defra, practitioner of healthy coding-fieldwork balance, human and dog mom, she/her, On-juhlee, not On-jolly