I believe that the Power BI competence in the Faroe Islands has increased multiple times now that Chris is in the country.
18.08.2025 12:41 — 👍 0 🔁 0 💬 0 📌 0

Just love data ;-)
14.08.2025 11:00 — 👍 0 🔁 0 💬 0 📌 0
If you are self-employed and don’t like the boss, how do I quit?😶🌫️
13.08.2025 18:13 — 👍 0 🔁 0 💬 0 📌 0
Your are just spoiled. Look at excel and their updated. Or oracle report builder
13.08.2025 18:00 — 👍 1 🔁 0 💬 1 📌 0
I just need to know if Power BI and Fabric run on firewood and homebrew.
So far, no luck — seems they still rely on cloud, power, and just the right amount of existential dread.
Would’ve been nice if Microsoft offered a “cabin-in-the-woods” edition powered by moonshine and sheer willpower.
17.06.2025 15:13 — 👍 0 🔁 0 💬 0 📌 0
First it was X that got flooded, now it’s LinkedIn. And you can’t open a news site without being hit by a fresh disaster every five seconds.
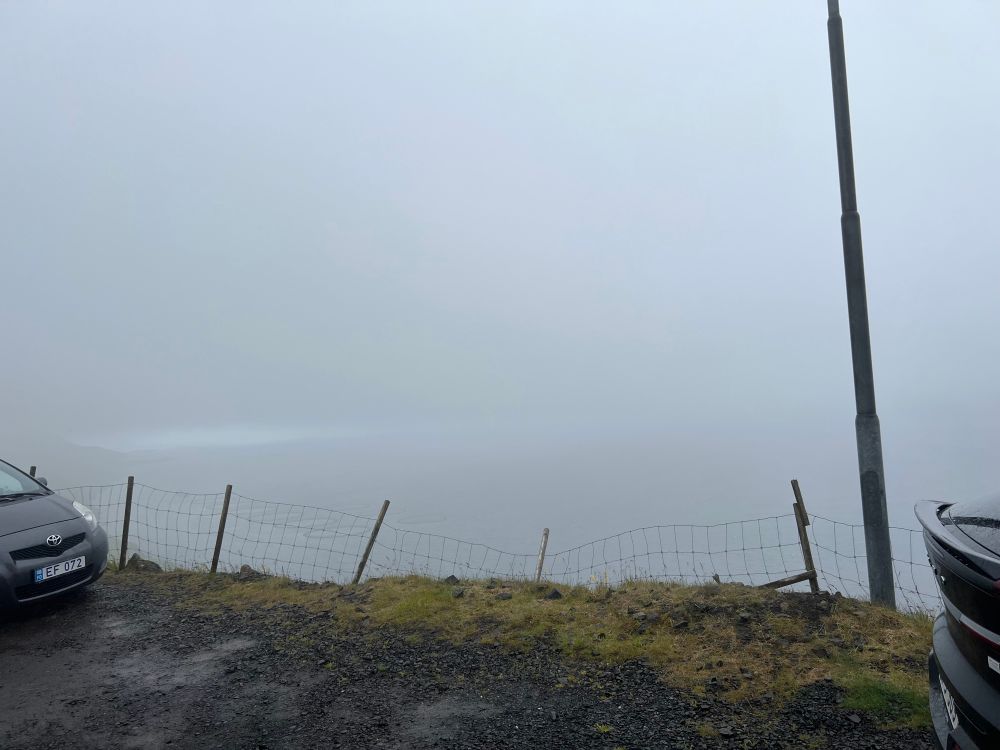
Honestly, I’m starting to think the smartest move is to buy a cabin in the woods — somewhere with no internet, no updates, and no trace of humanity.
17.06.2025 15:11 — 👍 1 🔁 0 💬 1 📌 0
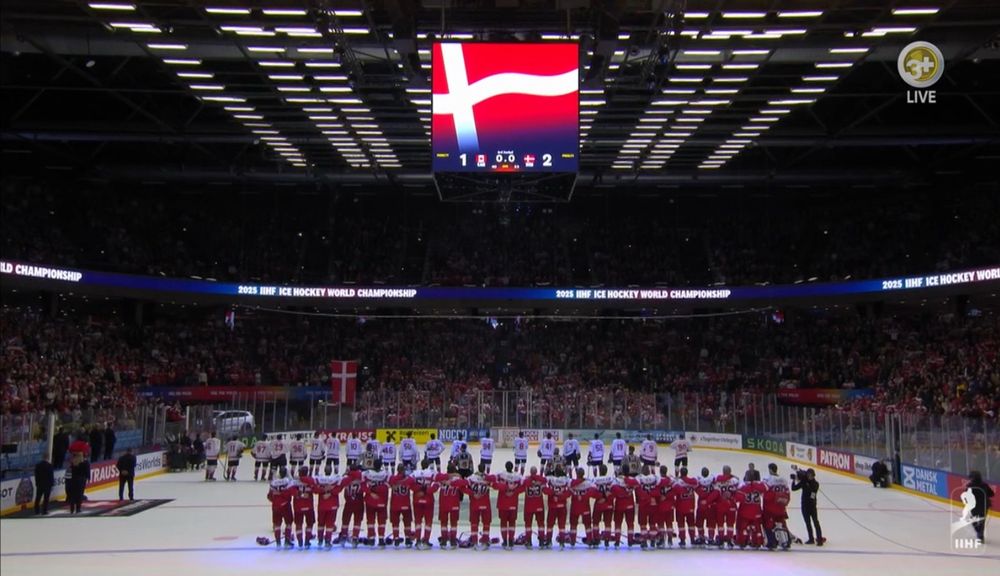
Fact: There are more icehockey referees in Vancouver than icehockey players in Denmark 🇩🇰🇨🇦 #icehockey
22.05.2025 20:46 — 👍 77 🔁 6 💬 3 📌 1

Wauh
Unbelievably they won against Canada. #Denmark #Icehockey
22.05.2025 20:49 — 👍 4 🔁 0 💬 0 📌 0
Not everything have to be in a nice grid
18.05.2025 16:25 — 👍 0 🔁 0 💬 0 📌 0
@erindataviz.bsky.social absolutely nailed the smart brevity #dataviz thing with this unconventional bar chart. Sometimes, rules are meant to be broken.
15.05.2025 14:05 — 👍 18 🔁 8 💬 0 📌 0
Nice
14.05.2025 16:22 — 👍 1 🔁 1 💬 0 📌 0
Any plan on having a conference in Europa at some point?
29.04.2025 17:13 — 👍 0 🔁 0 💬 0 📌 0
Have a dataset, where the client do some small change in PBI service.
But today he cannot set the data model to edit model. No problem viewing it.
When I open it try to convert it to a "large model", but it fails (just Power BI Pro)
Any idea why?
#PowerBI #PowerBIHelp
29.04.2025 17:03 — 👍 0 🔁 0 💬 0 📌 0
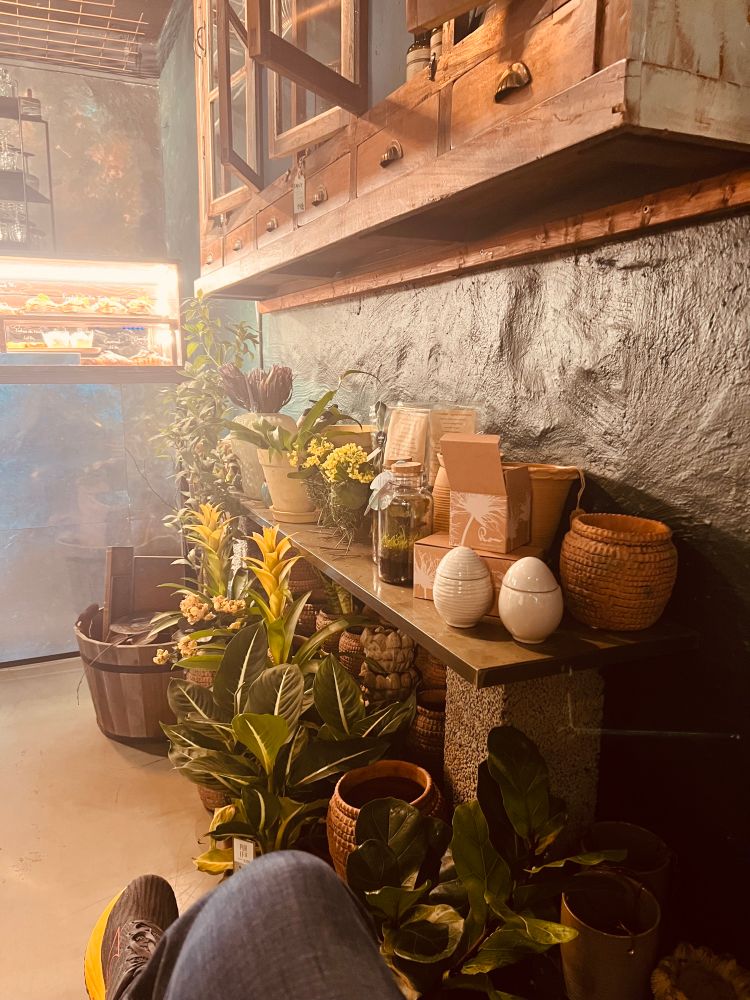
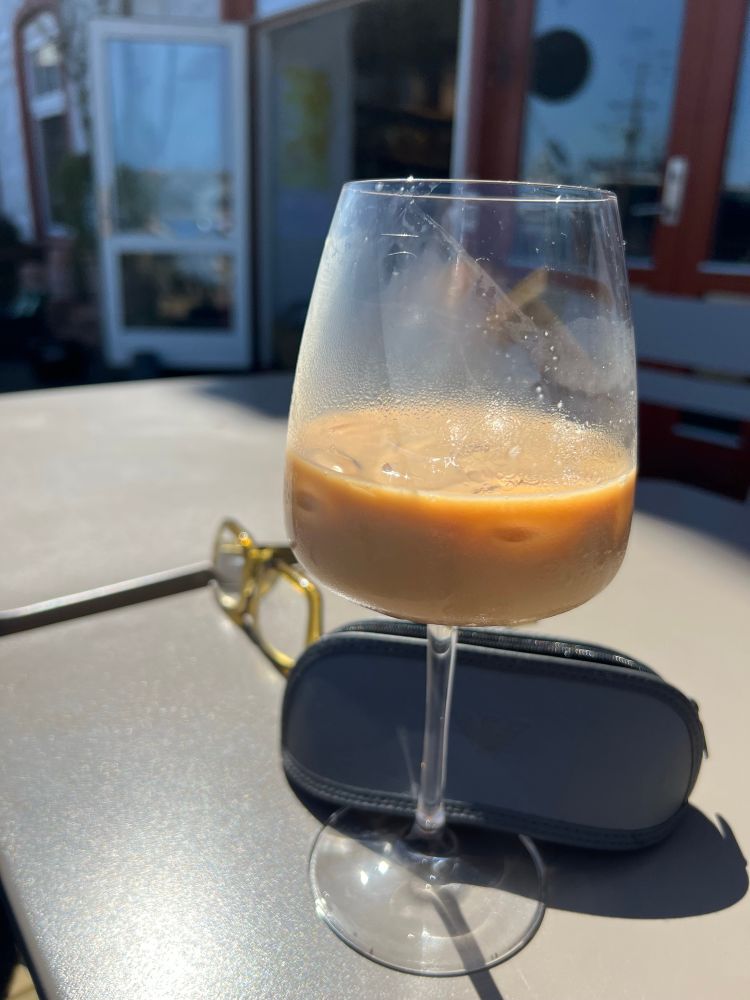
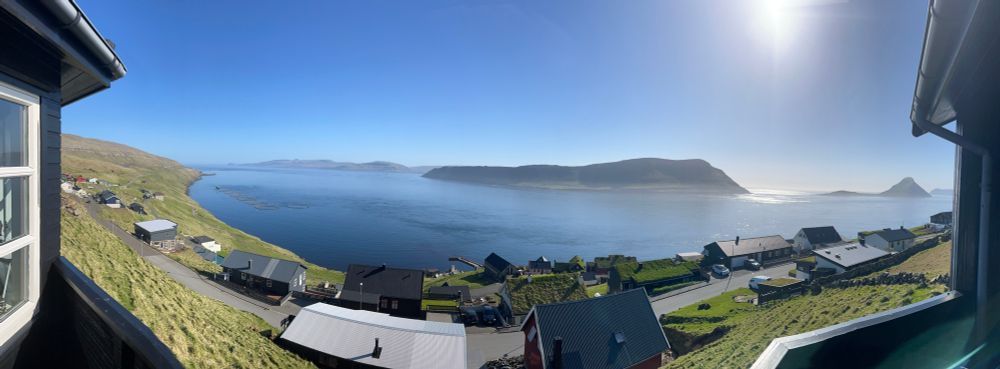
Starting Saturday with a nice cup of coffee at my local favorit cafe Moss.
26.04.2025 11:15 — 👍 11 🔁 0 💬 0 📌 0
Sometimes you encounter unexpected things in Power BI. I was building a report based on a data model created by x company. I assumed the fact table (GL ledger) had one row per posting, so sum Amt. But the model included additional grouping om the gact, which meant data was duplicated per groupid!!
09.04.2025 15:14 — 👍 0 🔁 0 💬 0 📌 0
Chat -> Chart
03.04.2025 19:12 — 👍 0 🔁 0 💬 0 📌 0
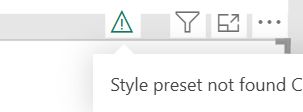
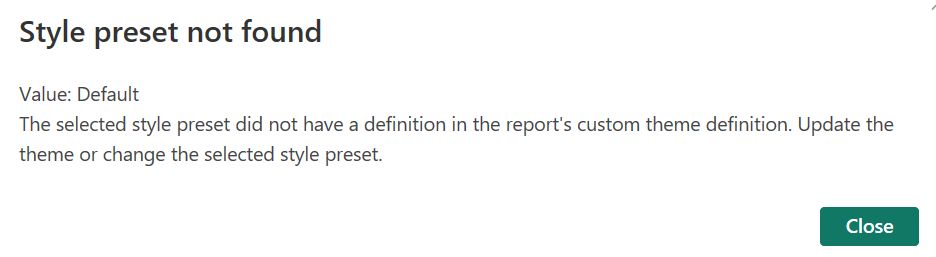
That is new ?? #PowerBI
Changning from a Matrix to Chat !!
03.04.2025 18:40 — 👍 1 🔁 0 💬 1 📌 0
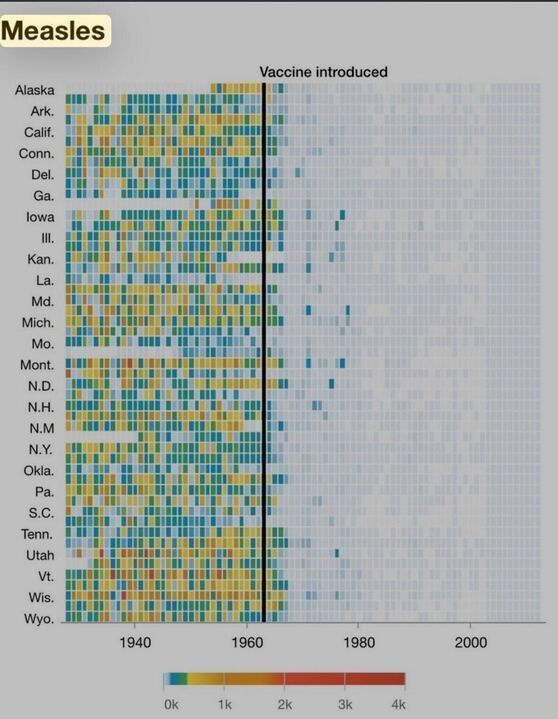
The image is a heatmap titled "Measles," showing measles cases across U.S. states from 1928 to 2003. States listed on the y-axis include Alaska, Arkansas, California, Connecticut, Delaware, Georgia, Iowa, Illinois, Kansas, Louisiana, Maryland, Michigan, Missouri, Montana, North Dakota, New Hampshire, New York, Oklahoma, Pennsylvania, South Carolina, Tennessee, Utah, Vermont, Wisconsin, and Wyoming. The x-axis spans years from 1928 to 2003. A vertical line marks the introduction of the measles vaccine around 1963. The color scale at the bottom ranges from blue (0 cases) to red (4,000+ cases), with shades of green, yellow, and orange indicating intermediate values (1,000, 2,000, 3,000 cases). Before 1963, many states show frequent high case numbers (yellow to red), while after 1963, cases drop significantly, with mostly blue indicating near-zero cases.
And yet Joe Rogan puts guests on who say "Vaccines aren't actually responsible for the reduction in infectious diseases.”
30.03.2025 17:30 — 👍 23238 🔁 6829 💬 921 📌 388
@jaypowerbi.bsky.social any evil plan to use visual calculation to add a new row to table. ??
Like a subtotal in a P&L and a Margin
19.03.2025 12:57 — 👍 1 🔁 0 💬 1 📌 0
At least it is to hard to change the column heading or adding fancy vbs code.
I dig it l, just need to retune my OCR to read stone and not paper
16.03.2025 11:33 — 👍 2 🔁 0 💬 0 📌 0

Time to go home.
Thanks to Helsinki and Finland for a nice time
10.03.2025 12:00 — 👍 0 🔁 0 💬 0 📌 0
Sitting in Helsinki and enjoying a cup of Canadian coffee.
09.03.2025 13:46 — 👍 2 🔁 0 💬 0 📌 0
Going to eat some local, with the bear
07.03.2025 18:21 — 👍 2 🔁 0 💬 0 📌 0
Planning is everything, but you cannot do anything when sickness in the picture l.
Plan to use a lot of time on my PowerBi entry for the world championship. But ended up with doing it on my flight to Helsinki today. So basically the report has been created in 3 different countries.
07.03.2025 15:46 — 👍 1 🔁 0 💬 0 📌 0

Sometimes to have to look at the backside of things to discover wear and tear. Damn did not know my laptop had so many dents.
#makingPowerBI in the air.
07.03.2025 10:10 — 👍 0 🔁 0 💬 0 📌 0
There are two quotes from the song Rocstar by Malk de Koijn
That makes you think!
The translations to English are:
“And it just so happens to be a hobby with a built-in job in it.”
“Not everything that glitters is gold, and not everything that is crap is… brown.”
22.02.2025 11:06 — 👍 0 🔁 0 💬 0 📌 0
Really nice post!
Thanks
I agree that every visual has its time and place when used correctly. In storytelling, I’ve always appreciated its elements, but rather than telling the full story, I now prefer to present part of it and let the user complete it themselves with their own insights.
19.02.2025 11:47 — 👍 0 🔁 0 💬 0 📌 0

I was casually browsing community.fabric.microsoft.com and checked my notifications—only to find out that I somehow earned my 1-year, 2-year, AND 3-year badges all on the same day?!
Either I’ve discovered time travel… or the system just had a really long nap before catching up.
18.02.2025 15:06 — 👍 1 🔁 0 💬 0 📌 0
Official Bluesky account for callfordataspeakers.com, where you can find out about new calls for speakers for data platform events.
Operated by @dhma.ch, for the benefit of the data platform community.
Qualified ACA. More recently, Data Consultant (SQL, Excel, PowerQuery, Python, R, Modelling, ETL, Machine Learning), mainly in Financial Services. Guitar, Piano. Colchester United FC. Occasional runner. Pun-tastic
I make databases go faster. I love teaching, travel, laughing, and collecting vintage sports cars. Las Vegas. He/him, pan.
can take a punch|New England|not a creative type
💻 Data Scientist || 🧮 Stats Engineer || 🥑 DevRel taipy.io || 🦄 Community Growth || open-source passionate || 🧳 Travel || 📸 Photography
Professional data geek: SQL, ETL/ELT, SSIS, SSRS, ADF, Python, data architecture. Former Microsoft Data Platform MVP (2010 - 2022). Amateur photographer. Coffee and craft beer snob. Blogs at TimMitchell.net.
🌈#Microsoft #Data #Platform #MVP, @Microsoft #Certified #Trainer #MCT #sqlsatdenmark, #Fabric, #PowerBI, #IoT, @AzureDevOps, @TheWho and @Steelers He/Him
Data Saturdays is a place for the data community to run small regional events with little outlay or set-up difficulties.
https://datasaturdays.com
Data Platform MVP, MCT, MCSE. Swedish Power BI UG leader. I make data matter, because only data that matters can inspire change. One third of #KneeDeepinTech
Microsoft Data Platform event, combining the best ingredients: Data, Bratwurst and Beer https://github.com/SQLGrillen https://YouTube.com/c/DataGrillen
Huge data nerd who enjoys wood carving and legos in her free time :)
"Never laugh at live dragons, Bilbo you fool!"
My name is Jorge Camões, I'm a #dataviz consultant, trainer, and author of the book Data at Work amzn.to/2i7Z0KO. #Excel, #PowerBI & #PowerQuery, #Tableau. Based in Lisbon, Portugal. wisevis.eu
📊 data visualization engineer, 💊 healthcare analytics consultant, 🐶 dog mom, 🌱 vegan for the animals. Free Palestine 🇵🇸
https://nicolemark.heygrid.co/
Entrepreneur | #DevOps Enthusiast | Data Platform MVP | Inventor of #TMDL | Developer of https://pbi.tools
DataViz Specialist 📊 Teaching Elegance & Excellence in Data Storytelling
Head of Data and Graphics at The Observer. Used to work at 🐢, WSJ, FT, Atlantic. Illinoisan. Londoner. Sleepy. [Email me: katie@observer.co.uk]
Dual Microsoft MVP, Inaugural GitHub Star, creator of dbatools, author http://dbatools.io/book and AI for Everyday IT from Manning Publications.
Creator of @mutesky.app 🏳️🌈
Totally into AI, SQL Server and PowerShell.
📍 Very North of France
I'm making music from the data🎶 #PowerBI addict, Microsoft Data Platform MVP, O'Reilly Instructor, Pluralsight Author, blogger, speaker, learner...Father of 2, Barca and Messi fan⚽