Winners of the 2025 Table Contest - Posit
We had many submissions to the Posit 2025 Table Contest and this post will show you the winners, the special prize recipients, and the runners up!
Announcing the Winners of the 2025 Posit Table Contest! 🏆
The data community showcased stunning work in #RStats/ #Python using gt, Reactable, and #Quarto, transforming complex data into beautiful, effective communication.
Congrats to all the winners!
See the innovation: posit.co/blog/2025-ta...
11.11.2025 15:48 — 👍 20 🔁 5 💬 0 📌 0

A quarto typst output showcasing usage of the new r2typ R package that converts R code to Typst markup. It draws a blue circle with red border and a text in the center "My favorite food is cookies".
I've started working on an R package that makes it easy to write Typst markup dynamically! #rstats
It's still in its early stages, but it implements:
- ✅ all Typst functions
- ✅ set rules
- ✅ conversion from R to Typst (`NULL` becomes `none`, etc)
- ✅ no dependencies
github.com/y-sunflower/r2typ
29.10.2025 07:55 — 👍 24 🔁 7 💬 5 📌 0

Quarto 1.8 – Quarto
Quarto 1.8 improves brand support, introduces brand extensions, adds HTML accessibility checks, and gives access to execution context.
Quarto 1.8 is available! 🎉
New features include: ✨ Light & dark mode support for brand colors and logos 📦 Brand extensions for sharing across projects ♿ HTML accessibility checks with Axe-core 🔧 Access to execution context from code cells
Full details: quarto.org/docs/blog/po...
13.10.2025 16:00 — 👍 33 🔁 8 💬 0 📌 1

APA-formatted table with quotes from a qualitative study
Recreating each of the tables in Chapter 7 of the Publication Manual of the American Psychological Association (7th Edition) in R with apa7 (Part 24 of 24)
Featuring hanging indents
#rstats #apastyle
wjschne.github.io/posts/apatab...
04.10.2025 11:01 — 👍 1 🔁 0 💬 0 📌 0

APA-formatted table with descriptive statistics and sample quotes
Recreating each of the tables in Chapter 7 of the Publication Manual of the American Psychological Association (7th Edition) in R with apa7 (Part 23 of 24)
Featuring hanging indents and vertical merging
#rstats #apastyle
wjschne.github.io/posts/apatab...
03.10.2025 11:02 — 👍 2 🔁 0 💬 0 📌 0

APA-formatted table showing narratives from a qualitative study
Recreating each of the tables in Chapter 7 of the Publication Manual of the American Psychological Association (7th Edition) in R with apa7 (Part 22 of 24)
Featuring hanging indents
#rstats #apastyle
wjschne.github.io/posts/apatab...
02.10.2025 11:02 — 👍 1 🔁 1 💬 0 📌 0
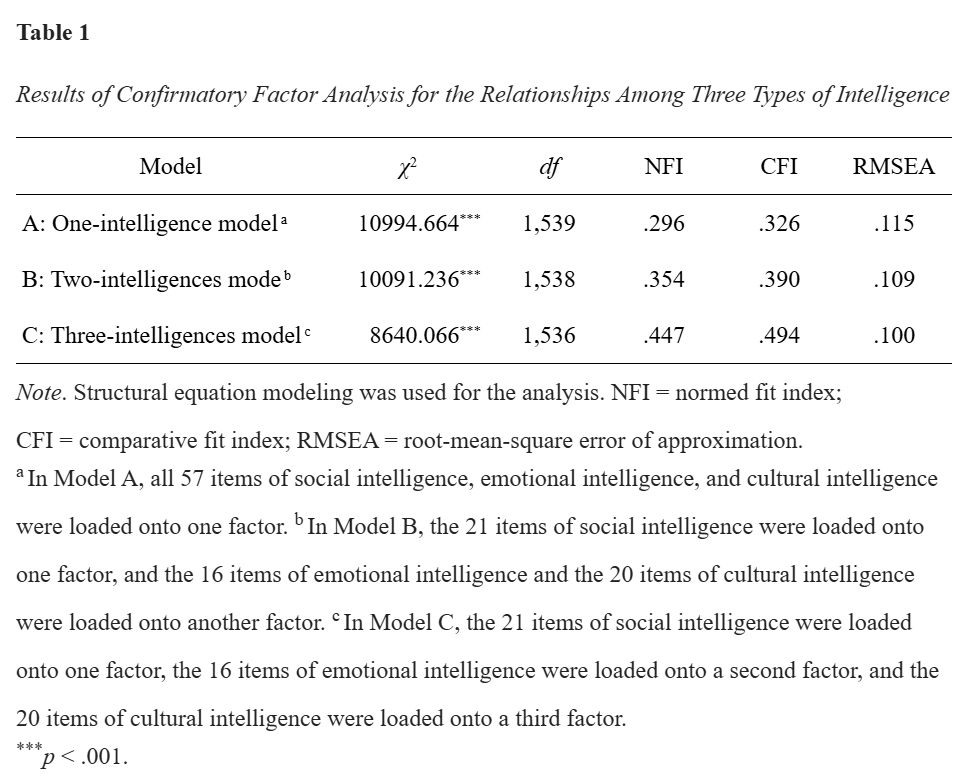
APA-formatted table of confirmatory factor analysis performance statistics
Recreating each of the tables in Chapter 7 of the Publication Manual of the American Psychological Association (7th Edition) in R with apa7 (Part 21 of 24)
Featuring thin spaces for footnote superscripts and `add_star_column`
#rstats #apastyle
wjschne.github.io/posts/apatab...
01.10.2025 11:03 — 👍 3 🔁 0 💬 0 📌 0

An APA-formatted table with results from a multilevel model analysis
Recreating each of the tables in Chapter 7 of the Publication Manual of the American Psychological Association (7th Edition) in R with apa7 (Part 20 of 24)
Presenting multilevel models
#rstats #apastyle
wjschne.github.io/posts/apatab...
30.09.2025 11:01 — 👍 1 🔁 0 💬 0 📌 0

a table about lemurs

a table about students and schools

a table about wines
{tinytable} 0.14.0 for #RStats makes it super easy to draw tables in html, tex, docx, typ, md & png.
There are only a few functions to learn, but don't be fooled! Small 📦s can still be powerful.
Check out the new gallery page for fun case studies.
vincentarelbundock.github.io/tinytable/vi...
29.09.2025 12:44 — 👍 135 🔁 38 💬 1 📌 5

APA-formatted table with model performance statistics
Recreating each of the tables in Chapter 7 of the Publication Manual of the American Psychological Association (7th Edition) in R with apa7 (Part 19 of 24)
Presenting a sequence of regression models
#rstats #apastyle
wjschne.github.io/posts/apatab...
29.09.2025 11:01 — 👍 1 🔁 0 💬 0 📌 0

APA-formatted table displaying hierarchical regression analyses
Recreating each of the tables in Chapter 7 of the Publication Manual of the American Psychological Association (7th Edition) in R with apa7 (Part 18 of 24)
Featuring hierarchical regression analyses
#rstats #apastyle
wjschne.github.io/posts/apatab...
28.09.2025 11:00 — 👍 1 🔁 0 💬 0 📌 0

APA-formatted table showing multilevel modeling results
Recreating each of the tables in Chapter 7 of the Publication Manual of the American Psychological Association (7th Edition) in R with apa7 (Part 17 of 24)
Featuring footnotes and intentionally inconsistent rounding
#rstats #apastyle
wjschne.github.io/posts/apatab...
27.09.2025 11:00 — 👍 2 🔁 1 💬 0 📌 0

Automate the creation of google documents for class
Automate the creation of google documents for class - auto_google_docs.R
Here's a little #rstats script I wrote to automate creating Google docs for my students for an assignment. The idea is that the history in the Google doc will help secure the integrity of the assignment by discouraging gen AI use.
#academicsky
Link:
gist.github.com/saudiwin/986...
26.09.2025 14:57 — 👍 12 🔁 3 💬 0 📌 0


{gm} - Create music with R: flujoo.github.io/gm/
#RStats bookmark from old twitter
25.09.2025 21:50 — 👍 33 🔁 14 💬 0 📌 1

APA-formatted table of regression analyses
Recreating each of the tables in Chapter 7 of the Publication Manual of the American Psychological Association (7th Edition) in R with apa7 (Part 16 of 24)
Featuring two levels of grouping with `flextable::as_grouped_data`
#rstats #apastyle
wjschne.github.io/posts/apatab...
26.09.2025 11:01 — 👍 0 🔁 0 💬 0 📌 0

APA-formatted table of a regression analysis
Recreating each of the tables in Chapter 7 of the Publication Manual of the American Psychological Association (7th Edition) in R with apa7 (Part 15 of 24)
Featuring automatic formatting of regression analyses
#rstats #apastyle
wjschne.github.io/posts/apatab...
25.09.2025 11:02 — 👍 1 🔁 0 💬 0 📌 0

APA-formatted table with factor analysis loadings
Recreating each of the tables in Chapter 7 of the Publication Manual of the American Psychological Association (7th Edition) in R with apa7 (Part 14 of 24)
Featuring decimal alignment with left-aligned text
#rstats #apastyle
wjschne.github.io/posts/apatab...
24.09.2025 11:13 — 👍 1 🔁 0 💬 0 📌 0

APA-formatted 2-way ANOVAs
Recreating each of the tables in Chapter 7 of the Publication Manual of the American Psychological Association (7th Edition) in R with apa7 (Part 13 of 24)
Featuring `column_spanner_label`, which adds a prefix to selected columns
#rstats #apastyle
wjschne.github.io/posts/apatab...
23.09.2025 11:01 — 👍 2 🔁 0 💬 0 📌 0

APA-formatted table with descriptive statistics and ANOVAs
Recreating each of the tables in Chapter 7 of the Publication Manual of the American Psychological Association (7th Edition) tables in R with apa7 (Part 12 of 24)
Featuring Selective indentation with `flextable::padding`
#rstats #apastyle
wjschne.github.io/posts/apatab...
22.09.2025 11:01 — 👍 1 🔁 0 💬 0 📌 0

APA-formatted correlation matrix
Recreating each of the tables in Chapter 7 of the Publication Manual of the American Psychological Association (7th Edition) tables in R with apa7 (Part 11 of 24)
Featuring numbered columns and aligned star columns.
#rstats #apastyle
wjschne.github.io/posts/apatab...
21.09.2025 11:00 — 👍 4 🔁 0 💬 0 📌 0

APA-formatted correlation matrix
Recreating each of the tables in Chapter 7 of the Publication Manual of the American Psychological Association (7th Edition) tables in R with apa7 (Part 10 of 24)
Featuring correlation matrices and descriptive statistics with `apa_cor`
#rstats #apastyle
wjschne.github.io/posts/apatab...
20.09.2025 11:00 — 👍 4 🔁 0 💬 0 📌 0

APA-formatted table with descriptive statistics and 1-way ANOVA results
Recreating each of the tables in Chapter 7 of the Publication Manual of the American Psychological Association (7th Edition) tables in R with apa7 (Part 9 of 24)
Featuring customizable automatic column formatters
#rstats #apastyle
wjschne.github.io/posts/apatab...
19.09.2025 11:18 — 👍 2 🔁 0 💬 0 📌 0

APA-formatted table of descriptive statistics and t-test results
Recreating each of the tables in Chapter 7 of the Publication Manual of the American Psychological Association (7th Edition) tables in R with apa7 (Part 8 of 24)
Featuring intentionally inconsistent rounding within columns
#rstats #apastyle
18.09.2025 11:01 — 👍 2 🔁 0 💬 2 📌 0

APA-formatted table with descriptive statistics and chi-square test results.
Recreating each of the tables in Chapter 7 of the Publication Manual of the American Psychological Association (7th Edition) tables in R with apa7 (Part 7 of 24)
Featuring p-values converted to asterisks via `add_star_column`
#rstats #apastyle
wjschne.github.io/posts/apatab...
17.09.2025 11:01 — 👍 2 🔁 0 💬 0 📌 0
Practical Power Analysis in R
#statstab #417 {pwrss} Practical Power Analysis in R
Thoughts: Some useful vignettes for conducting power analyses for various designs, constraints, and data types.
#poweranalysis #samplesize #r #power #guide #tutorial #sesoi #equivalence #tost #rstats
cran.r-project.org/web/packages...
16.09.2025 19:44 — 👍 16 🔁 6 💬 1 📌 0

APA-formatted table showing descriptive statistics
Recreating each of the tables in Chapter 7 of the Publication Manual of the American Psychological Association (7th Edition) tables in R with apa7 (Part 6 of 24)
Featuring columns centered on a space character.
#rstats #apastyle
wjschne.github.io/posts/apatab...
16.09.2025 11:02 — 👍 2 🔁 0 💬 0 📌 0
cog psych phd, table displayer, plant enthusiast.
data science tools @posit.co.
senior advisor at CodeForPhilly.
Feminist, scientist, atheist, anti-racist, educator, crone.
Posts about #rstats. Weekly newsletter digest at https://rstats.blaze.email. Maintained by @alastairrushworth.com.
We help organizations communicate more effectively with their data. Learn more at claritydatastudio.com.
Our mission: To provide tools and resources to foster a diverse, friendly, and inclusive community of data science learners and practitioners. Join us at https://dslc.io
I am an assistant professor at the department of Social Psychology at Tilburg University's School of Social and Behavioral Sciences.
I have a website at https://vuorre.com.
All posts are posts.
Personality psych & causal inference @UniLeipzig. I like all things science, beer, & puns. Even better when combined! Part of http://the100.ci, http://openscience-leipzig.org
Dad! Prof, U of Washington Bothell School of Business. AI/ML pioneer in Marketing.
Academic Editor PLOS ONE; Management & Business Review.
Analytics, Negotiations. Marketing, Analytics, Capt America case. UW Teaching Medal
orcid: 0000-0002-2856-55
(she/her/ella) 🎓Ph.D. | Assistant Research Professor @penn_state | @BlackinPsych co-founder | ISDP DEI Committee | ❤️ #rstats
#rstats user and developer. umairdurrani.com
Senior research scientist in mental health and wellbeing, looking for an excuse to #rstats
Sociologist, researcher, member @denktankminerva.be & @brispo-vub.bsky.social: labour relations, quality of work & open source data analysis.
Hey nerds. It’s a quantitative methods podcast. With attitude. And merch (http://tinyurl.com/qpodmerch).
Psych prof studying statistics education at Toronto Metropolitan. Women’s 🏀 fan. She/her psystat.org
Science studies scholar: #credibility of sci, #trust #collaboration #integrity #food #STS #reform, @ Maastricht University
Also: @bart@akademieNL.social
Professor of Psychological Methods @Phillips-Universtät Marburg
Mathematical psychology | Cognitive modeling | Psychometrics | Bayesian statistics
Personal: www.dwheck.de
Team: https://www.uni-marburg.de/de/fb04/team-heck