Map of Alexander Island showing the island geology.
Same island, new map (and new discoveries!) 🗺️
The Mapping and Geographic Information Centre (@magic.bas.ac.uk) and Geology Team have produced new maps of Alexander Island in Antarctica – the first update in 40 years!
05.08.2025 15:19 — 👍 27 🔁 4 💬 2 📌 1
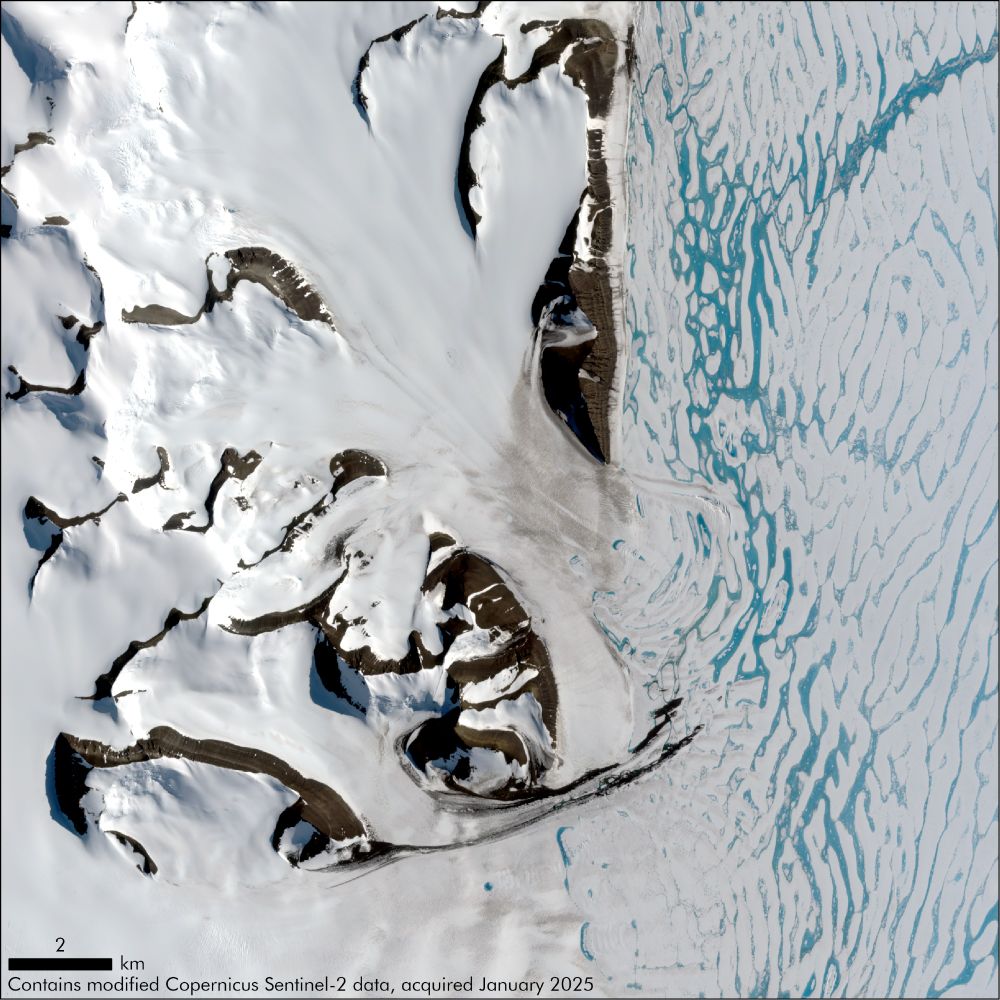
A satellite image of the Fossil Bluff region on Alexander Island. Rocky outcrops can be seen in brown, with areas of moraine being moved eastwards (right, in the image) onto the ice shelf. George VI Ice Shelf can be seen, covered in bright blue meltpools.
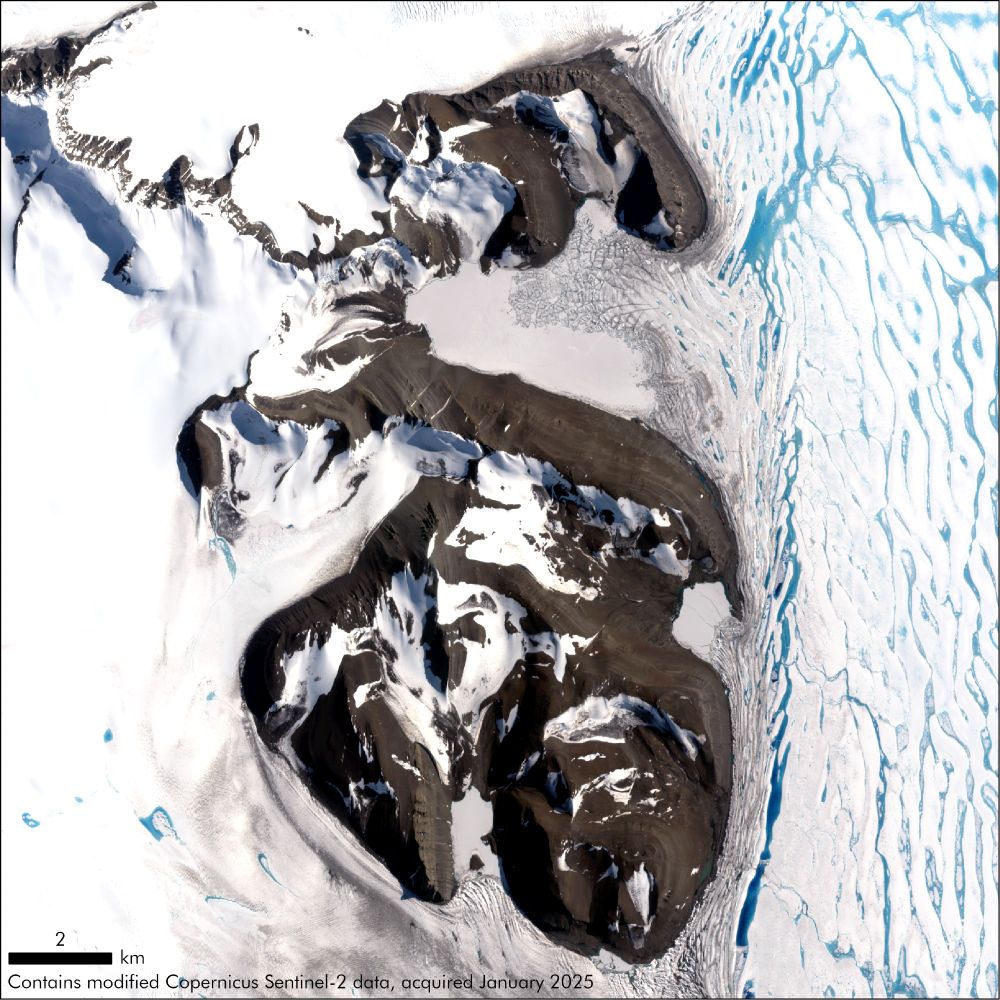
A satellite image of Ganymede Heights and Ablation Valley on Alexander Island. Rocky outcrops can be seen in brown. The ice-covered Ablation Lake can be seen in a large valley, near the top of the image. George VI Ice Shelf can be seen in the east/right, covered in bright blue meltpools.
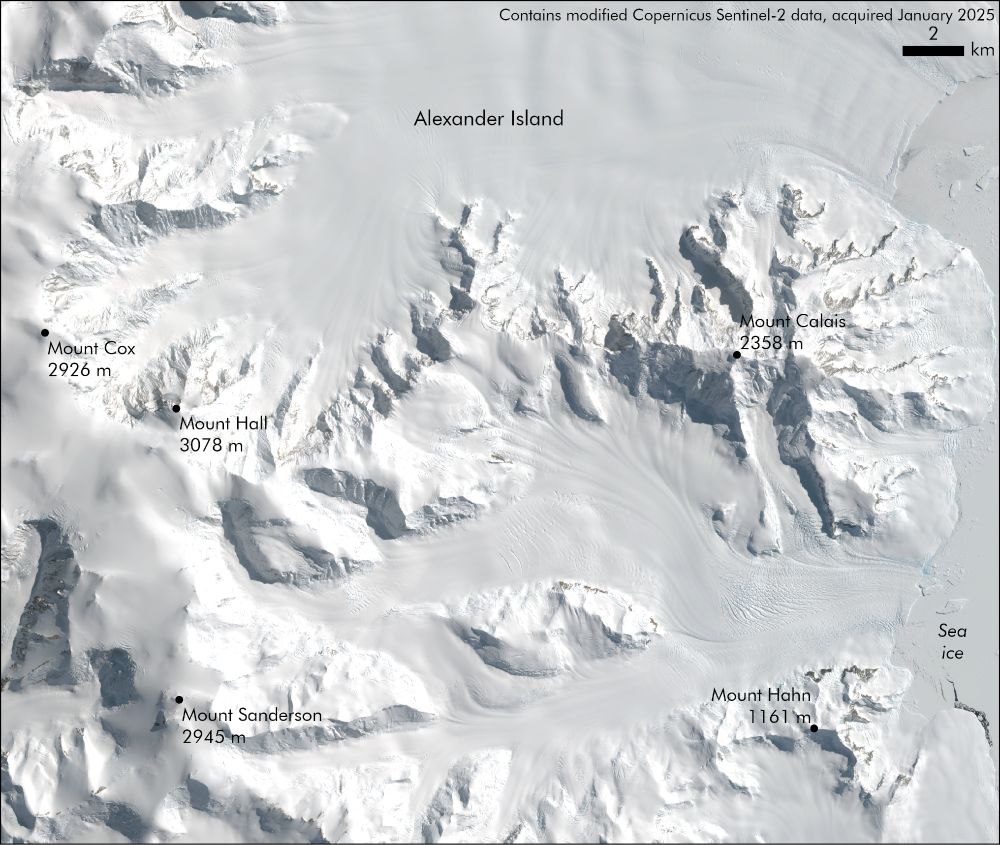
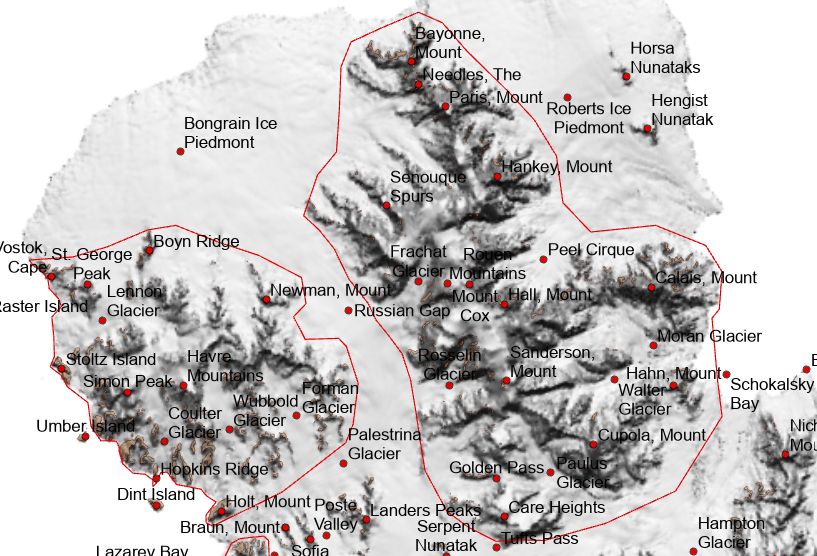
A satellite image of some of the highest peaks on Alexander Island. The image is white and largely snow-covered, with small areas of rock outcrop visible in some areas. The image labels 5 mountains, including Mount Hall at 3078 metres tall (the highest mountain on the island).
Alexander Island is home to stunning landscapes, captured here in these Sentinel-2 satellite images.
We produced brand new topographic data for the region, including recently updated coastlines & spot height data for over 900 peaks! See more about the map: data.bas.ac.uk/maps/alexander-island
2/2
05.08.2025 15:49 — 👍 3 🔁 0 💬 0 📌 0
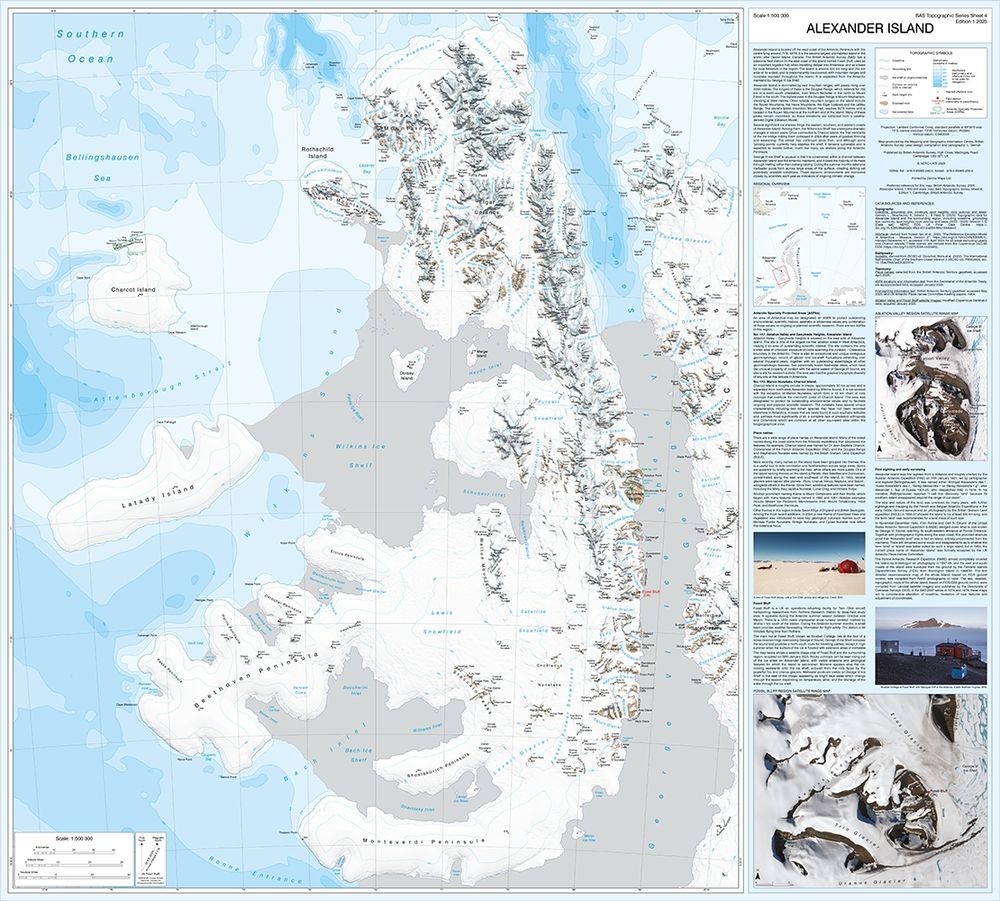
A topographic map of Alexander Island, Antarctica. The bathymetry depths are shown in varying shades of cyan. Ice shelves are shown in light grey. The land is white, with a hillshade detailing some of the terrain. A large information panel can be seen to the right of the main map, with information text and further small maps and satellite images.
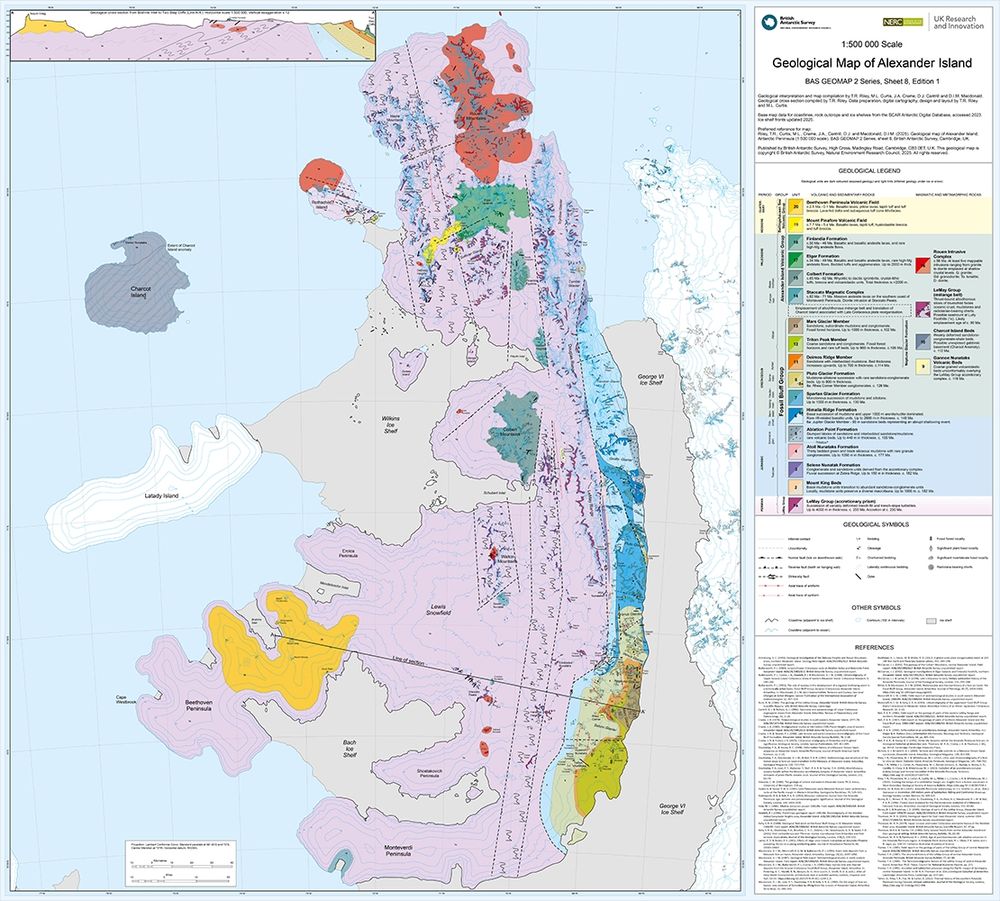
A geological map of Alexander Island. Open water is blue, ice shelves are grey, and a variety of bright colours are used on land to represent the geology. A large information panel can be seen to the right of the main map, with a detailed legend regarding the geology colours, and a long reference list.
📢 New Map Alert 🗺️
We have produced new maps of Alexander Island, along with the geology team here at @bas.ac.uk! These 1:500 000 scale maps cover the second largest uninhabited island in the world at a level of detail never before seen. See the full story here: www.bas.ac.uk/media-post/t...
1/2
05.08.2025 15:49 — 👍 5 🔁 0 💬 1 📌 1
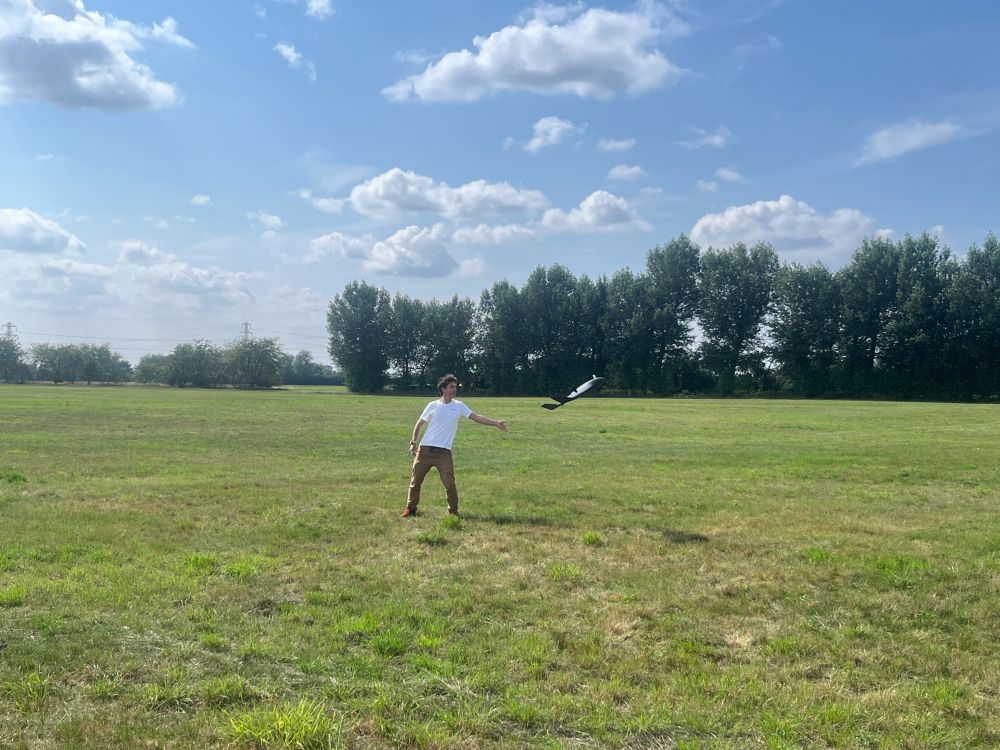
A photo of a man launching the ebee UAV in a grassy field. There are trees in the distance and white fluffy clouds in a blue sky.
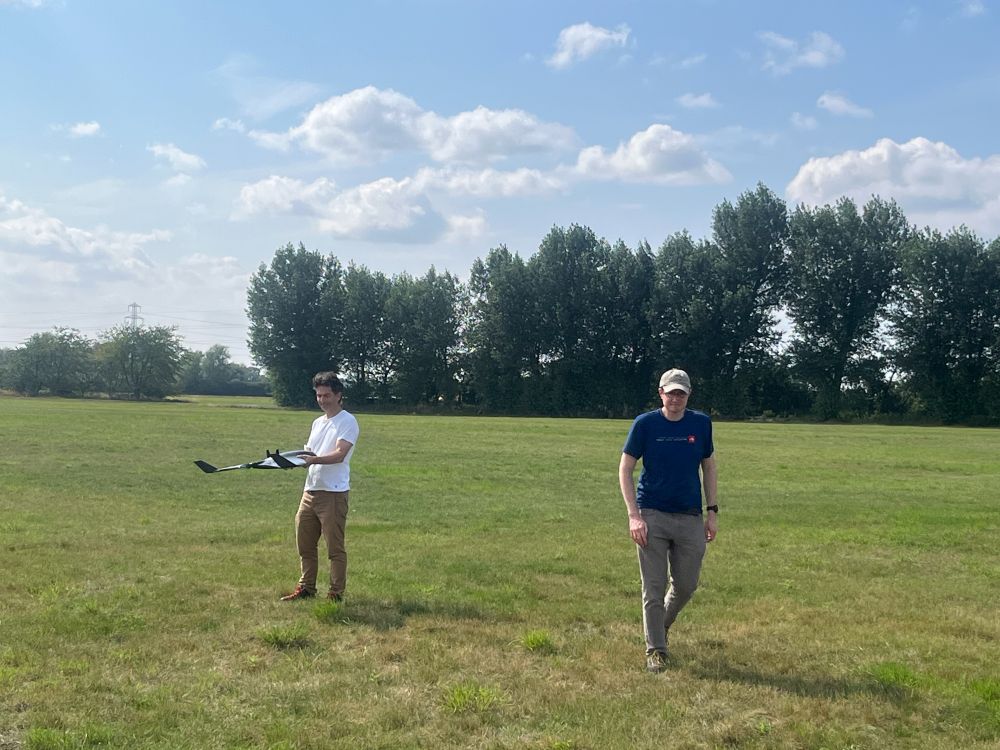
A photo of 2 men, one of them holding an ebee UAV, in a grassy field. There are trees in the distance and white fluffy clouds in a blue sky.
Made primarily of polystyrene they weigh just 1.6 kg on take-off, but despite this they are capable of operating in the stronger winds we experience down in the Antarctic with a maximum continuous wind limit of 17 m/s. In fact, yesterday we clocked a top ground speed of >63 mph!
2/2
01.08.2025 15:58 — 👍 1 🔁 1 💬 0 📌 0
MAGIC was out test flying our eBee VISION platforms in advance of the upcoming Antarctic field season this week. The eBee VISION UAVs can fly for 90 minutes and operate up to 20 km from the pilot. Here's a short clip of one of them in action! 🛩️
1/2
01.08.2025 15:58 — 👍 2 🔁 1 💬 1 📌 1
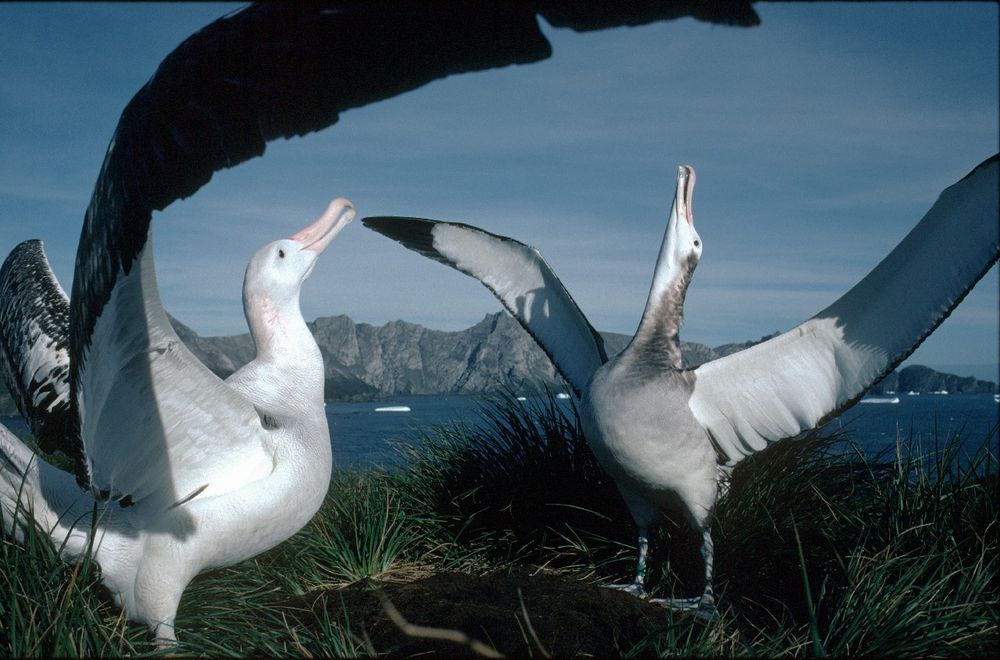
A photo of albatross. Mountains can be seen in the background, with water in between. Photo credit: BAS.
Come and join BAS, working with both MAGIC and the Wildlife from Space Team!
We are looking for an expert in ecological remote sensing with experience of spectral analysis to support our Darwin Plus South Georgia Seabird project. 🐦🦤
bas.ciphr-irecruit.com/applicants/v...
31.07.2025 15:58 — 👍 9 🔁 4 💬 0 📌 0
Reference Elevation Model of Antarctica – Polar Geospatial Center
For more information about the Air Operations Planning Maps, see: scar.org/library-data...
And for REMA (a Digital Elevation Model of Antarctica at 2 metre spatial resolution), see: www.pgc.umn.edu/data/rema/
REMA is produced by the fantastic @polargeospatial.bsky.social
30.07.2025 09:08 — 👍 1 🔁 0 💬 0 📌 0
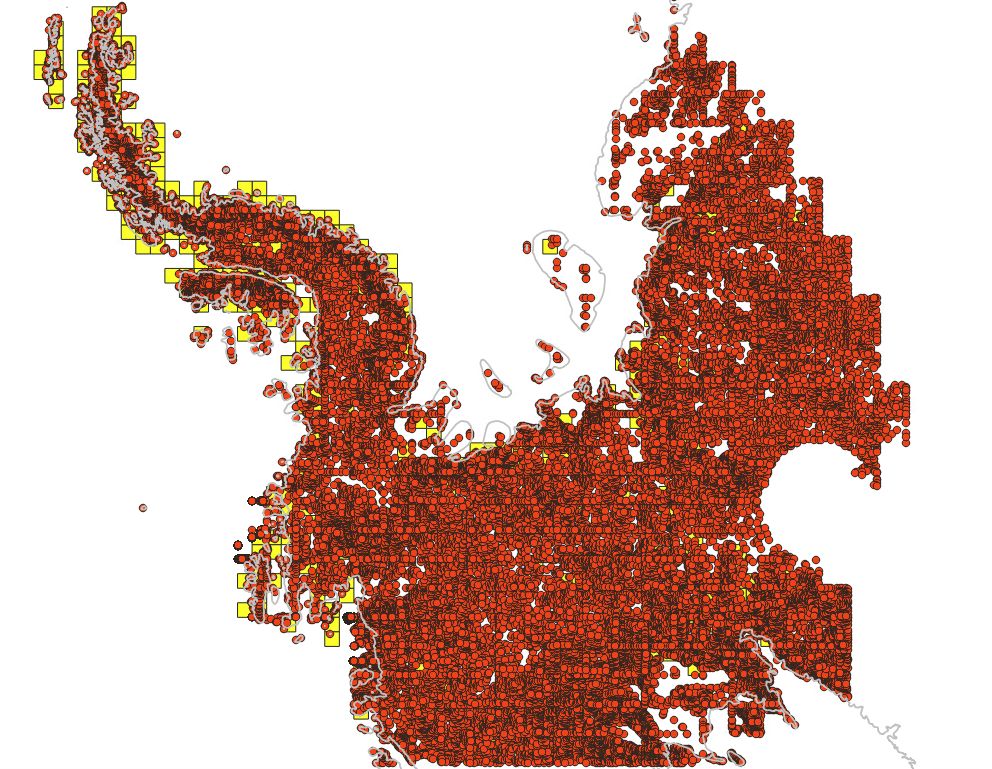
A screenshot of 59,261 spot heights in West Antarctica and the Antarctic Peninsula. This is the initial version, before reducing the density. Each point is shown as a red dot, the coastline of Antarctica is displayed as a grey line, and the yellow squares are the extent of some of the REMA tiles.
Lots of dots! These are spot heights generated for our Air Operations Planning Maps, using REMAv2 2m tiles. Next steps are to clean up the density, add existing GPS points & then add them to our maps, which are used for planning by pilots across the continent. The data will then be openly published!
30.07.2025 09:08 — 👍 2 🔁 2 💬 1 📌 0
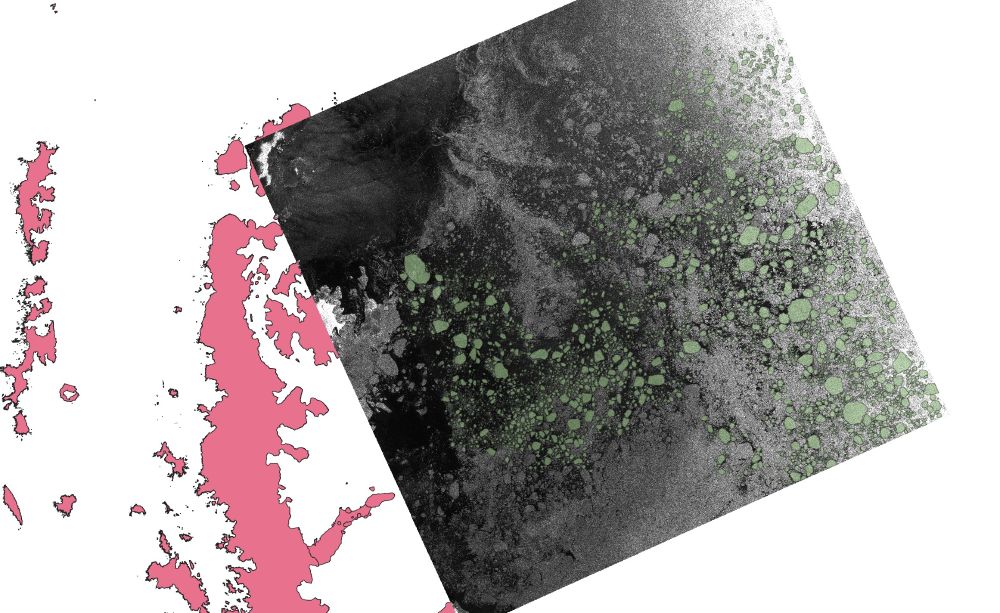
A screenshot of a SAR image at the north-east end of the Antarctic Peninsula. The digitised ice floes are highlighted in semi-transparent green. The image is from 31st Dec. 2020.
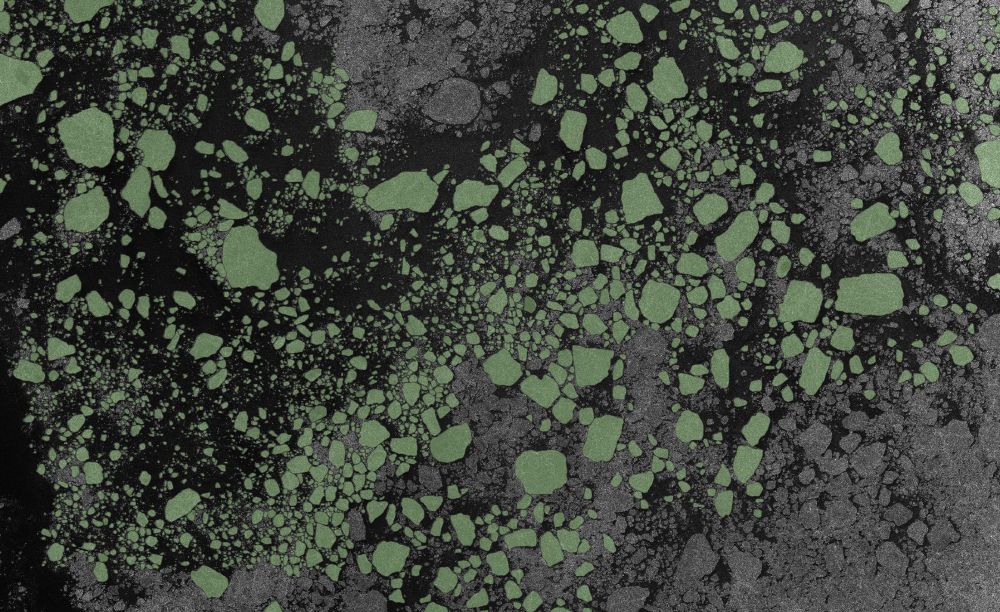
A zoomed in portion of the SAR image in the Weddell Sea. The digitised ice floes are highlighted in semi-transparent green. The image is from 31st Dec. 2020.
We are currently hosting an intern digitising ice floes from satellite radar (SAR) imagery in the Weddell Sea.
The resulting labelled data will be used in the NERC DEFIANT and QUASAR projects to assess the performance of machine learning methods and quantify errors in sea ice concentration data.
24.07.2025 14:26 — 👍 4 🔁 1 💬 0 📌 1
From glaciers to ridges, defining exact feature boundaries enhances scientific research, and supports safe navigation & logistics. Every polygon we draw will help to build a cleaner and smarter map of Antarctica.
18.07.2025 15:54 — 👍 4 🔁 0 💬 0 📌 0
An in-progress screenshot of two polygon boundaries in northern Alexander Island - the boundaries are for the Rouen Mountains and Havre Mountains. The map contains a hillshade, and place name locations are displayed with red points.
We've been busy on a new project making polygon boundaries for place names, using Alexander Island as a case study.
Creating polygons for Antarctic names is about more than cartographic precision. It’s about improving how we understand, search, & use data in one of Earth’s most remote environments.
18.07.2025 15:54 — 👍 6 🔁 1 💬 1 📌 1
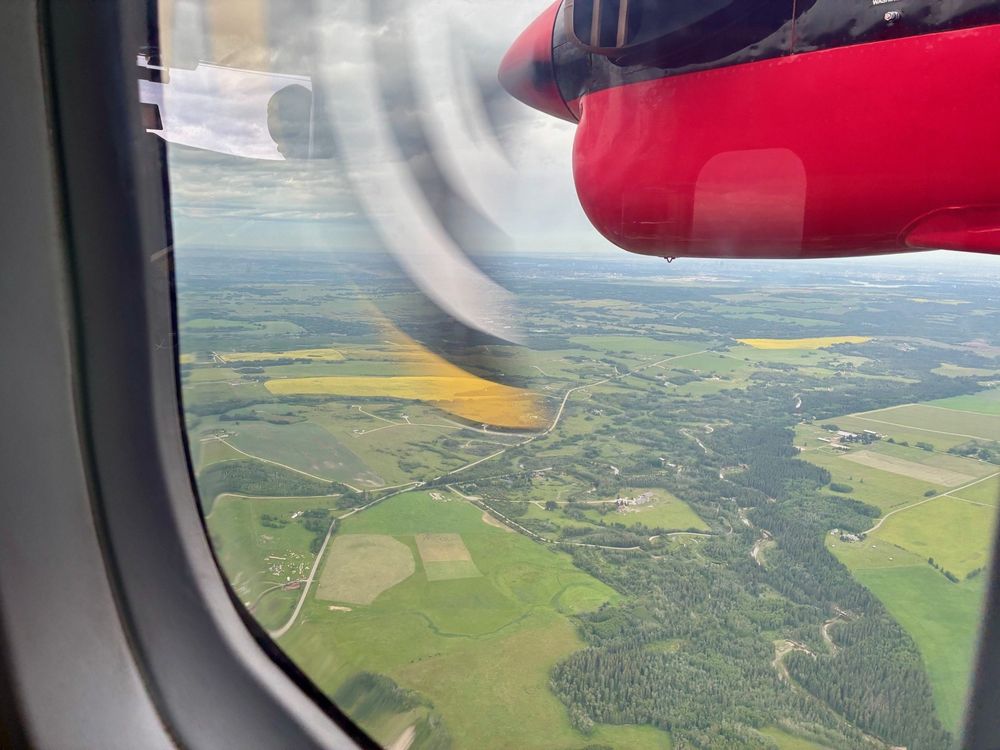
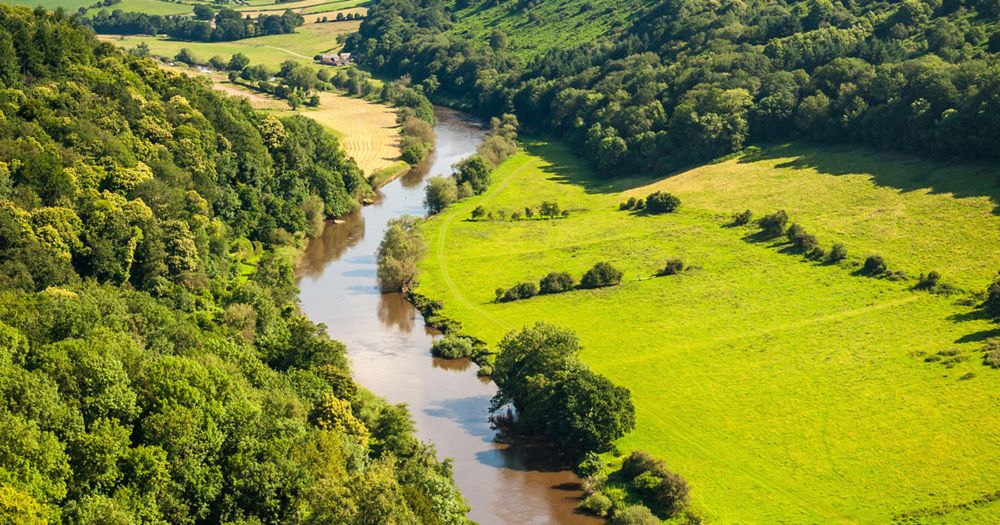
A photo out of the window during a test flight in the Twin Otter. A black and white propeller blade can be seen in motion. The view on the ground shows green fields and forested areas.
After successful test flights near Calgary, the new camera system is already on its way back to the UK for further integration and will then be quickly shipped to the Antarctic in preparation for the upcoming season! ❄️
3/3
14.07.2025 13:34 — 👍 4 🔁 0 💬 0 📌 0
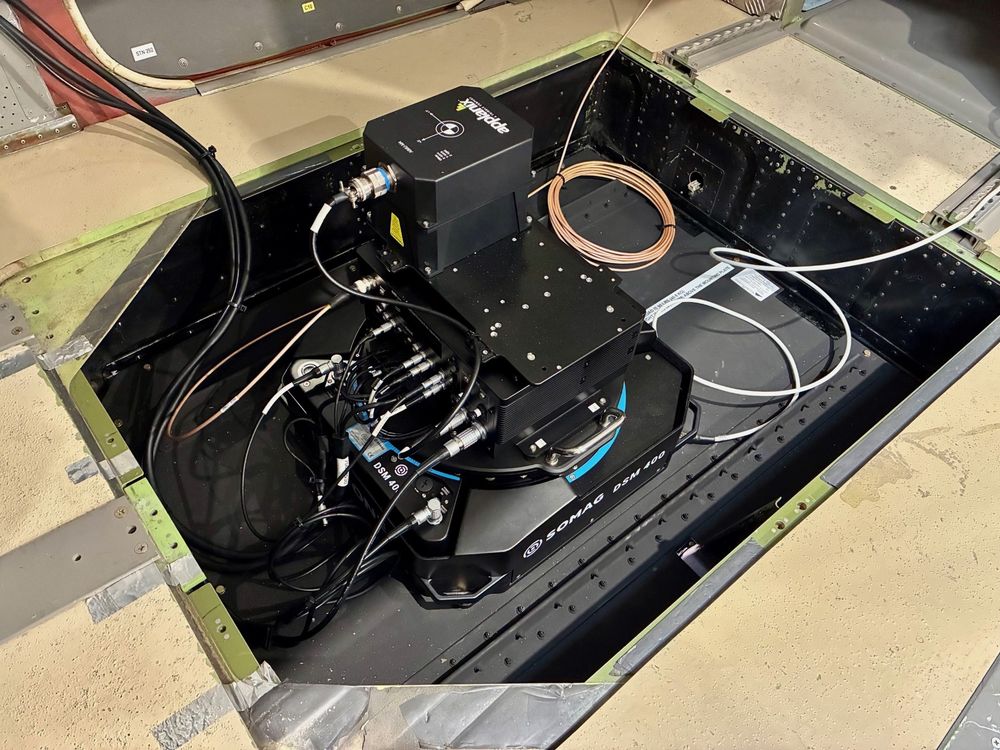
A photo of the aerial camera set up in the floor of the plane. The words 'applanix' and 'SOMAG' can be seen. There are lots of cables coming out of black boxes.
The PAS is made of twin iXM-RS150 150 MP metric aerial cameras and will be used to support a wide variety of work across BAS. During the coming Antarctic season it will be used to take detailed measurements of the Sheldon Glacier and capture details of stations to support deep-field operations.
2/3
14.07.2025 13:34 — 👍 4 🔁 0 💬 1 📌 0
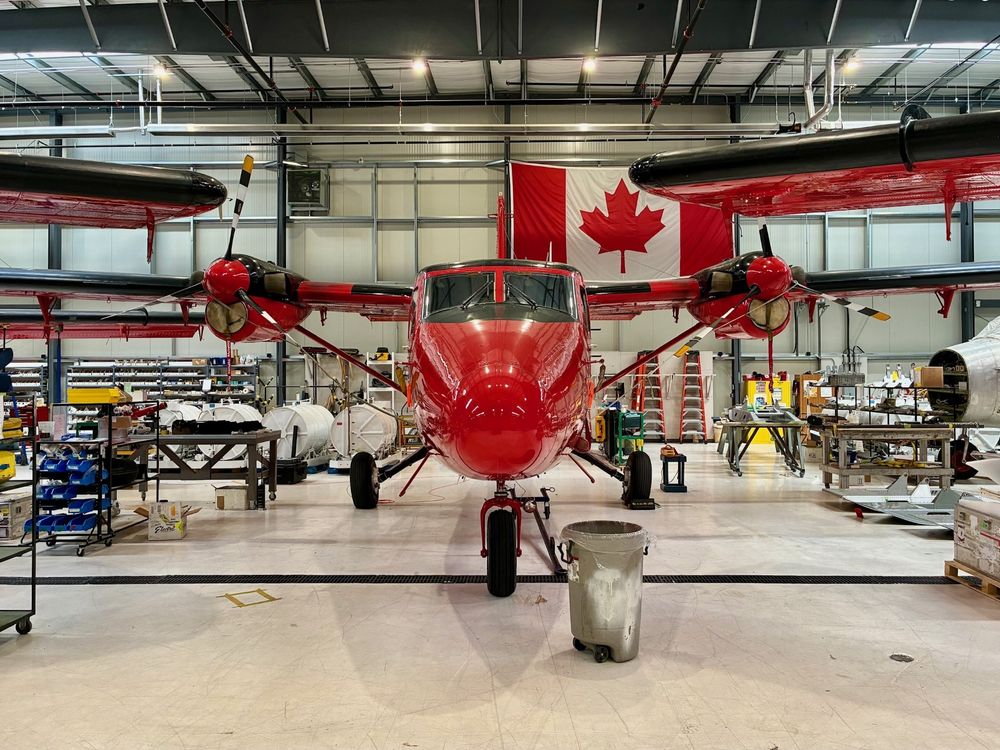
A photo of BAS's red Twin Otter plane in a hangar/workshop. A Canadian flag can be seen in the background.
We have been working along with engineers from Phase One and Rocky Mountain Aircraft over the past week to install and test our new Phase One PAS aerial camera into BAS's Twin Otter aircraft. 🛩️
1/3
14.07.2025 13:34 — 👍 7 🔁 3 💬 1 📌 0
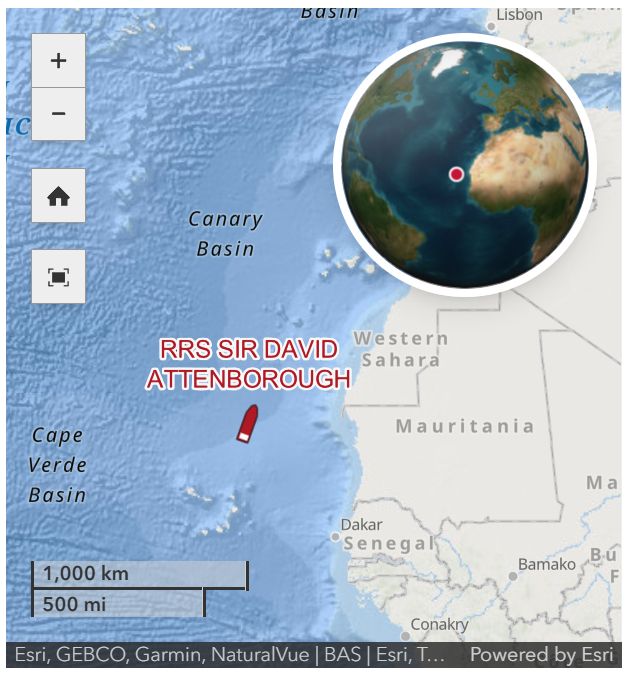
A screenshot of a map showing the location of the RRS Sir David Attenborough, travelling north off the west of Africa. A globe inset shows the location in a wider context.
Did you know that it's possible to follow the RRS Sir David Attenborough on @bas.ac.uk's website? We provide the maps and location tracking to underpin this. 🚢🗺️
See the latest position of the ship here, on its way north after a long season in Antarctica! www.bas.ac.uk/polar-operat...
09.07.2025 16:29 — 👍 9 🔁 4 💬 0 📌 0
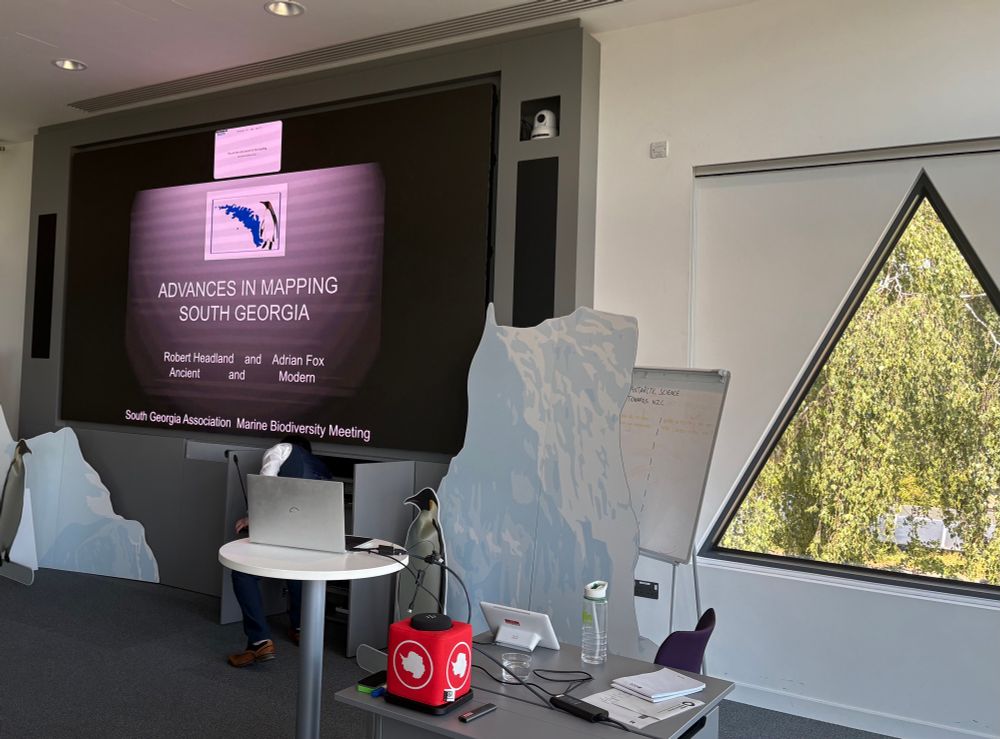
An image of the title slide with the text “advances in mapping South Georgia” “Robert Headland and Adrian Fox”
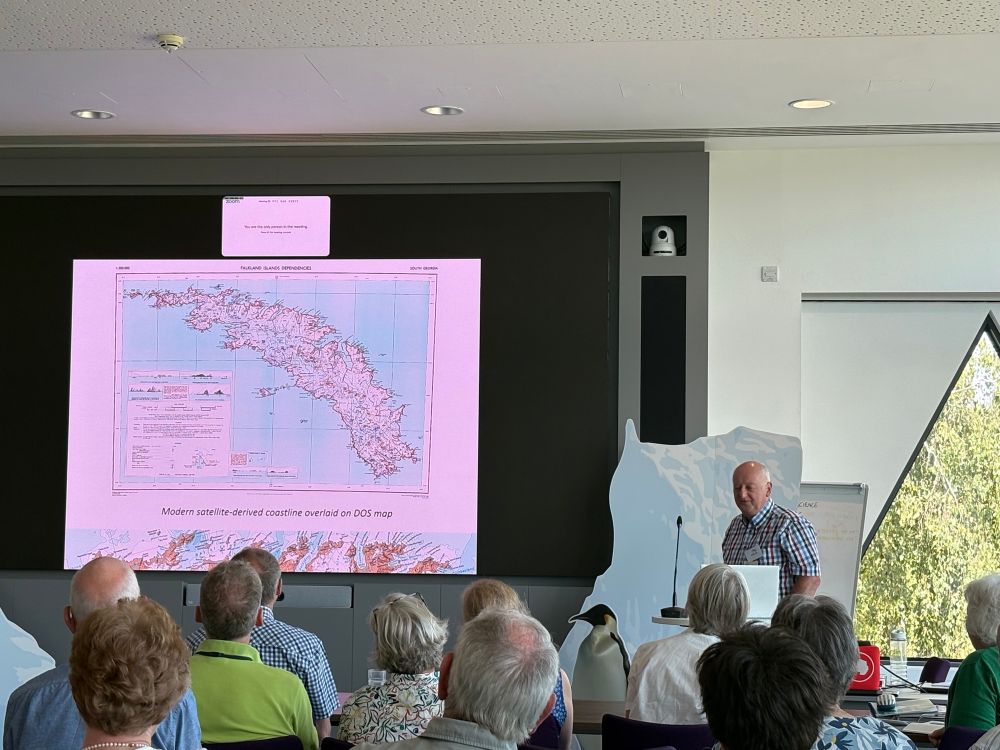
An image of a slide with a DOS map of South Georgia, with the modern coastline overlaid on the map. There are large differences in some places. The image shows many people watching the talk.
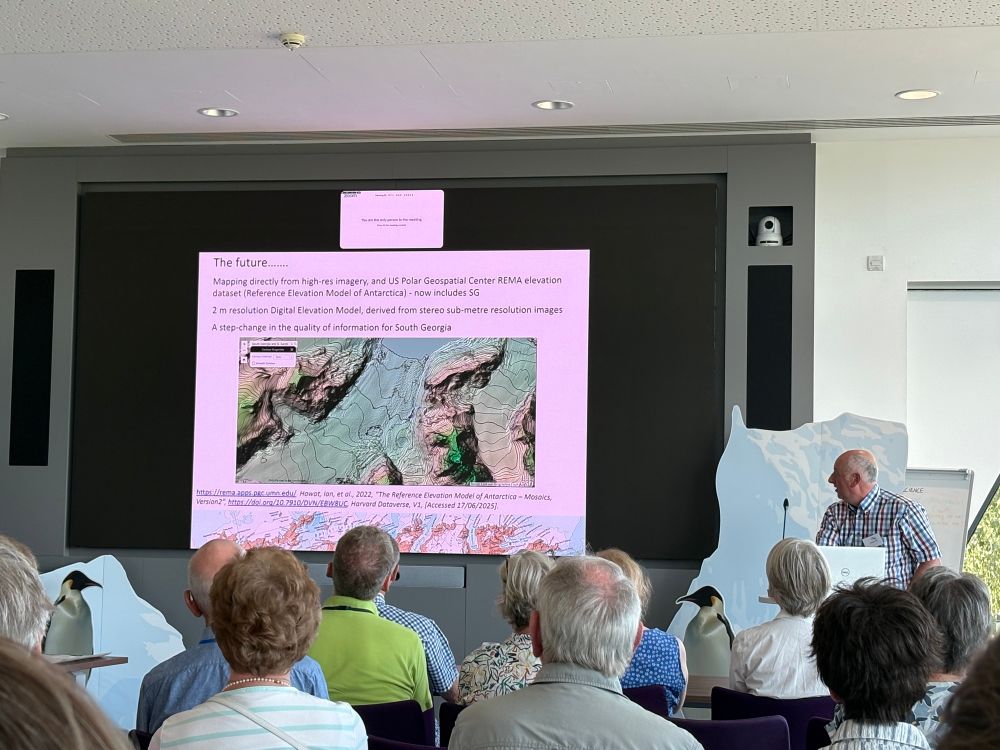
A slide with the text “The future” at the top. The slide then describes the latest satellite-derived elevation model that covers South Georgia at 2m spatial resolution.
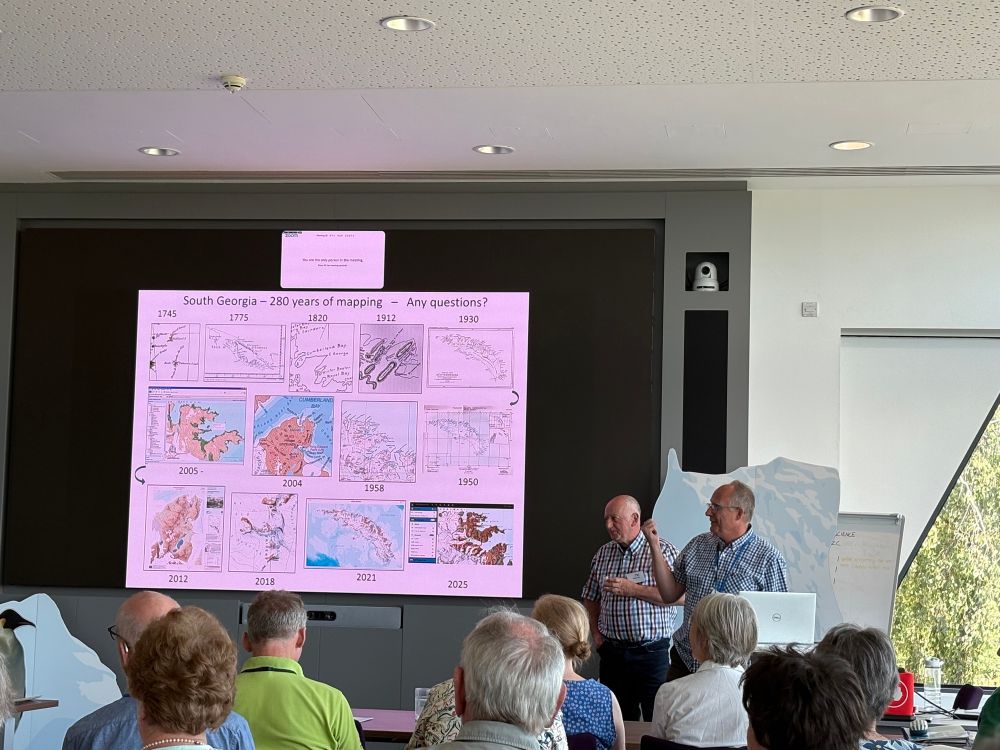
The final slide titled “South Georgia - 280 years of mapping - any questions?” The slide has many small images of maps through time, each one increasing in accuracy.
Our former head of MAGIC gave a joint talk at the South Georgia Association summer event today on 'Advances in Mapping South Georgia'. It was a fantastic overview on the island’s varied and interesting history. We’re proud to be continuing mapping work on the island in 2025!
04.07.2025 19:21 — 👍 5 🔁 0 💬 0 📌 0
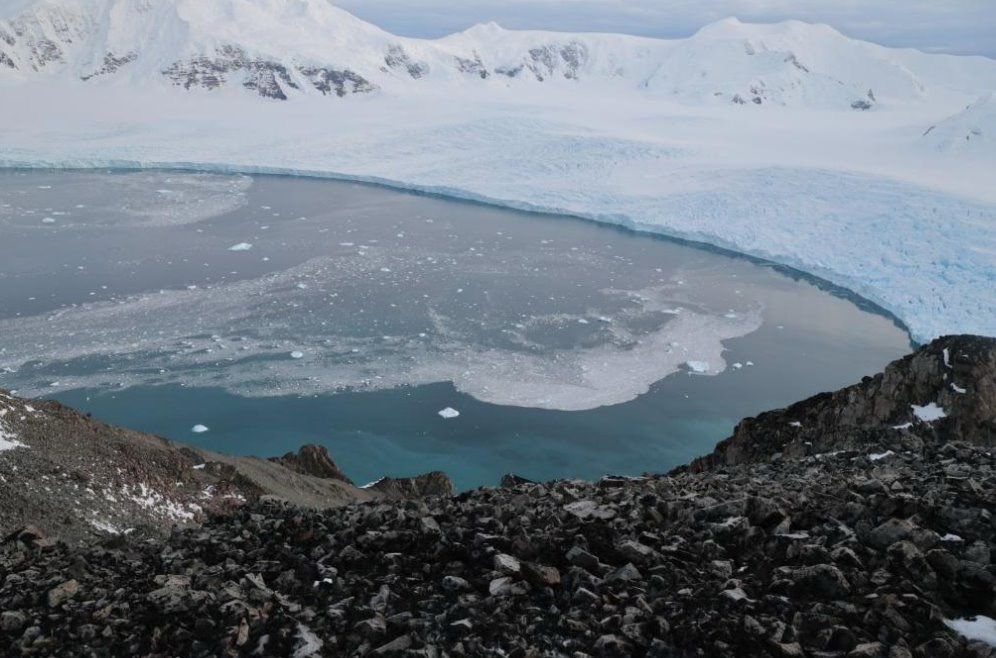
Photo looking from Stork Ridge down to Sheldon Glacier showing part of the view that our fixed cameras will capture. The image shows the view from a rocky outcrop looking down on a crevassed glacier with water in front of small icebergs are floating in the water.
This week we have been at a @polomints.bsky.social project meeting, planning details of how to use fixed stereo cameras, RPAS and our new air camera to monitor calving of the Sheldon Glacier on Adelaide Island. For more information visit polomints.ac.uk.
04.07.2025 13:50 — 👍 5 🔁 3 💬 0 📌 0
We are currently at the @esa.int Living Planet Symposium in Vienna #LPS25.
It's a busy week hearing about the latest developments in Earth Observation, kicking off a new project and catching up with longtime collaborators.
26.06.2025 08:48 — 👍 3 🔁 0 💬 0 📌 1
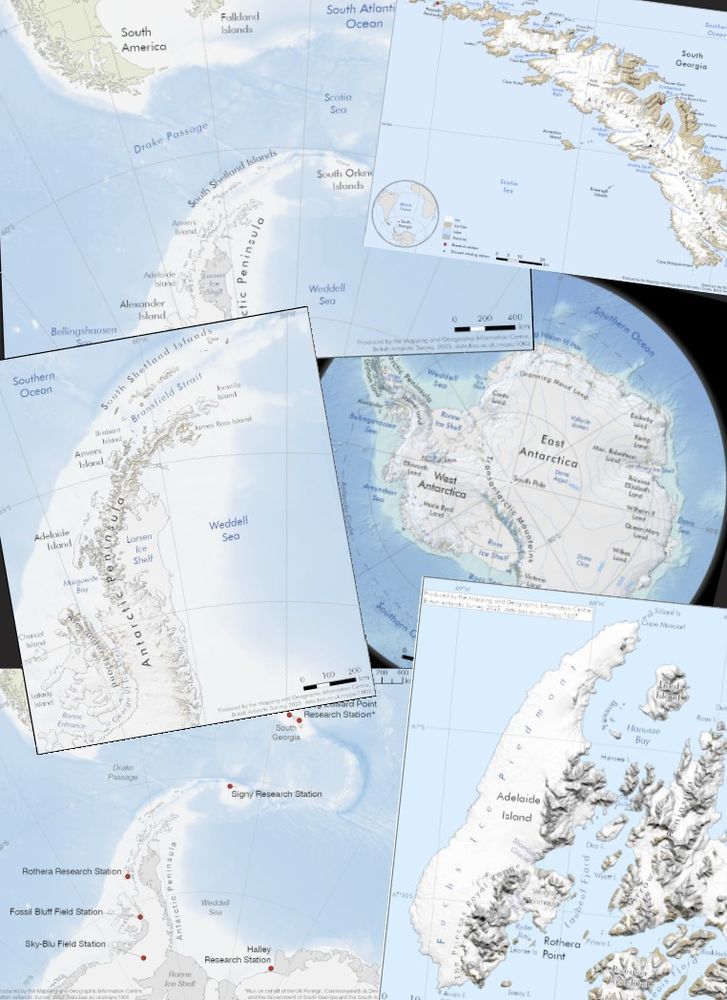
6 small maps of regions in Antarctica and South Georgia. These are examples of typical Helpdesk outputs from the job being advertised. Each map contains place names, bathymetry in shades of blue, and terrain details on land.
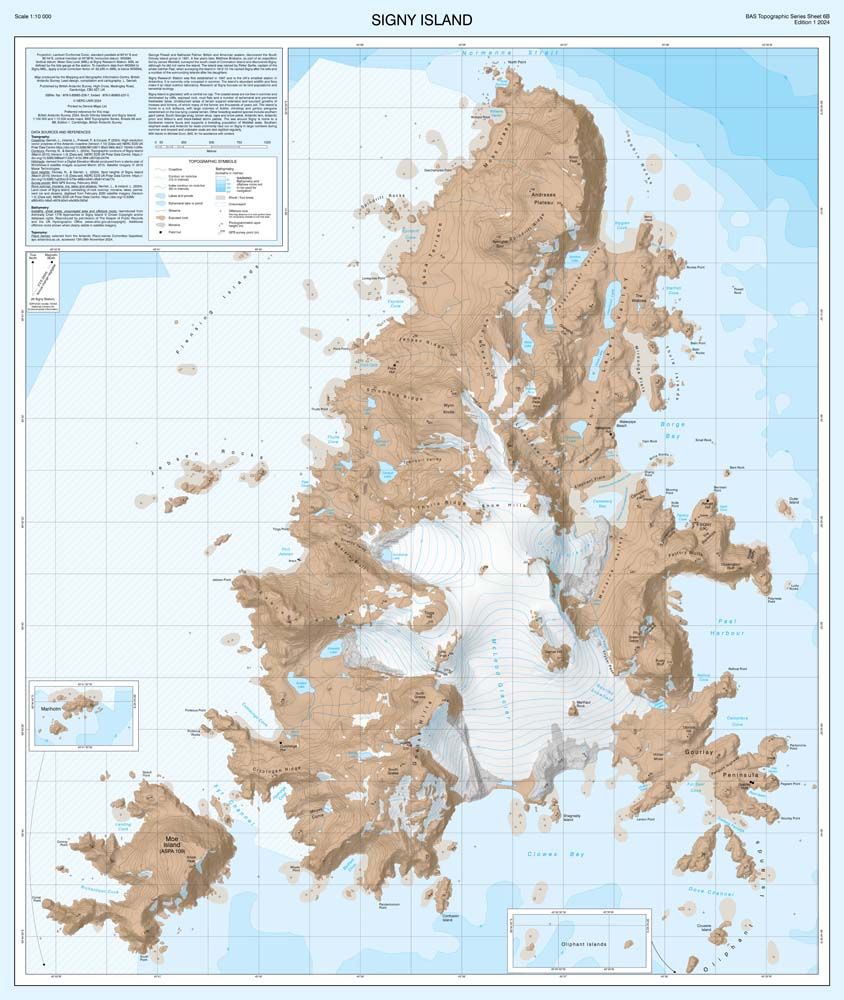
A map of Signy Island, South Orkney Islands. This map is part of our BAS Topographic Map Series. Bathymetry is shown in deepening shades of blue. Details on the land include ice and moraine extent, lakes, contours, and place names.
We're hiring a GIS and Mapping Specialist to manage our Geospatial Helpdesk and to contribute to our Topographic Map Series.
This is a really exciting opportunity at the British Antarctic Survey to support colleagues across the organisation. Details here: shorturl.at/bA4fd #GISjobs
25.06.2025 08:31 — 👍 10 🔁 10 💬 0 📌 1
We’re developing a prototype web portal to explore British Antarctic Survey’s aerial photography archive 📸 ✈ Search by place or flight line, view results on the map, and access decades of contextual survey data. A step toward making this unique Antarctic record more discoverable & easier to explore!
24.06.2025 10:14 — 👍 14 🔁 2 💬 0 📌 1
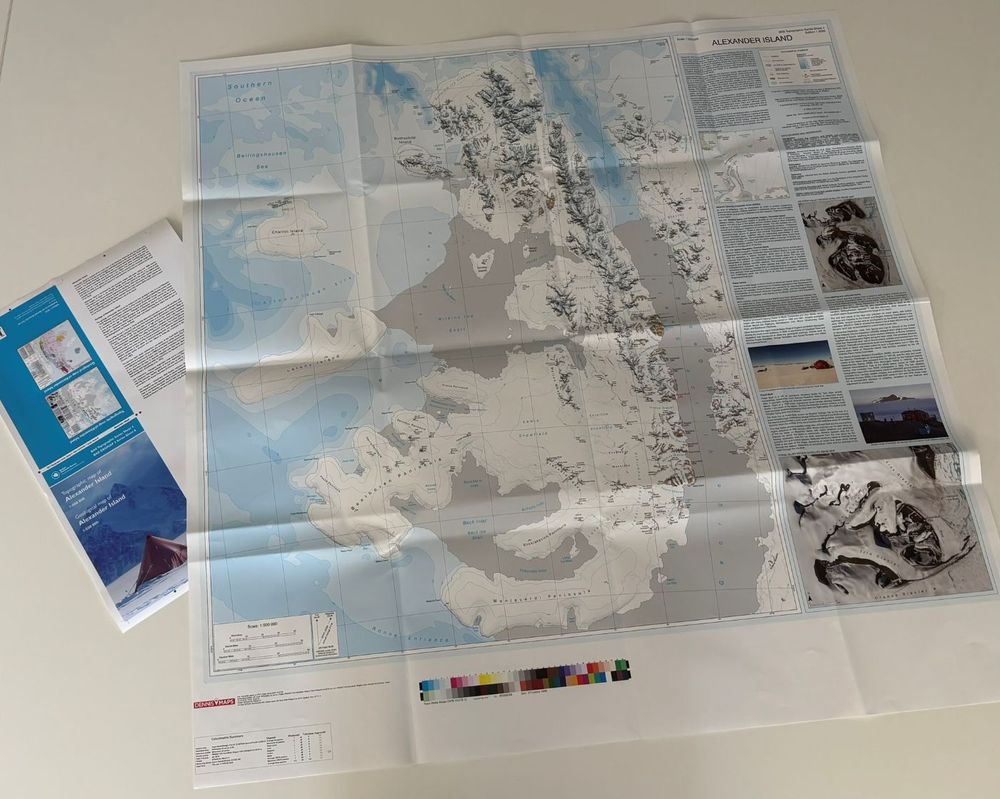
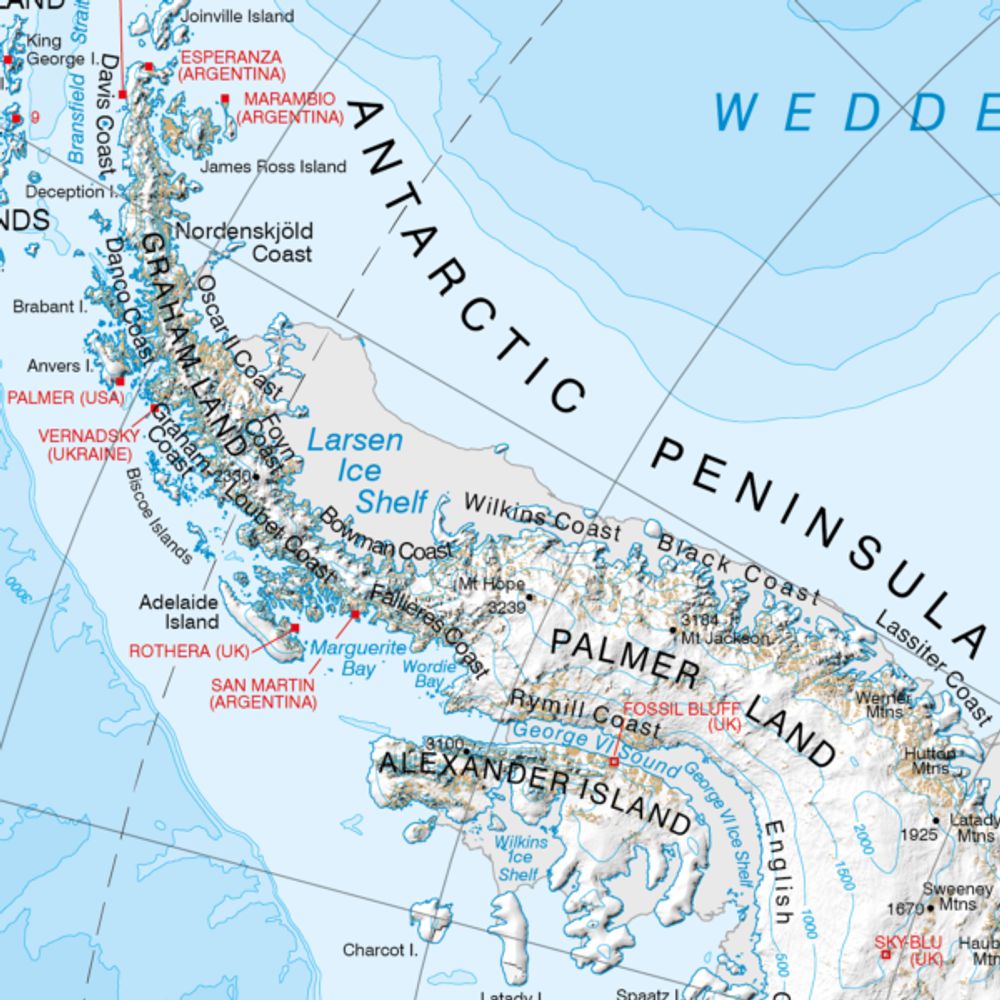
A photo of a map on a table. The map covers Alexander Island, a long island with large peninsulas coming off to the west. The land is white with contours and place names visible. Ice shelves are grey. Bathymetry is shown with intervals of cyan. A large information is shown to the right of the map with photos and text.
We've just received the proofs of our new Alexander Island map from Dennis Maps printers and have given the go ahead for printing!
This is the first comprehensive map of the entire region produced in decades. At 1:500 000 scale, it also features a geological map on the reverse 😍 Watch this space!
19.06.2025 14:03 — 👍 7 🔁 2 💬 0 📌 0
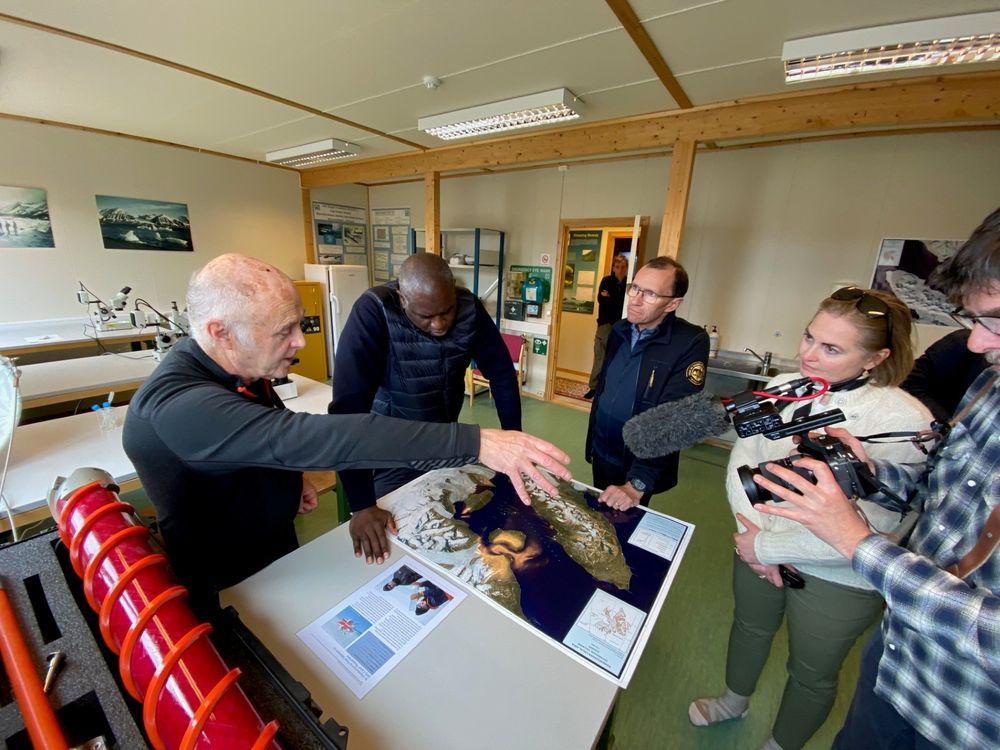
A photo of Dr Robert Mulvaney showing a map of of Ny-Ålesund and the Kongsfjorden region in Svalbard to visitors at the NERC Arctic Office. The visitors include the UK Foreign Secretary Rt Hon David Lammy and his Norwegian counterpart Espen Barth Eide. The photo shows 5 people stood around a map laid on a table, with one man filming.
Great to see our map used by UK Foreign Secretary Rt Hon David Lammy and Espen Barth Eide during their visit to the @ukarcticoffice.bsky.social in Ny-Ålesund recently. With summer/winter versions, it shows how fast the region changes and why frequent, detailed mapping in the Arctic is so important.
12.06.2025 16:05 — 👍 6 🔁 1 💬 0 📌 0
🐧📢 New paper alert 📢 🐧
This work was led and supported by the MAGIC team, using fifteen years of remote sensing data to analyse almost 250 satellite images. Read more in BAS's full thread below.
11.06.2025 10:20 — 👍 8 🔁 3 💬 0 📌 0
A forward look for environmental science
The newly released NERC 'Forward Look for Environmental Science' highlights Polar View (www.polarview.aq) as a vital service helping users navigate safely & efficiently in the polar regions. We've been developing Polar View for 20 years now & love hearing from all sorts of users.
shorturl.at/veId0
09.06.2025 15:46 — 👍 4 🔁 1 💬 0 📌 0
The NERC Arctic Office have printed a giant version of our main published Arctic map and it's come out beautifully! We can't wait to see this being used at upcoming events. Who doesn't want a huge 3 metre map?!
05.06.2025 08:45 — 👍 14 🔁 2 💬 1 📌 0
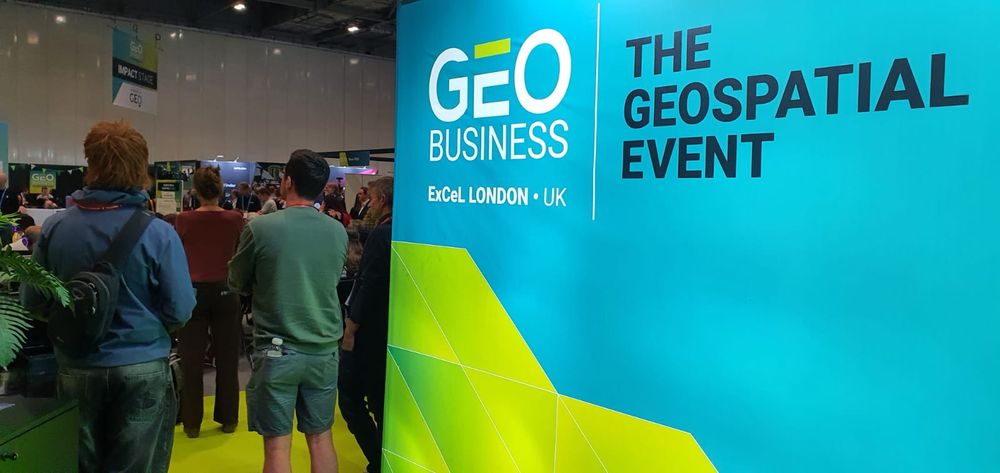
An image of a large banner saying "GEO Business ExCel London, UK. The Geospatial Event. There are people next to the sign listening to a talk.

A person from Women in Geospatial+ presenting a talk called "Beyond the business card - from small talk to strong networks".
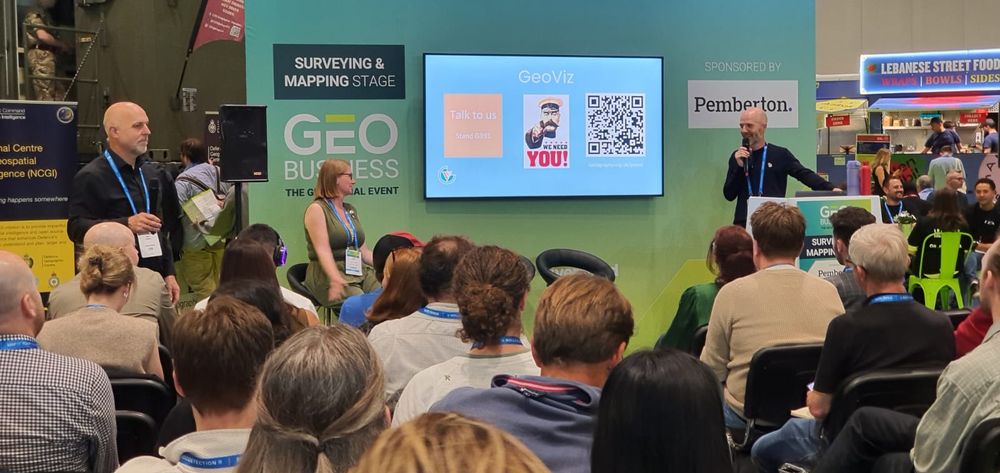
People from the British Cartographic Society presenting a talk. The slide of their talk says "GeoViz - Talk to us - We need you" and there is a QR code that goes to cartography.org.uk/geoviz
A few of our team members are attending GEO Business in London today. There have been fascinating insights into the future of geospatial and we're enjoying talking to other experts in the field!
#GEOBusiness2025 #Geospatial
04.06.2025 15:59 — 👍 1 🔁 0 💬 0 📌 0
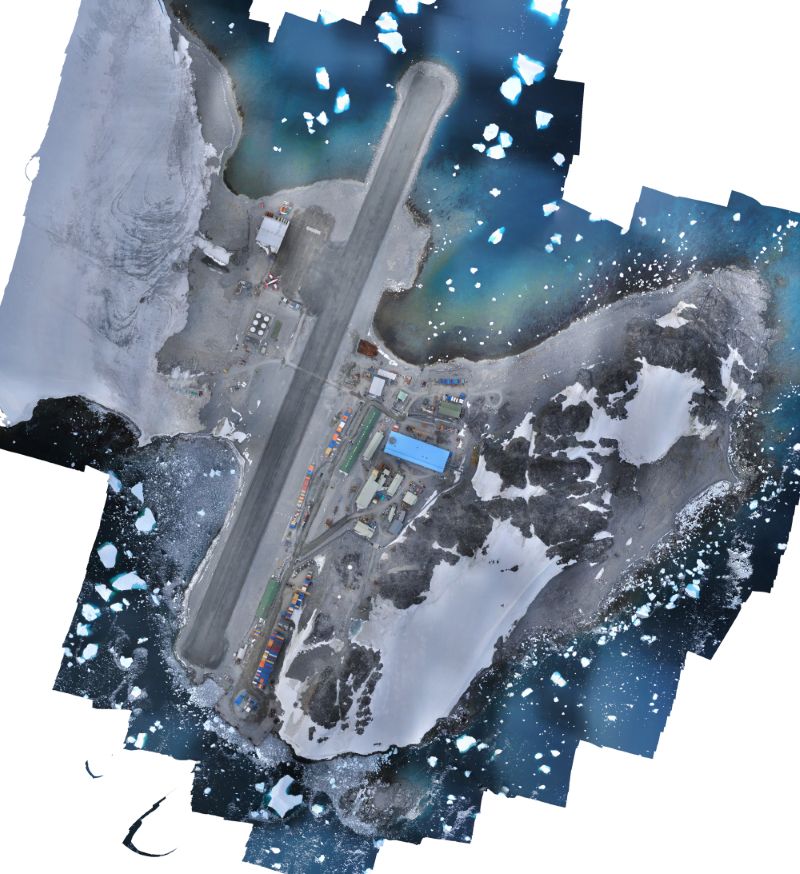
An image of Rothera Research Station, Rothera Point, on Adelaide Island. There is a bright blue building in the centre of the image which is the new Discovery Building. You can also see patches of snow on the point, and there are small icebergs floating in the surrounding water.
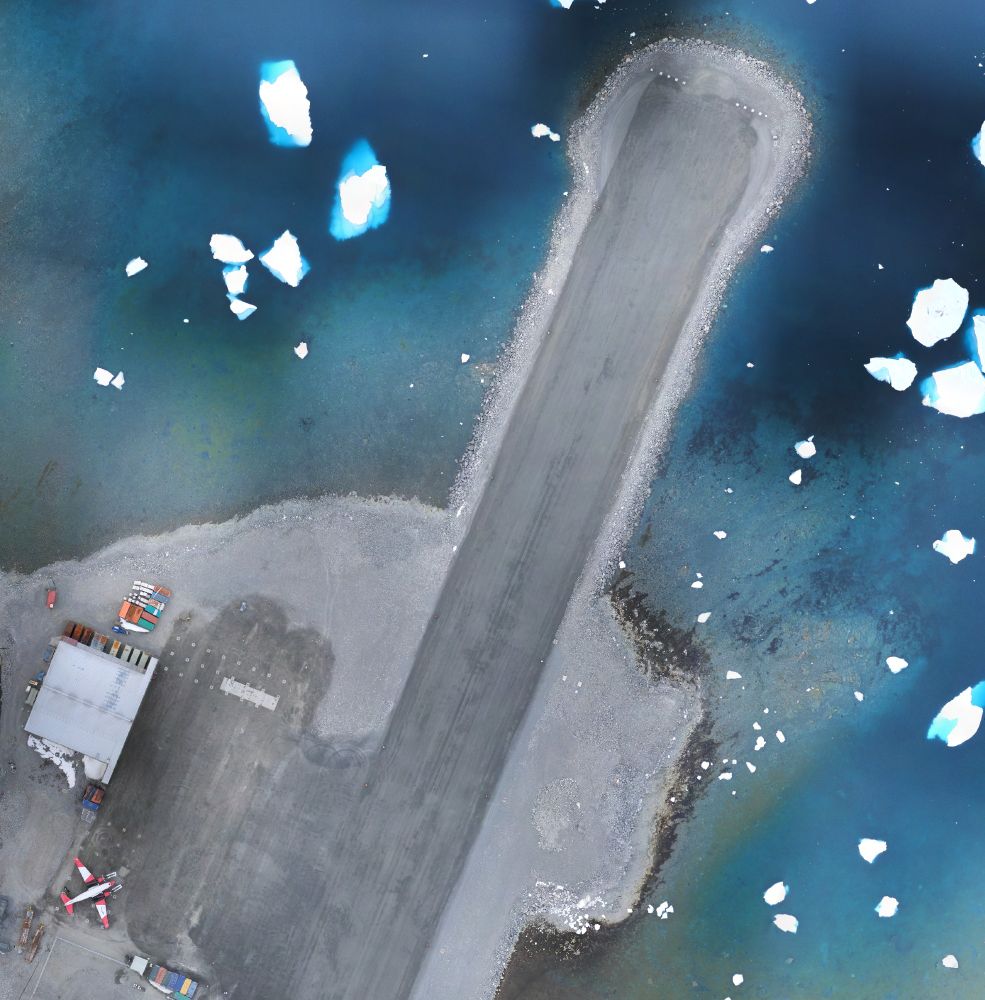
A zoomed in portion of the image, showing the northern end of the runway and the hangar. A white and red plane can also be seen, parked next to the hangar.
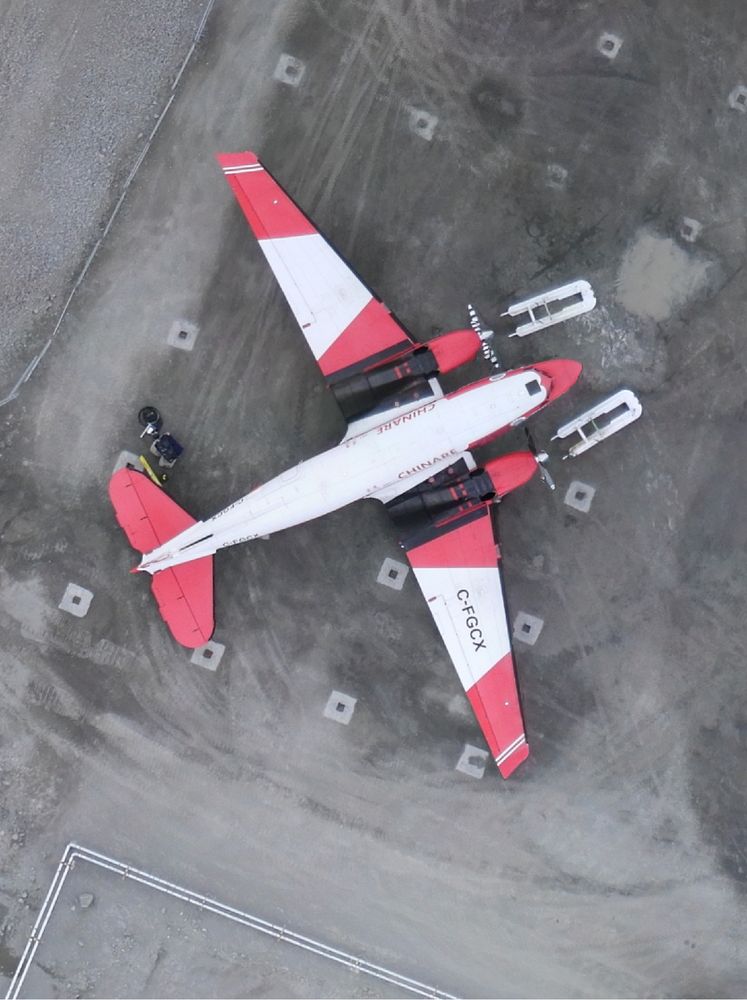
A zoomed in photo of the plane. The plane is red and white. It is possible to see skis in front of it, probably removed from the plane as it continues its journey north away from Antarctica.
A few months ago, we surveyed Rothera Point using our fixed-wing eBee-X UAV. We've now processed the data and produced this beautiful, orthorectified mosaic, as well as a Digital Elevation Model.
We carry out these surveys every year, allowing all of BAS to work with current and accurate data!
29.05.2025 09:54 — 👍 9 🔁 3 💬 0 📌 0
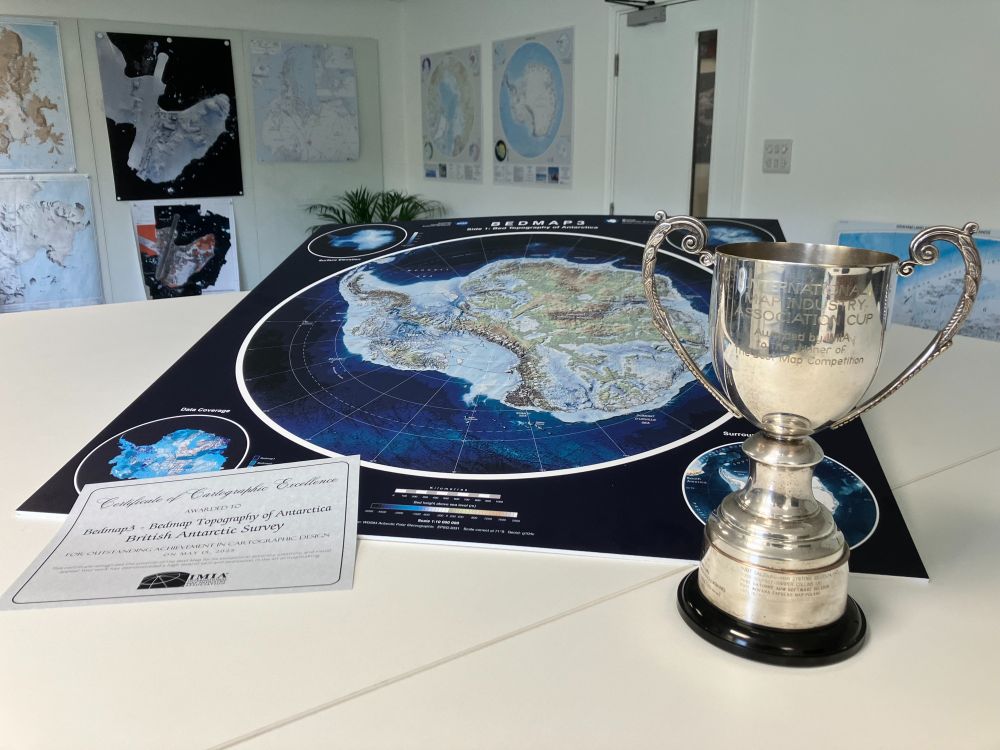
A photo of the trophy and certificate, with side A of the Bedmap 3 map shown behind. The map shows the bed topography of Antarctica underneath the ice.
We're proud to share that our Bedmap3 map won "Best Map" at the International Map Industry Association (IMIA) forum in London last week! 🏆
This international award celebrates Outstanding Cartographic Design & we’re honoured to be recognised alongside leading names in the field from previous years. 🗺️
21.05.2025 15:20 — 👍 32 🔁 8 💬 3 📌 2
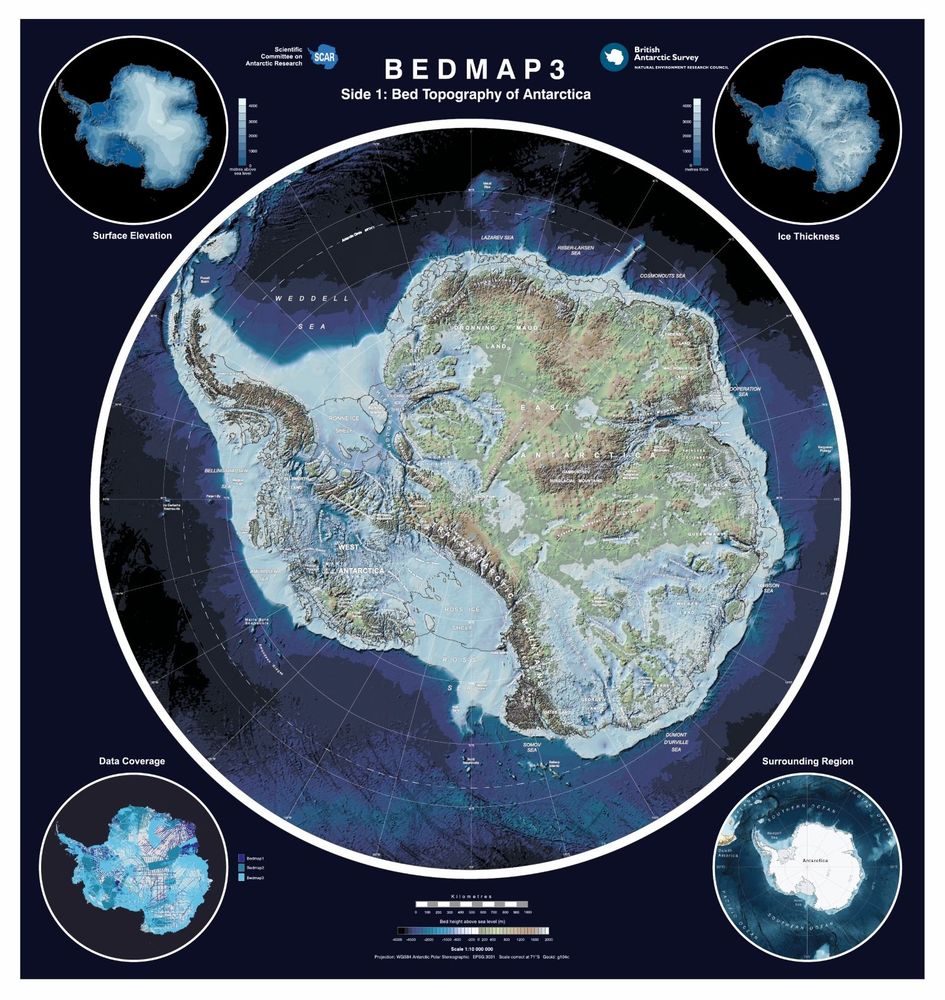
Bedmap 3 map side 1, showing the bed topography of Antarctica. 4 small roundel maps are shown in the corners presenting different datasets of interest, related to the project.
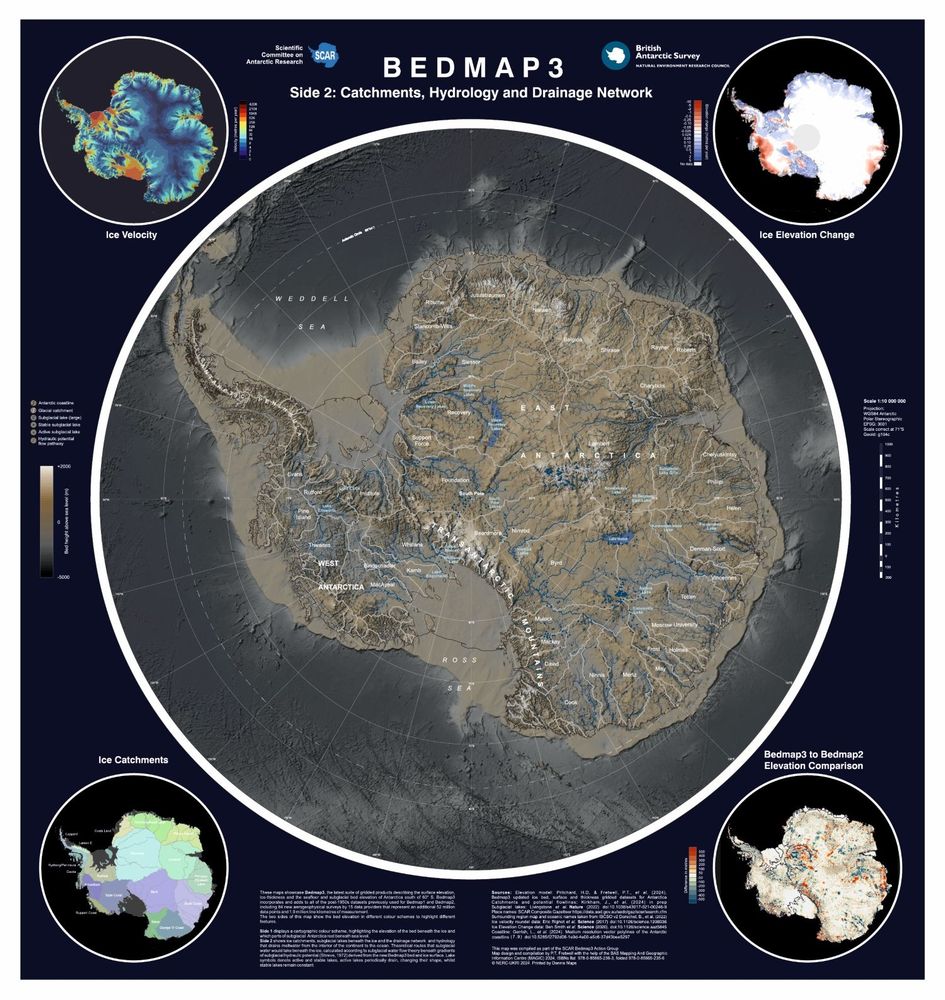
Bedmap 3 map side 2, showing the bed topography of Antarctica. 4 small roundel maps are shown in the corners presenting different datasets of interest, related to the project. This side of the map uses a different colour ramp, and also shows rivers and lakes present underneath the ice,
More details about the map can be found on our website with information about where to purchase the map from if you wish!
www.bas.ac.uk/data/our-dat...
21.05.2025 15:26 — 👍 6 🔁 1 💬 0 📌 0
A photo of the trophy and certificate, with side A of the Bedmap 3 map shown behind. The map shows the bed topography of Antarctica underneath the ice.
We're proud to share that our Bedmap3 map won "Best Map" at the International Map Industry Association (IMIA) forum in London last week! 🏆
This international award celebrates Outstanding Cartographic Design & we’re honoured to be recognised alongside leading names in the field from previous years. 🗺️
21.05.2025 15:20 — 👍 32 🔁 8 💬 3 📌 2
Open to all UK-based researchers, their international partners & beyond. Funded by UKRI-NERC and operated by the British Antarctic Survey. Here to support you. Located in Ny-Alesund, Svalbard.
Glaciology research at Durham University on the past, present and future of our mountain glacier and ice sheet environments ❄️
https://durhamglaciology.wordpress.com/
The Natural Environment Research Council's Arctic Office. We support the UK Arctic research community through engagement; advocacy and delivery.
We are the National Snow and Ice Data Center at the University of Colorado Boulder. We conduct innovative research and provide open data to understand how the frozen parts of Earth affect the rest of the planet and impact society.
NOAA provides science, service and stewardship to protect life, property & Earth's natural resources. An agency of the Department of Commerce. Join us on Instagram & Facebook. Official NOAA account.
Protecting heritage sites on the Antarctic Peninsula, including the world's southernmost post office, AKA the Penguin Post Office 🐧📮 and Shackleton's Endurance ⚓️
https://www.ukaht.org/
The #CopernicusClimate Change Service (#C3S) & #CopernicusAtmosphere Monitoring Service (CAMS), implemented by @ecmwf.int on behalf of the European Commission.
The primary data repository for the Arctic section of the NSF Office of Polar Programs located at NCEAS. Check out open-access Arctic data, trainings, and tools at http://arcticdata.io.
The Cooperative Institute for Research in Environmental Sciences (CIRES) at CU Boulder is a world leader in environmental research. We've partnered with NOAA since 1967. https://cires.colorado.edu/
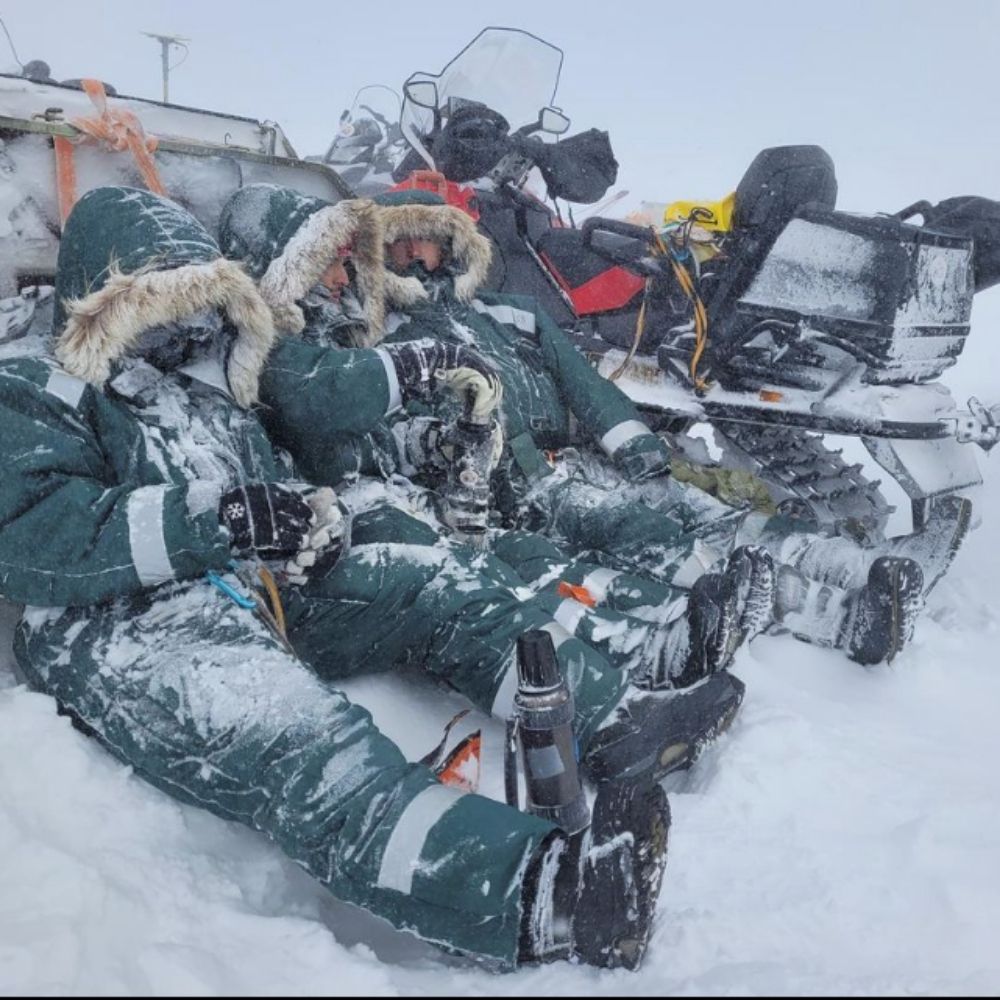
📸: John Cassano/CIRES
IACS is one of eight associations of the International Union of Geodesy and Geophysics (IUGG). IACS promotes the advancement of cryospheric sciences of the Earth and the solar system, organizes biennial scientific meetings, and supports working groups.
Glaciology research at the Norwegian Polar Institute (Tromsø, Norway). You'll also find us on IG (www.instagram.com/npiglaciology) and FB (www.facebook.com/NPIglaciology).
European Geosciences Union is the leading organisation supporting Earth, planetary & space science researchers in Europe. #EGU25 27 April - 2 May 2025. Online Mon-Fri 10-5 CET.
We are the Cryospheric Division (CR) of the European Geoscience Union (EGU @egu.eu) and share news and biweekly blog posts on everything cryosphere: https://blogs.egu.eu/divisions/cr/
Contact us, if you want to write a post or join our community.
UK Centre for Polar Observation & Modelling (CPOM), primarily funded by NERC. Leading research in the polar regions from scientists at Northumbria, Lancaster, Liverpool, UCL, Reading & Bristol.
We research ice, ocean and climate.
Website: www.awi.de
Imprint: https://www.awi.de/en/imprint.html
The official Bluesky feed from the Government of the British Antarctic Territory, with full recognition of Article IV of the Antarctic Treaty.
To protect Antarctica and the Southern Ocean is to protect our future on this planet. In this critical decade for action, our science explores the role of the Antarctic region in the global climate system. Led by @utas.edu.au.
🔗 aappartnership.org.au
Scott Polar Research Institute, home to: Polar research | The Polar Museum | The Polar Library | The Thomas H. Manning Archive | The SPRI Picture Library
https://linktr.ee/scott.polar
We facilitate international research on the Antarctic and Southern Ocean and provide independent scientific advice.
www.scar.org