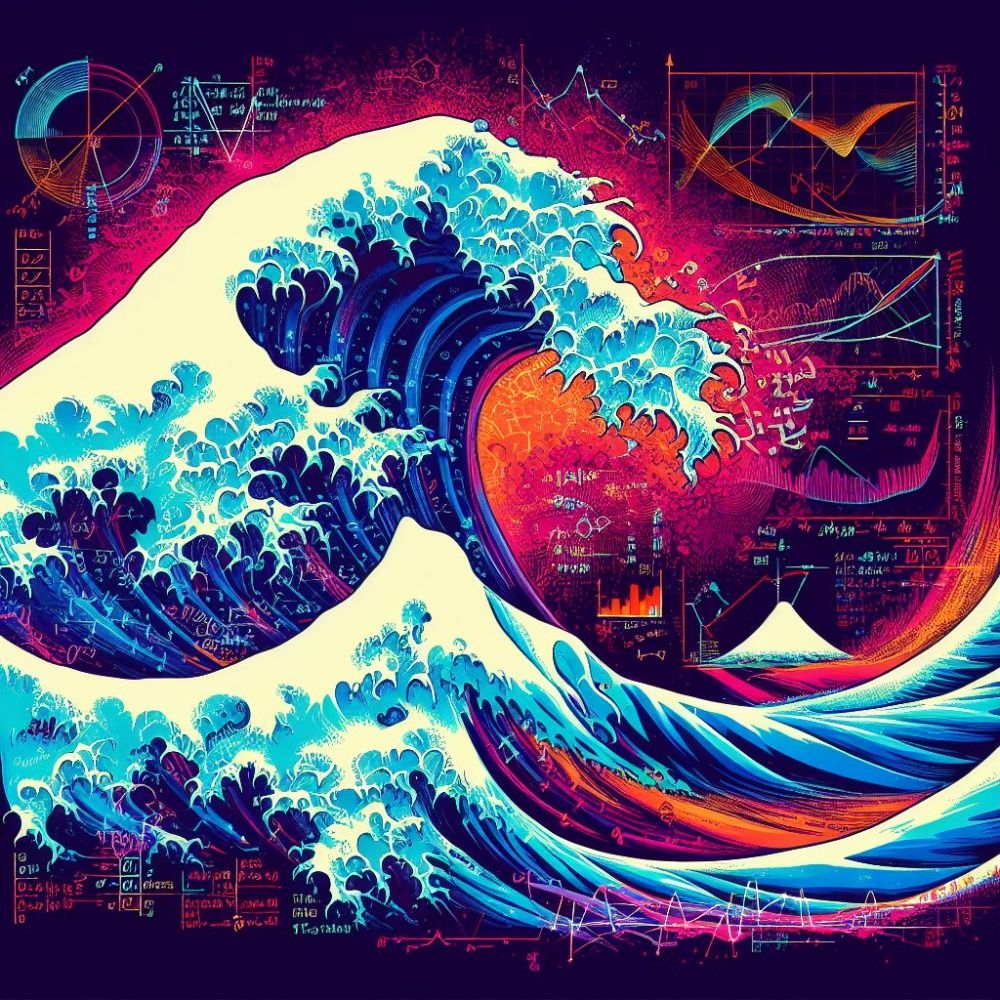
To celebrate the kick-off of #UNOC3 and #OOSC in Nice, we share a striking, mesmerising perspective on Mediterranean Marine Heatwaves —and their clear amplification by climate change.
From @awi.de storyline simulations, visual by @jawijan.bsky.social
03.06.2025 07:36 — 👍 4 🔁 4 💬 1 📌 1
🌪️ Tales from the Storm at #AGU24!
Check out our km-scale storyline simulations of Hurricane Helene and other 2024 extremes.
📢 @thomasjung.bsky.social will present: How storyline simulations answer “what if” questions.
📅 Tue, 10 Dec 2024📍NH22B, 202 A
✨ Learn more: doi.org/10.22541/ess...
10.12.2024 10:32 — 👍 10 🔁 1 💬 0 📌 3
Inaugural first #BlueSky post, re-sharing our latest paper!
Still on the front page of Communications Earth & Environment 👇
doi.org/10.1038/s432...
26.11.2024 07:24 — 👍 38 🔁 8 💬 3 📌 0
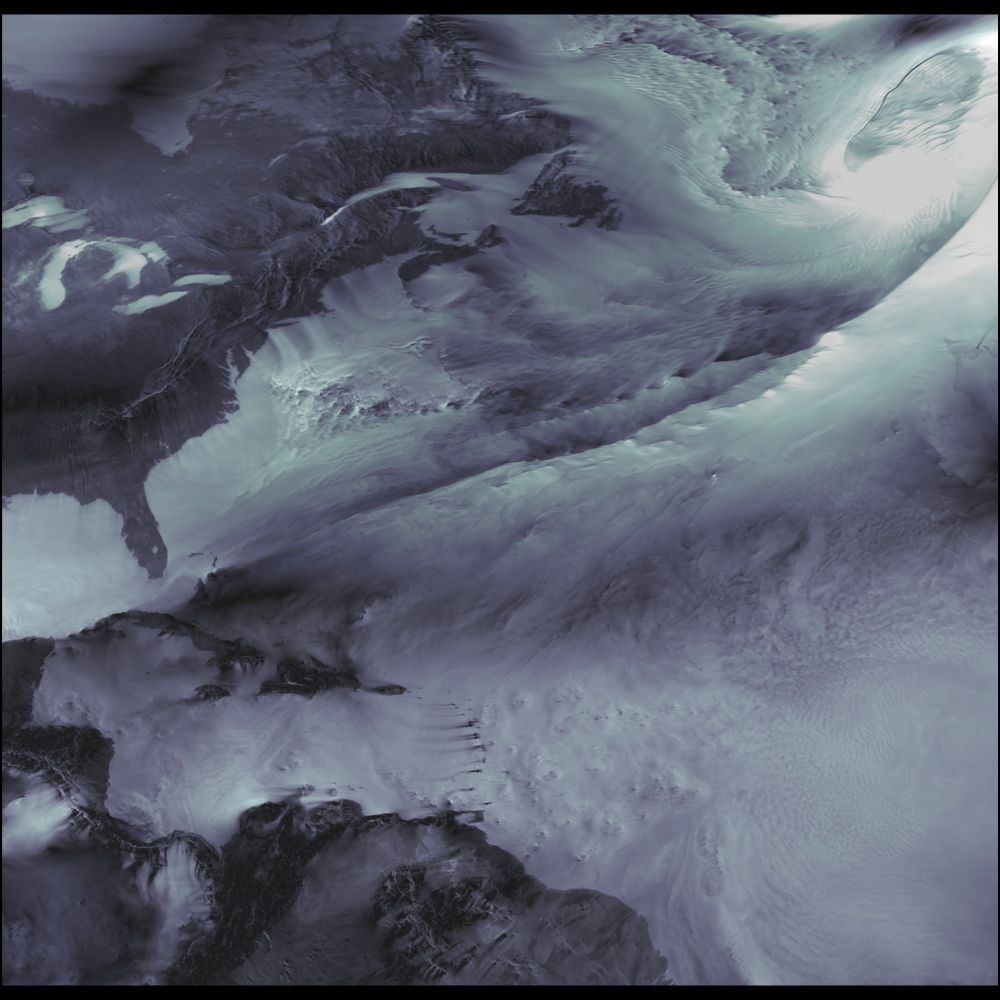
Wind over the Atlantic from a 5 km resolution model. Different surface types interact with wind in unique ways, which is why the continents are distinctly visible in the wind field. 🧪
Model: IFS-FESOM | U component of the wind | Project: nextGEMS | Simulations: @trackow.bsky.social
#SciArt
05.12.2024 10:26 — 👍 22 🔁 2 💬 0 📌 1
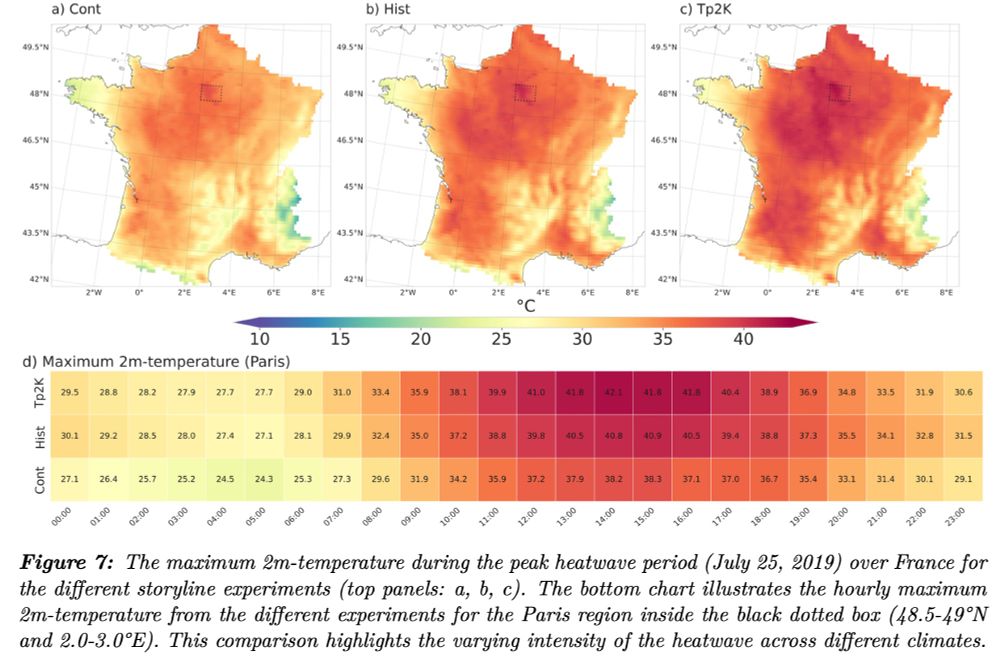
The maximum 2m-temperature during the peak heatwave period (July 25, 2019) over France for the different storyline experiments (top panels: a, b, c). The bottom chart illustrates the hourly maximum 2m-temperature from the different experiments for the Paris region inside the black dotted box (48.5-49°N and 2.0-3.0°E). This comparison highlights the varying intensity of the heatwave across different climates.
The storyline approach isn’t new, but for the first time, we’re using it with 10km resolution! 🌍 See how extreme events might have looked in the past, without climate change, and how they could unfold in a +2°C future. Check out our work led by Amal John: essopenarchive.org/users/852952...
25.11.2024 12:05 — 👍 13 🔁 6 💬 1 📌 0
Oceanographer researching Mesoscale Eddies, Arctic Ocean Dynamics, Ocean-Sea Ice Interactions, km-scale modelling.
Opinions are my own
Researcher in Statistics for MetOcean engineering. Extrême events. Climate Change. ESR. Statistics. Rstats. GAMs. Proud and tired father of three.
Professor of polar biogeochemical modelling at University of Bremen and ocean carbon cycle scientist / marine biogeochemical modeller at the Alfred Wegener Institute for Polar and Marine Research, Germany. Views are my own.
Tropical cyclone modeler at Impact Forecasting Aon. Interested in Physical oceanography, numerical models and climate science.
AI for Science, deep generative models, inverse problems. Professor of AI and deep learning @universitedeliege.bsky.social. Previously @CERN, @nyuniversity. https://glouppe.github.io
Climate scientist at the National Centre for Atmospheric Science, University of Reading | IPCC AR6 Lead Author | MBE | Views own | https://edhawkins.org
Warming Stripes: http://www.ShowYourStripes.info
Physical oceanography PhD student at the @unisouthampton.bsky.social.
Postdoctoral scientist, Ocean 🌊 and Climate 🌍 research at AWI (Germany). Interested in extreme events & polar regions.
Scientist @ecmwf.int : climate & ocean variability, kilometre-scale modelling, and its visualisation. #art and music enthusiast. #scicomm
Scientist and scientific programmer. Working on km-scale climate models.
Bluesky account for the European Eddy-Rich Earth-System Models (EERIE) Project.
Find out more on: https://eerie-project.eu/
#ClimateResearchNet
Head of Climate Dynamics and Vice-Director at AWI | Professor for Physics of the Climate System at University of Bremen | Interested in: Climate physics, climate change, kilometre-scale modelling, storylines, climate AI
Oceanographer, climate and ocean modeler, interested in ML for climate and LLMs. Senior scientist at AWI. Working on FESOM2 unstructured ocean model, km-scale climate modelling, data visualisation. More info: https://koldunovn.github.io/
We measure the attention that research outputs receive from policy documents, mainstream news outlets, Wikipedia, social media and online reference managers. We detect sentiment of Bluesky/X posts.
Come for the attention to research. Stay for the memes.
official Bluesky account (check username👆)
Bugs, feature requests, feedback: support@bsky.app