You are referring to this?
Boyer, M., Quéléver, L., Brasseur, Z. et al. Penguin guano is an important source of climate-relevant aerosol particles in Antarctica. Commun Earth Environ 6, 368 (2025). doi.org/10.1038/s432...
@trackow.bsky.social
Scientist @ecmwf.int : climate & ocean variability, kilometre-scale modelling, and its visualisation. #art and music enthusiast. #scicomm
You are referring to this?
Boyer, M., Quéléver, L., Brasseur, Z. et al. Penguin guano is an important source of climate-relevant aerosol particles in Antarctica. Commun Earth Environ 6, 368 (2025). doi.org/10.1038/s432...
"If this shift represents an excursion into a new normal, our future could be hotter faster than expected."
A year after this insightful study was published, the albedo and net flux over the Northern Hemisphere mid-latitude oceans keep decreasing:
www.science.org/stoken/autho...

📢 New paper on the impacts of AMOC collapse on European hydroclimate. 🌊
We find an AMOC collapse would exacerbate drought conditions across Europe, linked to reduced precipitation. In combination with climate change droughts are expected to become more frequent and severe.
doi.org/10.5194/hess...

“We have observational evidence and ocean modeling results to document that kilometer-scale seawater intrusions beneath grounded ice generate a high melt in the [grounding zone of Thwaites Glacier].”
www.pnas.org/doi/full/10....
In the past year we've had a series of papers with results that've shocked #climate scientists - the globe is heating #FasterThanExpected & we don't fully know why
The public discourse is not keeping up.
Here's a series of 5 new studies that climate hawks & journos need to have on their radar 🧵
Big thanks to @climateofgavin.bsky.social and the other authors for including me in this work. The data is open and available here:
📂 zenodo.org/records/1738... (7/7)
The datasets are designed to be flexible. We make recommendations for how climatological & anomalous fluxes can be implemented in models that may have different approaches to interactions with ice sheets.
We hope this helps the community to move toward more physically consistent simulations. (6/7)
By providing spatially and temporally resolved meltwater fluxes, our dataset could enable a large set of models to explore how AMOC might respond to realistic freshwater forcing, not just idealised pulses. This is a key step toward understanding future climate dynamics under continued ice loss (5/n)
08.11.2025 15:52 — 👍 0 🔁 1 💬 1 📌 0Similar to volcanic forcing, we provide year-to-year timeseries of freshwater anomalies, enabling models to reflect observed historical variability.
This means better representation of events like Greenland’s 2012 melt spike or Antarctic ice loss & its evolving freshwater impact on the ocean (4/7)


A personal highlight: we include iceberg melt patterns, a topic I’ve worked on for years and care deeply about.
Icebergs don’t just melt, they drift over vast distances, cool their surroundings, and shape regional ocean properties.
Capturing this spatial and vertical complexity matters. (3/7)
We provide datasets of absolute & anomalous freshwater fluxes from Greenland/Antarctica, critical inputs for climate modelling, CMIP7 & beyond.
These fluxes include runoff, sub-shelf melt, and calving, each with distinct ocean impacts. Most models haven’t accounted for them properly until now (2/7)
Happy to see this out! Meltwater can delay future surface warming, and its interannual variations impact ocean stratification & overturning. This effect is usually absent from models.
Including it as forcing may lead to more realistic simulation of surface temperature and sea ice trends🧊🌊 (1/7)

Would you believe it: just 10 days after #EarthCARE went through the eye of Hurricane Humberto, it did the same with Hurricane Priscilla in the East Pacific on 7 October! A very different beast this one: a huge eye around 100 km across, and very lopsided, with much more rain on the southern side.
23.10.2025 09:09 — 👍 24 🔁 4 💬 2 📌 0Read our editorial on #climate research in the Global South, and take a look at the collection of papers on #weather and climate extremes published in @natcomms.nature.com and @commsearth.nature.com www.nature.com/collections/...
08.10.2025 12:10 — 👍 9 🔁 2 💬 0 📌 0I just updated this NASA CERES graph. The regional level of Absorbed Solar Radiation increased by 4.2 W/m² in 20 years!!
That's more than the global greenhouse gas forcing increase since 1750!
The 2 W/m² Net Flux increase indicates that there is a lot more regional warming in the pipeline.
Finally, some excellent resources on the 2023 SST anomalies:
@polarocean.bsky.social
bsky.app/profile/pola...
@trackow.bsky.social
bsky.app/profile/trac...
bsky.app/profile/mice...
@tguinaldo.bsky.social
bsky.app/profile/tgui...
@profmattengland.bsky.social
bsky.app/profile/prof...

🌊 In 2023, the ocean carbon sink weakened for the first time in a record-hot year 🌡️🌎
Our new study in Nature Climate Change quantifies this unexpected decline and explains how it came about. 👇
doi.org/10.1038/s415...
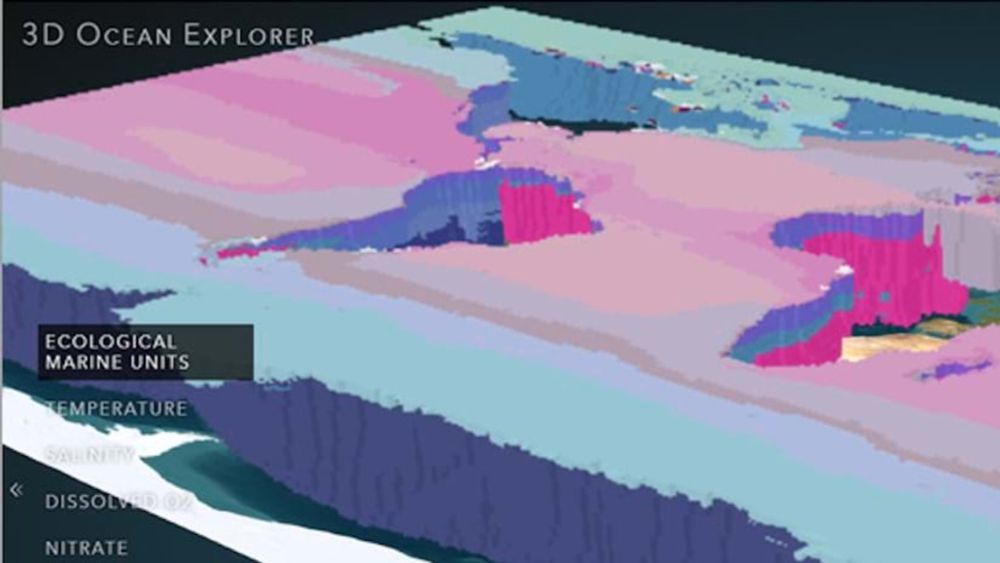
Hope you enjoy exploring this cool 3D app of the ocean focusing on NOAA World Ocean Atlas water column measurements of temp, salinity, dissolved O2, and nutrients!
#voxels #EcologicalMarineUnits
www.esri.com/about/newsro...
🌊 🦑 🌎 🌍 🌏 #GISchat #geogchat #geogsky

Enfin, la température de l'eau à la surface de la mer Méditerrannée entre la France rt l'Afrique du Nord a été historiquement élevée (tous mois confondus) en juin : jusqu'à 27 °C, soit +3,7 °C par rapport à la "normale".
3/3
New paper in ERL! We study the importance of resolution for the representation of climate extremes.
We use a new generation of km-scale models to show that many important details about temperature and precipitation extremes are hidden at CMIP6-like resolutions.
doi.org/10.1088/1748...

#FIMC2025, Sarah Keeley (@copernicusecmwf.bsky.social) showed how coupling ocean, sea ice, and atmosphere boosts forecast accuracy. Storms, heatwaves, even sea ice changes—what lies beneath shapes what’s above. AI is now taking it further.
#CoupledForecasting #ECMWF #AI4Weather #UNOC3
To celebrate the kick-off of #UNOC3 and #OOSC in Nice, we share a striking, mesmerising perspective on Mediterranean Marine Heatwaves —and their clear amplification by climate change.
From @awi.de storyline simulations, visual by @jawijan.bsky.social
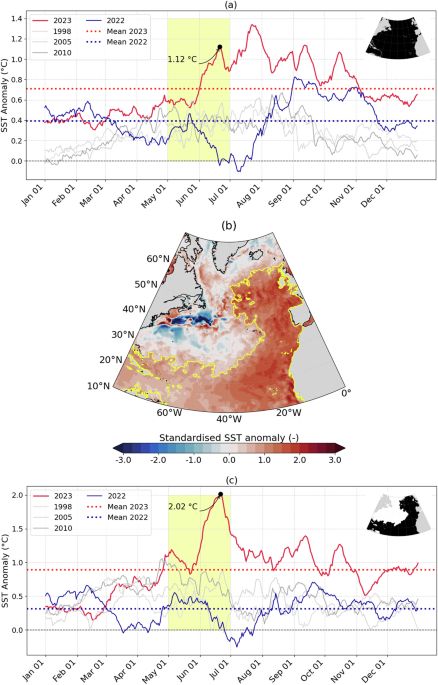
If I can add something. Here we demonstrate that NATL warming was due to natural variability. The event was excepted and in line with climate projections (return period around 10 years). The processes are well known and we can explain it.
www.nature.com/articles/s43...
Important new article in @nature.com:
"...the record-shattering jump in surface ocean temperatures in 2023–2024 was an extreme event after which surface ocean temperatures are expected to revert to the expected long-term warming trend."
#TruthIsBadEnough
(h/t @flowinguphill.bsky.social)
If only people valued peer reviewed scientific papers and regional data more than tweets and blogs and global averages...
This is barely ever addressed.
Helge Goessling gave a great presentation at the EGU yesterday.
More soon.

It's a wrap for this year's European Geosciences Union (EGU) General Assembly, where we have been presenting developments from across #ECMWF. Our team have been involved as speakers, poster presenters and conveners, but found time to get together for this great group photo!
02.05.2025 15:23 — 👍 23 🔁 1 💬 1 📌 0
Today @jens-d-mueller.bsky.social gave a great talk on the ocean carbon sink during the record-warm year 2023 & an outlook for 24. #EGU25
This relates to our joint work @awi.de @ecmwf.int that is presented Thursday morning, room 0.14. See you there:
meetingorganizer.copernicus.org/EGU25/EGU25-...

Our editors are calling for submissions to help build a robust, peer-reviewed evidence base for the forthcoming IPCC Special Report on Climate Change and Cities.
Read more 👇
latitude.plos.org/2024/11/call...
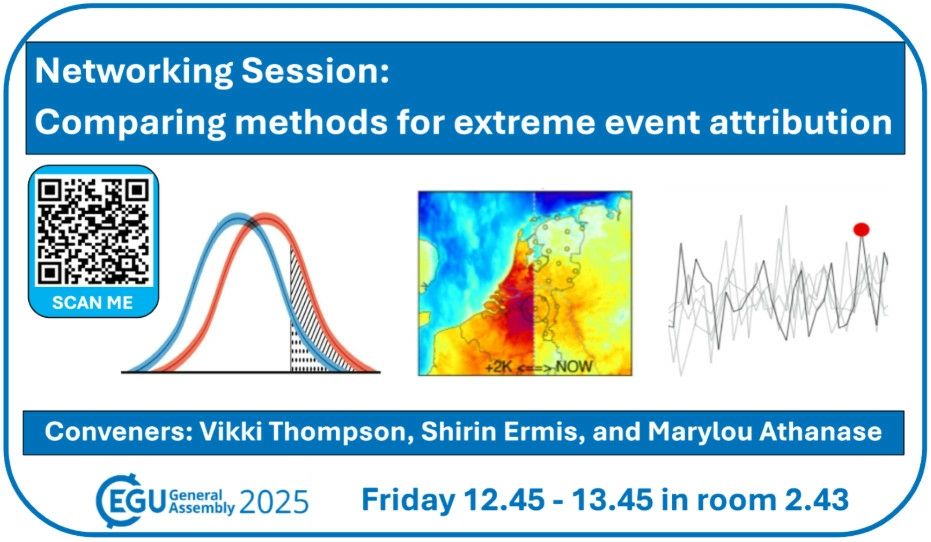
Leaflet of the EGU25 splinter meeting. Title: Networking session: comparing methods for extreme event attribution. Illustrations: plots from various attribution methods. Time and location: Friday 02.05, 12h45-13h45, room 2.43.
If you are attending #EGU25 and interested in the attribution of #climate extremes: consider joining our networking session on Friday noon!
We will exchange on existing methods, their strengths, and how to compare them:
meetingorganizer.copernicus.org/EGU25/sessio...
W/ @vikkithompson.bsky.social
I will be presenting our results at #EGU25 in a poster on Wednesday. 🌀 So if you'd like to chat about the Arctic Beaufort Gyre in CMIP6 models, find me there!
The poster: meetingorganizer.copernicus.org/EGU25/EGU25-...
The paper: agupubs.onlinelibrary.wiley.com/doi/full/10....