🌐 It's the EGU time of the year again!
The @egu.eu General Assembly 2025 will feature an extensive participation by #EERIEproject researchers. We’ve put together all the sessions in which they’ll participate and the posters they’ll have displayed.
Read below! ⤵️
eerie-project.eu/news/2025/04...
28.04.2025 08:53 — 👍 3 🔁 1 💬 0 📌 0
💼 Looking for a #job? We're #hiring!
The @awi.de is seeking to employ a skilled and motivated Scientist with expertise in Python programming and a solid background in oceanic, atmospheric or climate dynamics.
➡️ Check all the details on our website: eerie-project.eu/job-applicat...
04.04.2025 08:14 — 👍 9 🔁 7 💬 0 📌 3
🚨 Last chance to submit your application! 🚨
🌊 Scientist in High-Resolution Sea Ice Modeling
🔗 jobs.awi.de/Vacancies/19...
🧠 Scientist in AI-based Emulation for High-Resolution Sea Ice Modeling
🔗 jobs.awi.de/Vacancies/19...
Please share! 🧪❄️🌍 #ScienceJobs #SeaIce #AI
27.02.2025 07:36 — 👍 9 🔁 7 💬 0 📌 0
At AWI, we contribute to the EU #DestinationEarth (#DestinE) initiative with storyline simulations and more. These storylines explore how extreme weather events – like the 2019 Paris heatwave or the 2024 European floods – could unfold in different climate scenarios, like in a 2ºC warmer world.
24.02.2025 13:54 — 👍 1 🔁 0 💬 0 📌 0
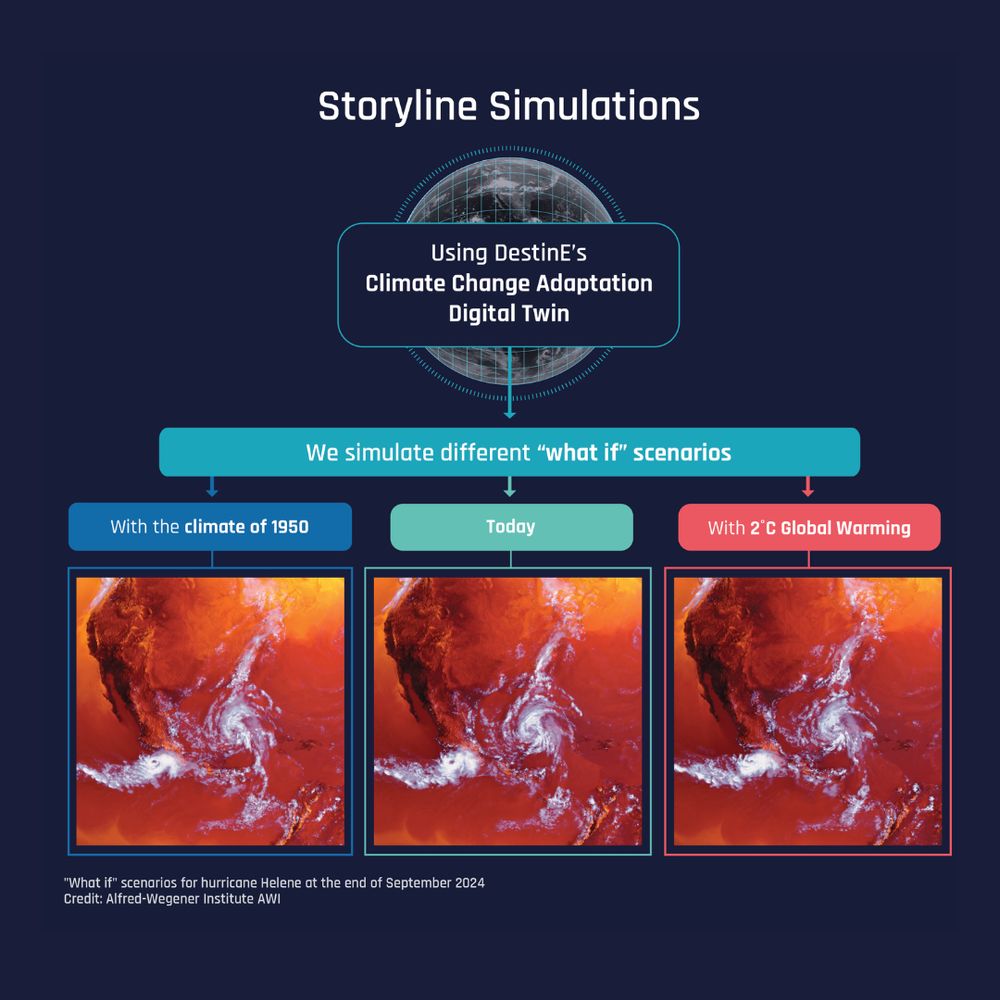
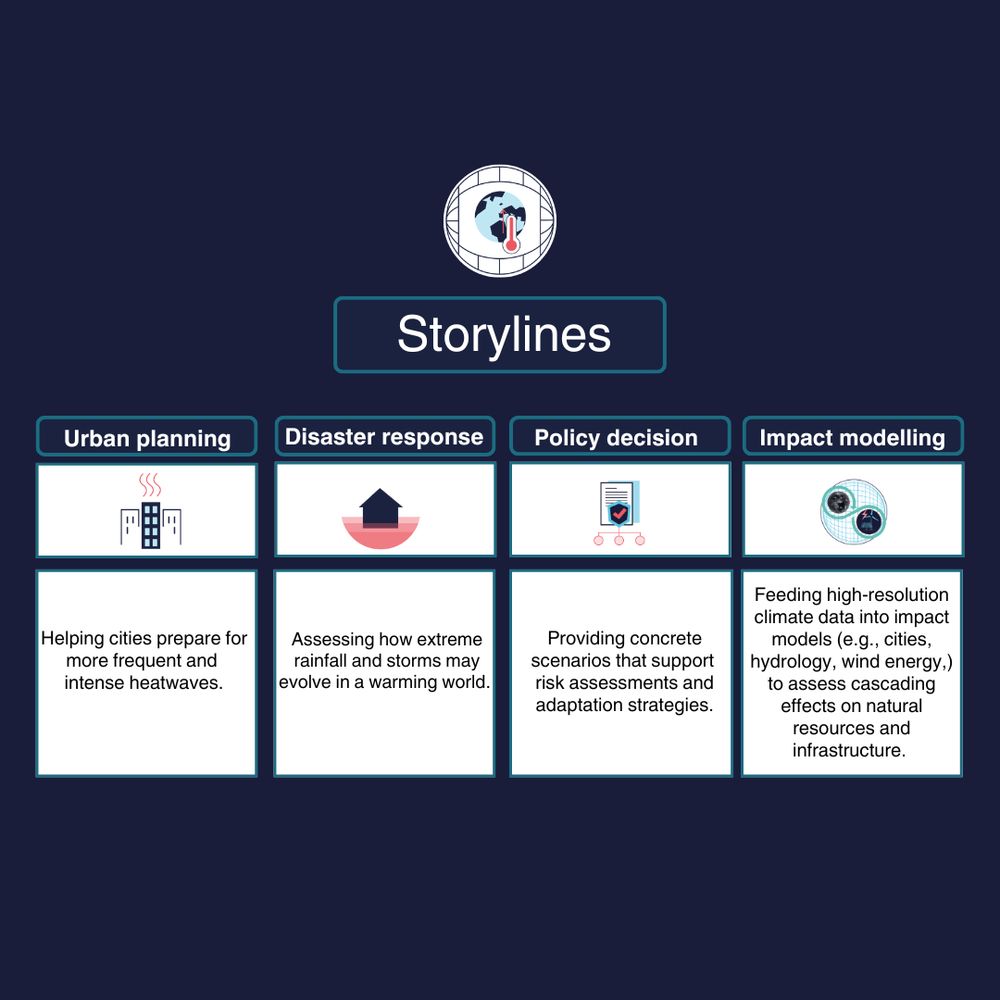
🌍🌐 What if we could replay recent extreme weather under different climate conditions? With storyline simulations in the EU’s #DestinE initiative, scientists are reconstructing past, present, and future extreme weather to help us adapt to climate change. Learn more ➡️ destine.ecmwf.int/news/replayi...
24.02.2025 09:52 — 👍 20 🔁 8 💬 1 📌 1
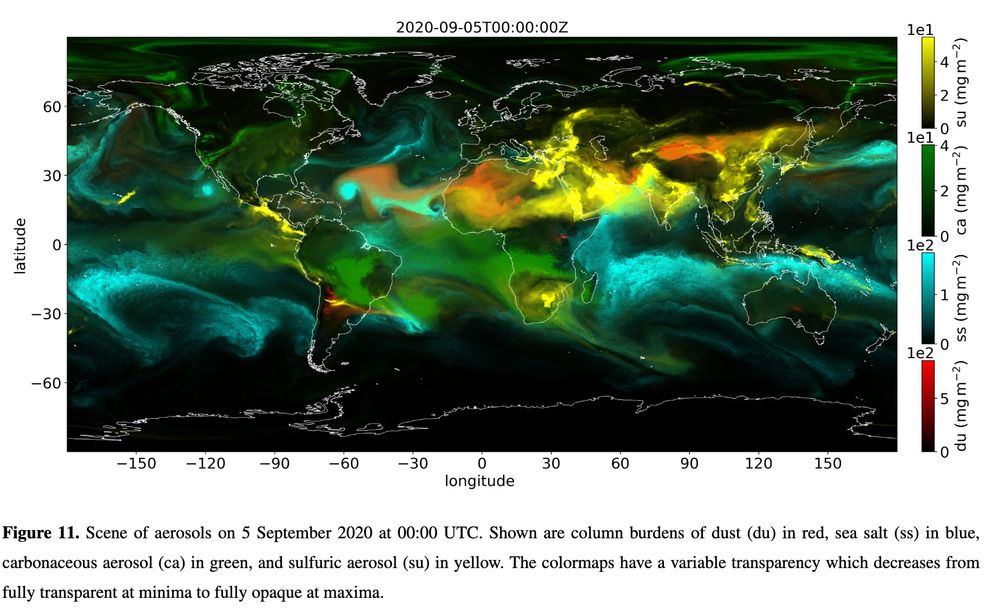
This image is a global visualization of aerosol distributions on September 5, 2020, at 00:00 UTC. It represents different types of aerosols using a color-coded scheme:
• Red represents dust (du), primarily visible over arid regions like the Sahara Desert and extending into the Atlantic.
• Blue indicates sea salt (ss), prominent over the oceans, particularly in stormy regions.
• Green signifies carbonaceous aerosol (ca), which is associated with biomass burning and pollution, visible over regions like the Amazon, Central Africa, and parts of Southeast Asia.
• Yellow shows sulfuric aerosol (su), often linked to volcanic emissions and industrial activity.
The image is overlaid on a world map with latitude and longitude markers. The transparency of the colors varies to indicate concentration levels, with fully transparent areas representing minimal aerosol presence and fully opaque areas representing maximum concentrations. The right-hand legend provides a scale for interpreting the aerosol concentrations in milligrams per square meter.
Preprint summarizing the first results from the nextGEMS project, which prepares several coupled models to run at kilometer scale: egusphere.copernicus.org/preprints/20... 🧪
19.02.2025 10:48 — 👍 12 🔁 4 💬 0 📌 0
Happy to share our latest paper, which summarizes the key outcomes of the Year of Polar Prediction (YOPP)—a decade-long international effort (2013–2022) led by the WMO’s World Weather Research Programme.
Read the full paper here: journals.ametsoc.org/view/journal...
12.02.2025 10:19 — 👍 1 🔁 0 💬 0 📌 0
🚨 Job Alert! 🚨
Our team is hiring for the @terradt.bsky.social project.
🌊 Scientist in High-Resolution Sea Ice Modeling
🔗 jobs.awi.de/Vacancies/19...
🧠 Scientist in AI-based Emulation for High-Resolution Sea Ice Modeling
🔗 jobs.awi.de/Vacancies/19...
Please share! 🧪❄️🌍 #ScienceJobs #SeaIce #AI
04.02.2025 09:50 — 👍 16 🔁 6 💬 1 📌 0
YouTube video by EERIE Project
#EERIE25 General Assembly summary
Thanks to the Swiss knives purchased during our time in #Zürich🇨🇭 for the #EERIE25 General Assembly, we've managed to slice and squeeze a three-day meeting into a 4-minute video summary 📹
▶️ Whether you attended or not, this you should not miss! www.youtube.com/watch?v=DezJ...
24.01.2025 10:38 — 👍 4 🔁 1 💬 0 📌 0
This is the description of our km-scale coupled climate model configuration. A lot of details in a thread from @trackow.bsky.social 🧪
13.01.2025 09:00 — 👍 17 🔁 3 💬 0 📌 0
Climate Change Adaptation Digital Twin
New webpage gives a concise overview of the Destination Earth (DestinE) digital twin on Climate Change Adaptation (Climate DT) and its functionalities, models, simulations and how to access data via the DestinE Platform.
destine.ecmwf.int/climate-chan...
18.12.2024 12:16 — 👍 1 🔁 0 💬 0 📌 0

Starting in 90 mins!👇
Info + link: eerie-project.eu/event/storms...
#ClimateResearchNet
16.12.2024 11:31 — 👍 3 🔁 1 💬 0 📌 0
Our work will also be (remotely) presented at #AGU24 !
agu.confex.com/agu/agu24/me...
Dec 11, 01:30pm - 02:30pm (Central Time)
Dec 12, 07:30am - 08:30am (Central Time)
10.12.2024 10:35 — 👍 14 🔁 5 💬 1 📌 1
Looking forward to present our recent storyline work on extreme hydological events in fall 2024
10.12.2024 10:50 — 👍 0 🔁 0 💬 1 📌 0
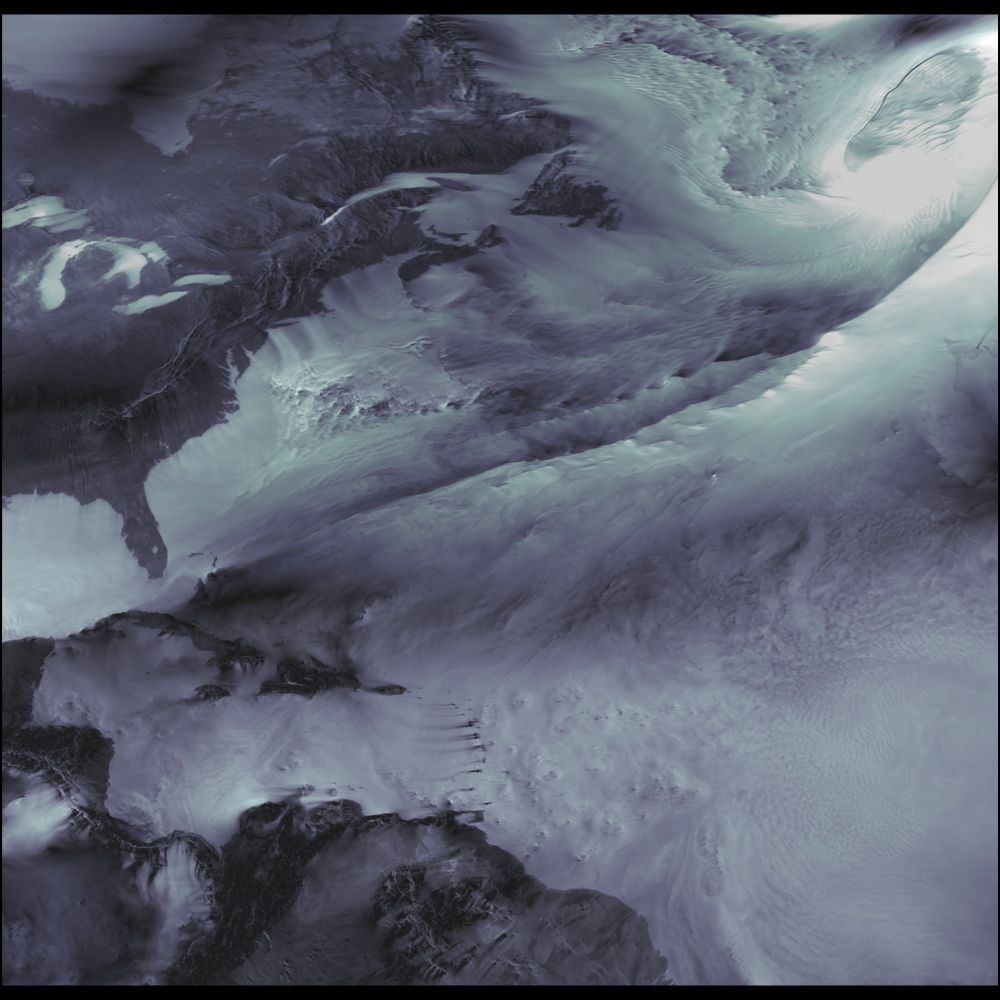
Wind over the Atlantic from a 5 km resolution model. Different surface types interact with wind in unique ways, which is why the continents are distinctly visible in the wind field. 🧪
Model: IFS-FESOM | U component of the wind | Project: nextGEMS | Simulations: @trackow.bsky.social
#SciArt
05.12.2024 10:26 — 👍 22 🔁 2 💬 0 📌 1
In 2023, global mean temperature approached 1.5K above pre-industrial levels, with our study suggesting that a record-low planetary albedo—driven by declining low-cloud cover—helps explain the unexplained portion of the warming beyond (expected) anthropogenic influences and El Niño.
05.12.2024 20:40 — 👍 10 🔁 2 💬 0 📌 0
AI-based weather models: promising future supporting climate science
AI-based weather models have made transformational progress in the last years. Find out more in a preprint paper co-authored by ECMWF and AWI.
This is joint work with many colleagues from @ecmwf.bsky.social, including @clessig.bsky.social @xpedruzo.bsky.social @jesper.drams.ch
@fpappenberger.bsky.social,and #AWI colleagues
@oceanographer.bsky.social @thomasjung.bsky.social
Read more on it here destine.ecmwf.int/news/ai-base...
(7/7)
02.12.2024 09:36 — 👍 4 🔁 2 💬 0 📌 0
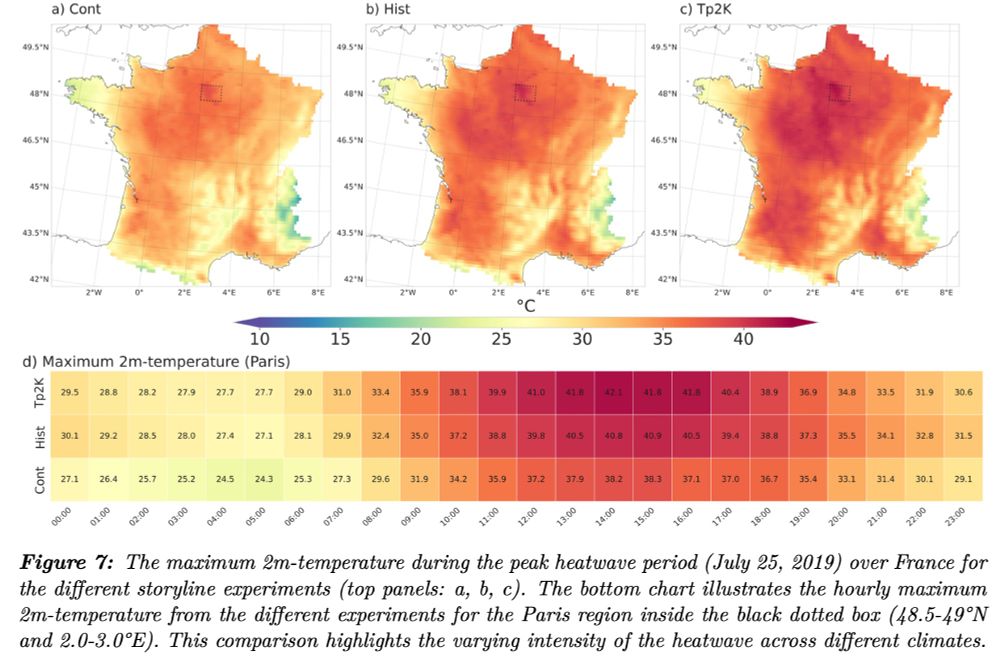
The maximum 2m-temperature during the peak heatwave period (July 25, 2019) over France for the different storyline experiments (top panels: a, b, c). The bottom chart illustrates the hourly maximum 2m-temperature from the different experiments for the Paris region inside the black dotted box (48.5-49°N and 2.0-3.0°E). This comparison highlights the varying intensity of the heatwave across different climates.
The storyline approach isn’t new, but for the first time, we’re using it with 10km resolution! 🌍 See how extreme events might have looked in the past, without climate change, and how they could unfold in a +2°C future. Check out our work led by Amal John: essopenarchive.org/users/852952...
25.11.2024 12:05 — 👍 13 🔁 6 💬 1 📌 0
🌊 Ocean currents around Antarctica from our high-resolution (3 km) ocean model. 🧪
#FESOM #SciArt
29.11.2024 08:19 — 👍 250 🔁 61 💬 6 📌 9
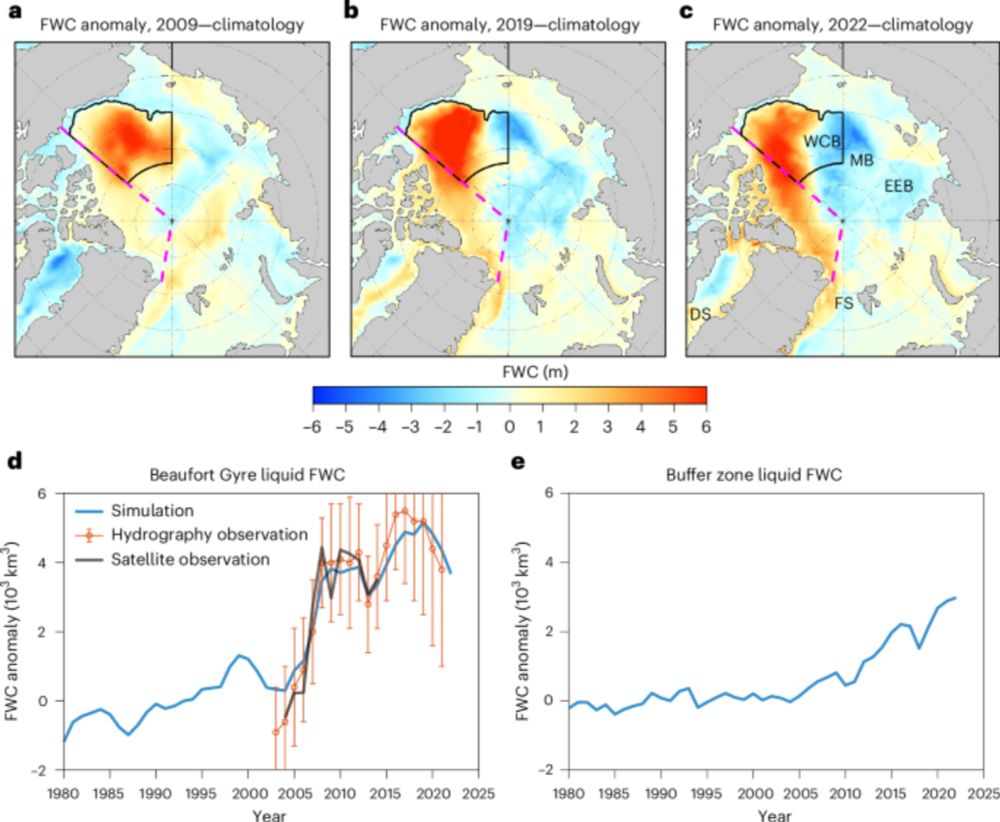
Inaugural first #BlueSky post, re-sharing our latest paper!
Still on the front page of Communications Earth & Environment 👇
doi.org/10.1038/s432...
26.11.2024 07:24 — 👍 38 🔁 8 💬 3 📌 0
We research ice, ocean and climate.
Website: www.awi.de
Imprint: https://www.awi.de/en/imprint.html
Oceanographer researching Mesoscale Eddies, Arctic Ocean Dynamics, Ocean-Sea Ice Interactions, km-scale modelling.
Opinions are my own
Oceanographer and PhD candidate in Paleoclimate Dynamics at AWI. Working with model development and warm paleoclimates. Born at 360.67ppm. Opinions are my own
Climate scientist | Km-scale modelling & storylines
Physicist working on Climate | Copernicus @ecmwf | data, society and decisions | services. Opinions are my own.
Geophysicist at the Alfred Wegener Institute (@awi.de) und 🇩🇪, Research focus: 🌊🧊🛰️ #seaice thickness #remotesensing using satellite #altimetry. Also @sthendric@fediscience.org
Views are my own.
Switzerland-wide, science based operational weather and climate services for society and authorities.
Hydrological modeler 💧@ UFZ • Science enthusiast • Professor of Data Science and Hydrology @ Uni-Potsdam • Passionate photographer 📷 🎞️
https://mhm-ufz.org/
Principal Scientist at #ECMWF and Professor of Atmospheric Physics at the University of Reading - Radiative Transfer - Co-Chair of ESA-JAXA #EarthCARE Mission Advisory Group
Professor at ETH Zurich, IPCC WGI Vice-chair.
#Climate #Extremes #Land.
Citizen/mum/scientist. Personal account.
https://www.ipcc.ch/report/ar6/wg1/downloads/report/IPCC_AR6_WGI_Chapter11.pdf
Twitter/X: @SISeneviratne
https://www.iac.ethz.ch/people/sonia
Deputy Director-General & Director of Forecasts @ECMWF - views are my own
I've been programming computers since the late 60s. In those days they didn't have computers in schools, so we had to build our own.
What can I program next? Will I have to build it first?
Editor: http://West-Devon.info
AKA: http://scicomm.xyz/@Jim_Hunt
Ice, ocean, and climate scientist at @antarcticsurvey.bsky.social. Views my own.
atmospheric physicist University of Oxford @OxfordAOPP and @ECMWF | predictability of weather and climate | NCAS @AtmosScience
Happily retired meteorologist into tech and photography.
physical oceanographer, climate scientist, advocate for blue skies research, educator, brompton rider, aspiring jazz musician, european 🇬🇧🇪🇺🇮🇪
Nature Portfolio’s high-quality products and services across the life, physical, chemical and applied sciences is dedicated to serving the scientific community.
Cutting-edge research, news, commentary, and visuals from the Science family of journals. https://www.science.org


