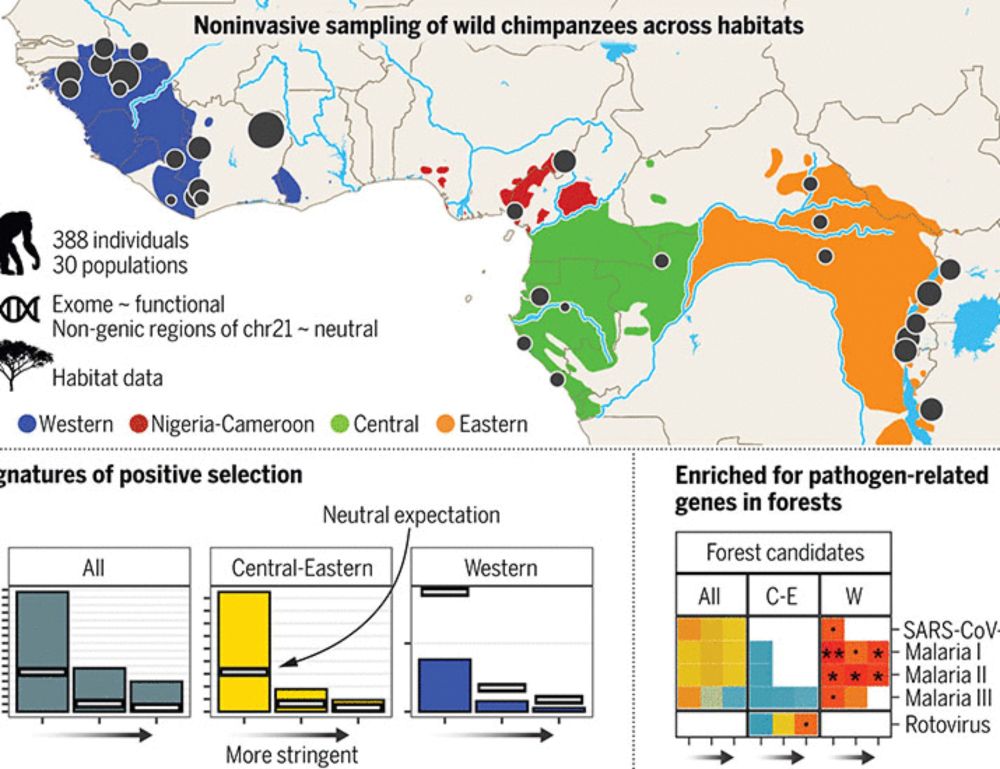
#PhageSky A bacterial long-term evolutionary tradeoff, dating as far as 200 years in the past.
Very proud to have a small contribution in this great work from Karasov & Burbano Labs led by @taliamycota.bsky.social & Jiajun Cui & Emma Caullireau. Please read the thread by @hernanaburbano.bsky.social:
19.11.2025 17:09 — 👍 8 🔁 2 💬 0 📌 0
Hmmm.... Only part of it. The complete answer is only revealed in my seminar 🤣
15.11.2025 02:36 — 👍 2 🔁 0 💬 0 📌 0


What a great week at Nanjing Agricultural University! Huge thanks to Prof. Souomeng Dong for the invitation to share my research and to his entire team for being such generous hosts. I learned so much from hearing about their work and am thrilled about our future plans together
14.11.2025 11:14 — 👍 15 🔁 1 💬 1 📌 0
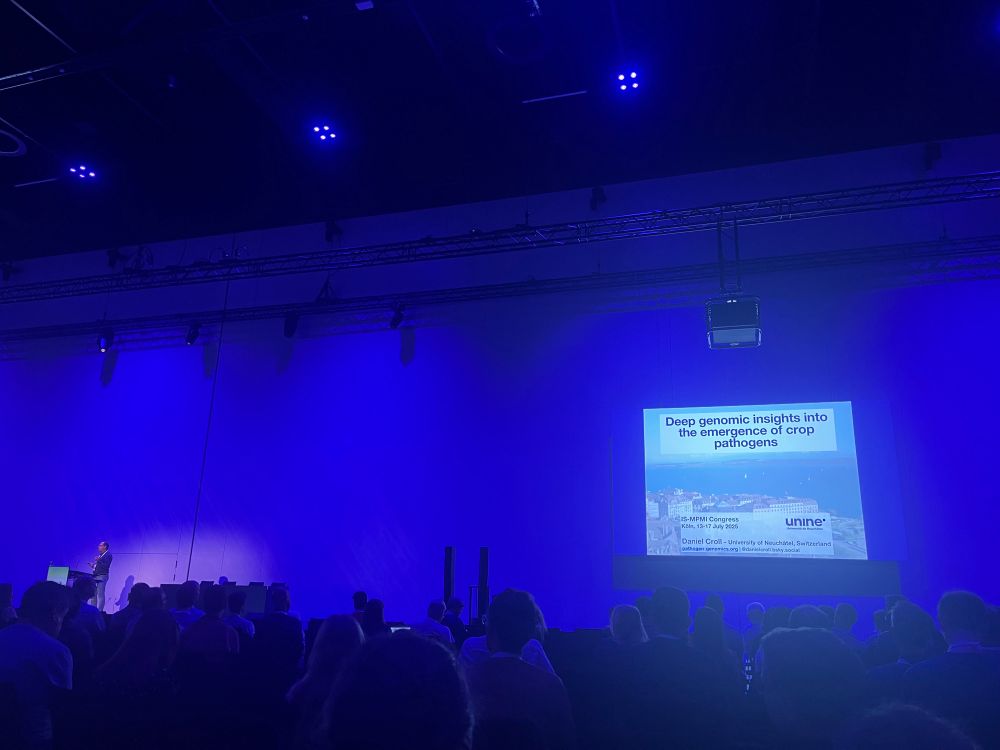
#2025ISMPMI @danielkroll.bsky.social presenting large scale comparative genomics of fungicide resistance evolution and new pathogen strains emergence
16.07.2025 07:23 — 👍 7 🔁 3 💬 1 📌 0
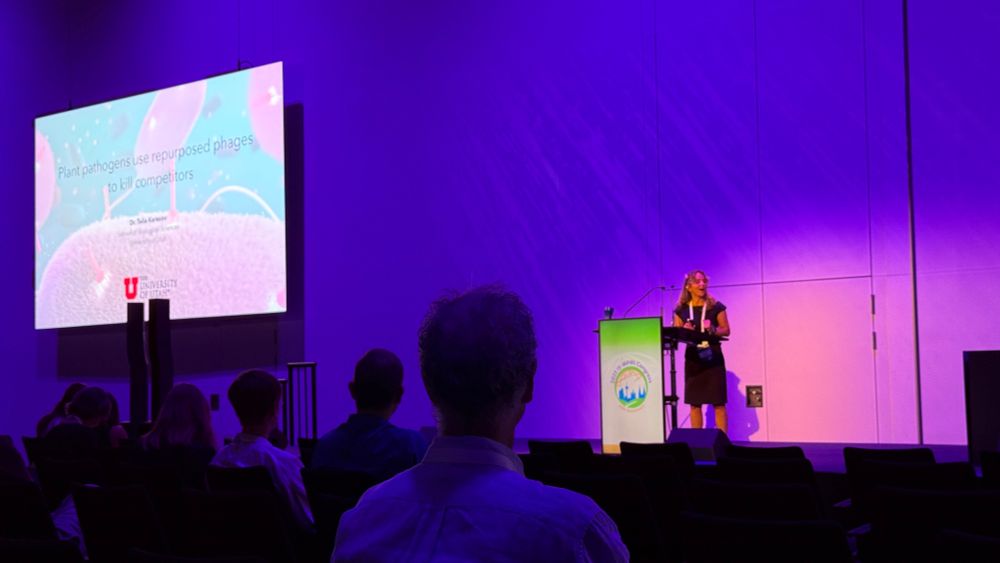
Happening now...
15.07.2025 08:02 — 👍 3 🔁 0 💬 0 📌 0
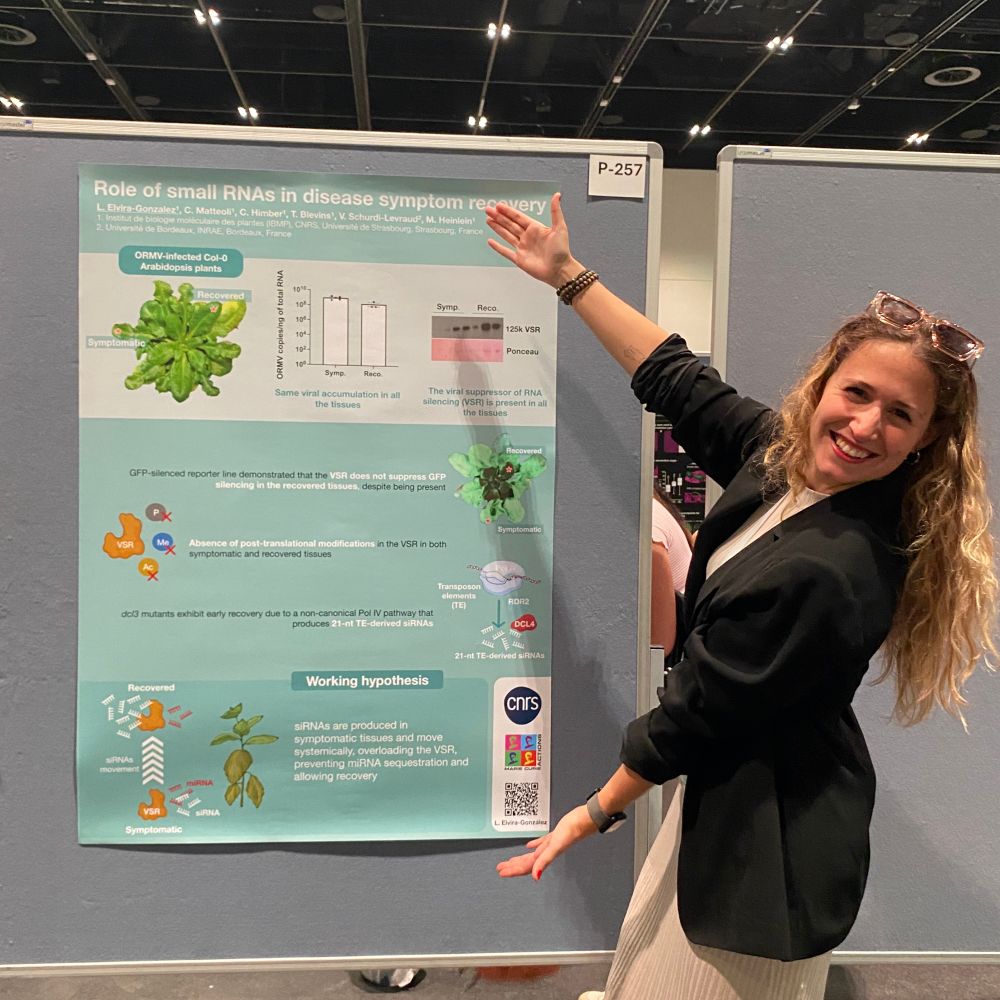
How Rice Blast Fungus stays one step ahead? I'll talk about the evolutionary dynamics of its pangenome.
Whether you're into evolutionary insights, curious about methods, or just love a good fungal story, swing by my poster:
* P-280
* Tuesday, 9:55-11 :30
#2025ISMPMI
13.07.2025 09:42 — 👍 3 🔁 4 💬 0 📌 1
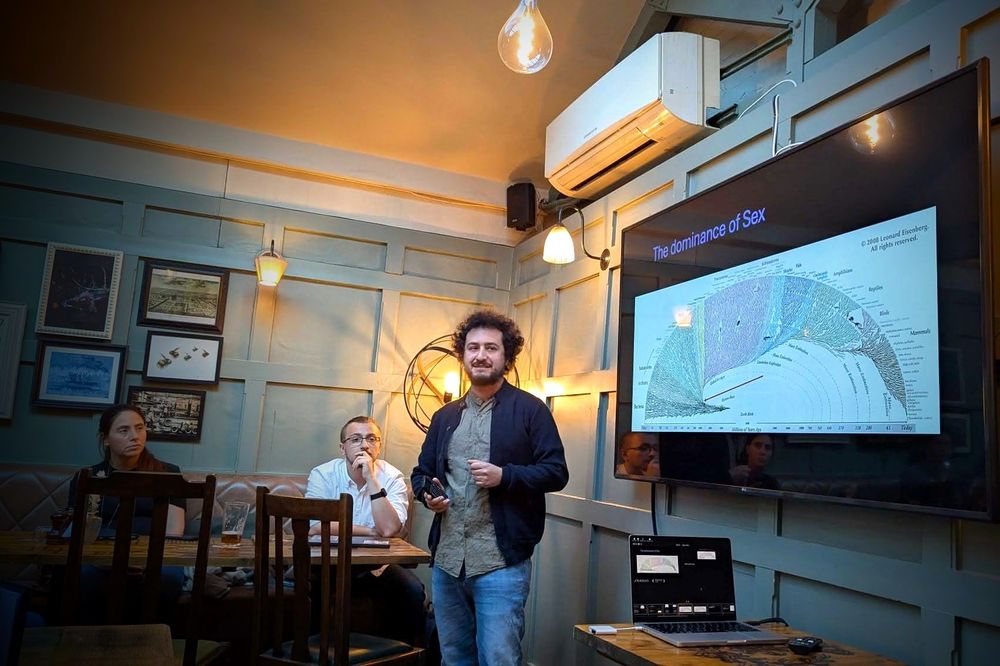
Thanks for having me at #pint25
Great discussing #evolution and #pandemics with such a wonderful audience
@pintofscience.uk @uclopenscience.bsky.social @ucllifesciences.bsky.social
22.05.2025 16:40 — 👍 18 🔁 4 💬 0 📌 0
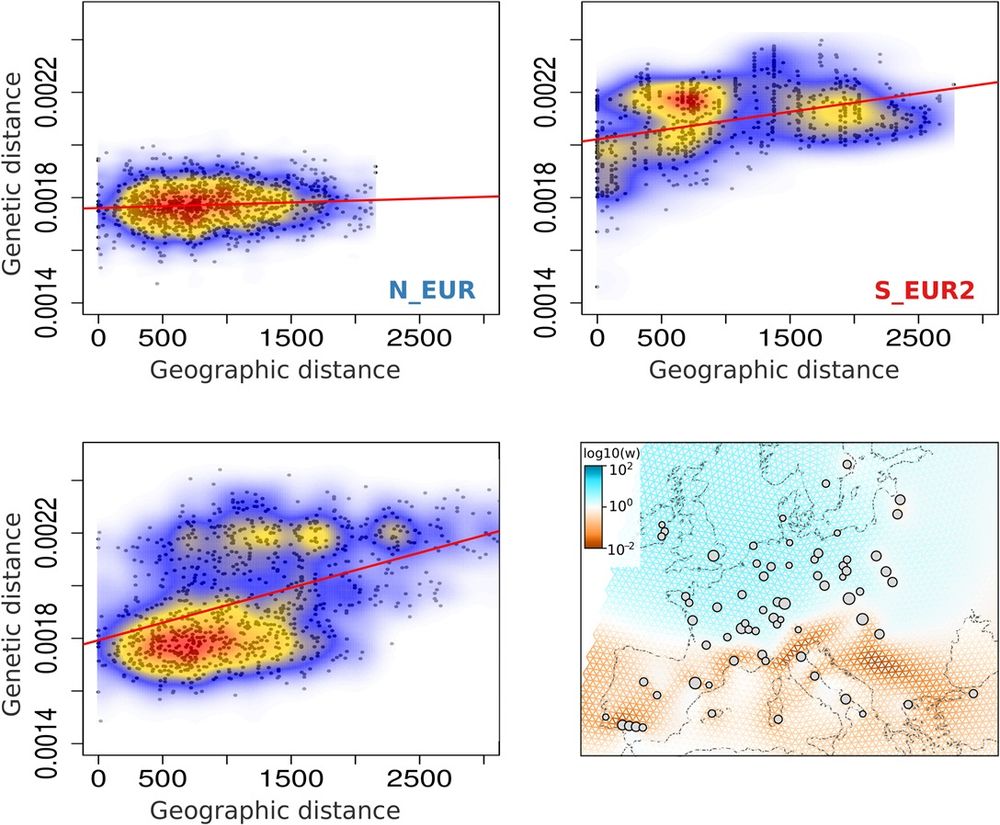
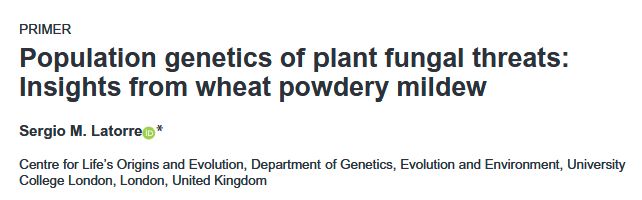
Spatial population structure of wheat powdery mildew in Europe. Isolation-by-distance in the Europe+_2022_2023 samples belonging to the N_EUR population (top left), S_EUR2 population (top right), and the complete Europe+_2022_2023 dataset (bottom left). Genetic distance is the number SNPs between a pair of individuals, scaled by the total number of loci compared. Geographic distance is measured between sampling locations of pairs of individuals, in kilometers. The colors represent the density of the data points, with warmer colors corresponding to higher density. 1,000 randomly sampled data points for each dataset are plotted in black. Bottom right: Effective migration surfaces estimated using FEEMS for the Europe+_2022_2023 dataset. The colors indicate the inferred relative intensity of gene flow along each edge of the spatial graph. Orange corresponds to lower-than-average effective migration and blue, higher-than-average. The grey circles show the nodes of the spatial grid the samples were assigned to, based on their sampling locations. The size of the node is proportional to the number of samples assigned.
#PopulationGenetics of microbial #pathogens can inform decisions that impact society; @smlatorreo.bsky.social explores a @plosbiology.org study on wheat powdery mildew #fungus which uses genomic data to predict continental-scale dispersion routes 🧪 Paper: plos.io/43qfH9F Primer: plos.io/44YjHQN
07.05.2025 08:44 — 👍 15 🔁 4 💬 0 📌 0
A primer by Sergio Latorre @smlatorreo.bsky.social tinyurl.com/ye8zwcrc on the paper by Jigisha et al. "Popgen and molecular epidemiology of wheat powdery mildew" @plosbiology.org tinyurl.com/357nkey8 @ucllifesciences.bsky.social @cloeucl.bsky.social
06.05.2025 08:25 — 👍 11 🔁 5 💬 0 📌 0
Great read to start the 2025 with a good dive into plant pathogen genomics. Thanks for this beautiful work @wagnercfagundes.bsky.social @thorstenlangner.bsky.social
24.01.2025 10:45 — 👍 5 🔁 1 💬 2 📌 0
Evolutionary biologist at https://www.umontpellier.fr/ and https://isem-evolution.fr/ .
Molecular-evolution and PopGen
Insects; orthoptera; hymenoptera; diptera
Birds & mammals
OpenScience
Teacher at https://biologie-ecologie.com/departement/
Serra Hunter Lecturer Professor at Universitat de Barcelona. Interested in human population diversity.
Postdoctoral scholar at UChicago (https://kreinerlab.com/), studying how plants adapt to changing environments and strong selective pressures.
https://rozenn-pineau.github.io/academic-website/
Evolutionary genetics of plant-insect interactions. Sault Tribe Chippewa. Currently at Arizona State University
Interested in fungi and plant-pathogen interactions🌱 currently working with @talbotlabtsl.bsky.social 🇮🇨🇦🇷🇬🇧
Postdoc at Stukenbrock lab @envgenlab.bsky.social
Interested in the functional diversification of effectors! 🌾🧬
Interested in Plant Immunity & Structural Biology, Researcher in Kemmerling Lab, ZMBP, Tübingen, DAAD Scholar at TU Münich, MTech in IIT Kharagpur
Post-doc in @teamthomma.bsky.social
Interested in genomic evolution of fungi
father of 3, nature lover, sailor, Homo faber. Prof at Imperial College London, for a little while yet.
Associate Professor, Microbial Genome Evolution, Utrecht University, the Netherlands
Connect with leading researchers in the field of molecular, cellular, and developmental biology, genetics, genomics, proteomics, and molecular ecology. https://www.ismpmi.org/Pages/default.aspx
Professor at UC Davis, studying plant immunity and bacterial pathogens. Loves weightlifting, running, and the outdoors.
Scientist mostly interested in Molecular Plant-Virus Interactions | Postdoctoral Researcher in @geminiteamlab.bsky.social (ZMBP, Tübingen) | Traveler | Hiker | LesMills fan| Plant lover
ORCID: 0000-0001-8362-8087
Postdoc researcher in ZMBP at University of Tübingen . Plant immunity and Induced resistance. Enjoy traveling, cooking and reading. 日本語を勉強しますので時々未熟な日本語使います。
Junior Group Leader-Bacterial Apoplast Modulators (BAM) Lab-ZMBP, Tübingen.
The BAM group explores how apoplast dwelling bacteria manipulate their host environment to cause disease.
Mother|| STEM enthusiast || Plant Biologist || Science Communication || Nature photography || Traveller || Bibliophile
Plant scientist 🌱🦠🧫 🇲🇽 | Postdoc at the University of Zurich in the Cyril Zipfel and Pedro Beltrao groups, studying protein phosphorylation during plant–microbe interactions #EMBOfellow | @thesainsburylab.bsky.social alumni
A career network featuring science jobs in academia and industry.
Visit our platform at www.science.hr