Thanks, dad. Yes, air will become more humid as it travels along the length of a lake's surface. I believe this effect is included in some more sophisticated lake evaporation models but we kept it simple in ours
28.02.2026 00:27 — 👍 0 🔁 0 💬 0 📌 0Thanks, dad. Yes, air will become more humid as it travels along the length of a lake's surface. I believe this effect is included in some more sophisticated lake evaporation models but we kept it simple in ours
28.02.2026 00:27 — 👍 0 🔁 0 💬 0 📌 0
Cross correlation results for lagging outflow discharge estimates at 779 lakes. (a) Map showing each lake’s lag time in days at the highest Spearman correlation (ρ). (b) The percentage of natural lakes and reservoirs based on the lag time with the highest ρ.
Our new paper uses #SWOT_satellite data to differentiate between natural & managed lake dynamics across North America. We find that inflows & outflows of managed lakes are significantly more variable than natural lakes, revealing signatures of reservoir operations: doi.org/10.1088/1748...
19.02.2026 22:38 — 👍 7 🔁 2 💬 0 📌 0 29.01.2026 22:18 —
👍 4
🔁 0
💬 0
📌 0
29.01.2026 22:18 —
👍 4
🔁 0
💬 0
📌 0

New paper by Katie McQuillan leverages satellite radar to map lake evaporation at 25× finer resolution than operational surface analysis products, opening up applications from improved gauge placement to evaluating geoengineering strategies doi.org/10.1109/LGRS...
29.01.2026 22:18 — 👍 3 🔁 0 💬 2 📌 1Thanks, Dad
06.12.2025 18:17 — 👍 0 🔁 0 💬 0 📌 0
New paper is featured on the cover of GSA Today 🥳
We show that the #SWOT satellites's radar observations are a valuable new source of data for studying river processes/ fluvial geomorphology.
Led by Molly Stroud @mollystroud.bsky.social @vt-science.bsky.social
Paper: doi.org/10.1130/GSAT...
Time to get your public comments in on the proposed Waters of the U.S. rule that would strip protections for countless wetlands and streams.
Trout unlimited has a tool on their page that will automatically send your message to the EPA as well as your representatives:
www.tu.org/conservation...

Grad students in my group participate in the 2025 Flip the Fair science fair and research expo in Salem Virginia
19.11.2025 19:57 — 👍 4 🔁 0 💬 0 📌 0
Global Rivers Group members: Emily Ellis, Steve Yoon, Yohtaro Kobayashi, David Go, Hana Thurman, and George Allen show off their mussels at the Claytor Lake Mussel Salvage event

Yohtaro Kobayashi and Hana Thurman search for native mussels as David Go and Emily Ellis clean up trash in the background
This weekend my research group volunteered at the Claytor Lake Mussel Salvage event near Blacksburg, VA. We surveyed and relocated hundreds of native mussels during the scheduled biennial lake drawdown. #UtProsim
@vtgeosciences.bsky.social @vt-science.bsky.social

Join the Global Flood Partnership (GFP) 2025 Fall Webinar Series!
On November 19, 2025 (16:00 CET), we bring you three expert talks on how Earth-Observation data is transforming flood mapping, risk assessment, and resilience strategies.
Register here: lnkd.in/gjYX3GV8
See also: lnkd.in/gRQFuk_J

Another SWOT Science Team Meeting for the books!
17.10.2025 16:48 — 👍 5 🔁 0 💬 0 📌 0
27 things we wish we’d known when we started our PhDs
Nature’s survey of PhD candidates reveals hard-won wisdom on choosing supervisors, managing mental health and surviving academic culture.

We’re on Capitol Hill with 225 Earth & space scientists — including @aas.org and @planetarysociety.bsky.social — urging Congress to reopen the government and protect NASA science. 🚀🌍
Join us: buff.ly/a3YuGgY
#ScienceIsEssential #AGU

First NISAR L-band images released! They look great! www.jpl.nasa.gov/news/nasa-is...
25.09.2025 20:17 — 👍 6 🔁 1 💬 0 📌 0Looking for a postdoc, and interested in river-coastal linkages, #remote sensing, and time series analysis? Come work with us @natureatcal.bsky.social on an exciting project led by @rachelspatial.bsky.social! CC @sfs-src.bsky.social @aslo.org @cerfscience.bsky.social @caseagrant.bsky.social
23.09.2025 00:30 — 👍 18 🔁 26 💬 0 📌 1Volcanic island somewhere?
27.08.2025 11:27 — 👍 1 🔁 0 💬 0 📌 0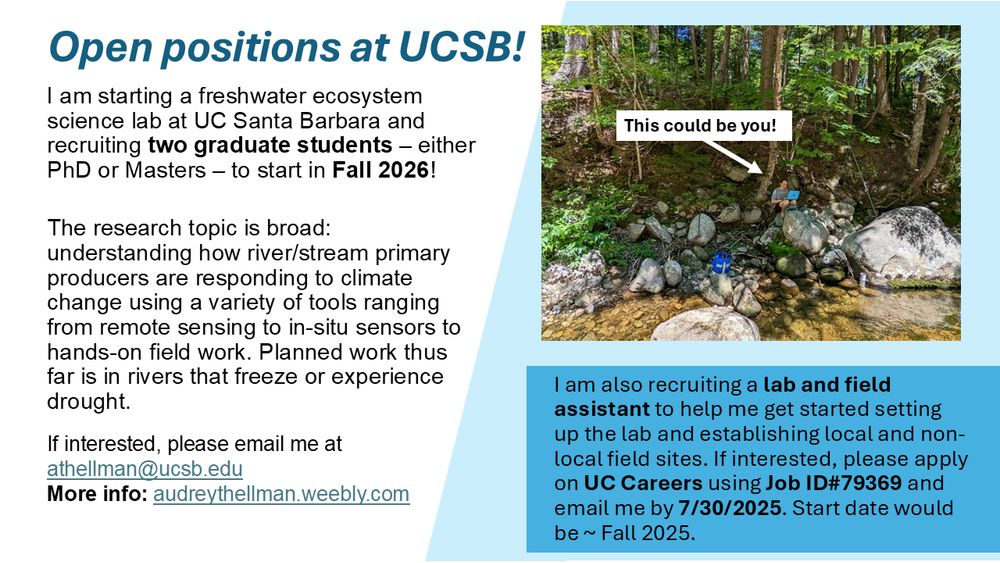
Ad for 2 graduate student positions and and 1 lab and field assistant position at UCSB. More info go to audreythellman.weebly.com
Hello freshwater friends! I’m starting a lab(!!) and recruiting 2 students to start Fall 2026 and a lab/field assistant to start this Fall 2025! Research topic is broad: rivers 🛶, ice/snow ❄️, nutrients 🍂, algae 🌱see below for more info
Please pass this along to any interested folks :)
Correct! SWOT has a 21-day repeat orbit but most places are observed more frequently because of swath overlap
13.07.2025 00:42 — 👍 1 🔁 0 💬 0 📌 0
Absolutely - we are developing a method to automatically identify and track these flood waves with SWOT. Stay tuned! In the meantime, here's the first paper on the topic if you're interested: agupubs.onlinelibrary.wiley.com/doi/full/10....
12.07.2025 15:51 — 👍 1 🔁 0 💬 0 📌 0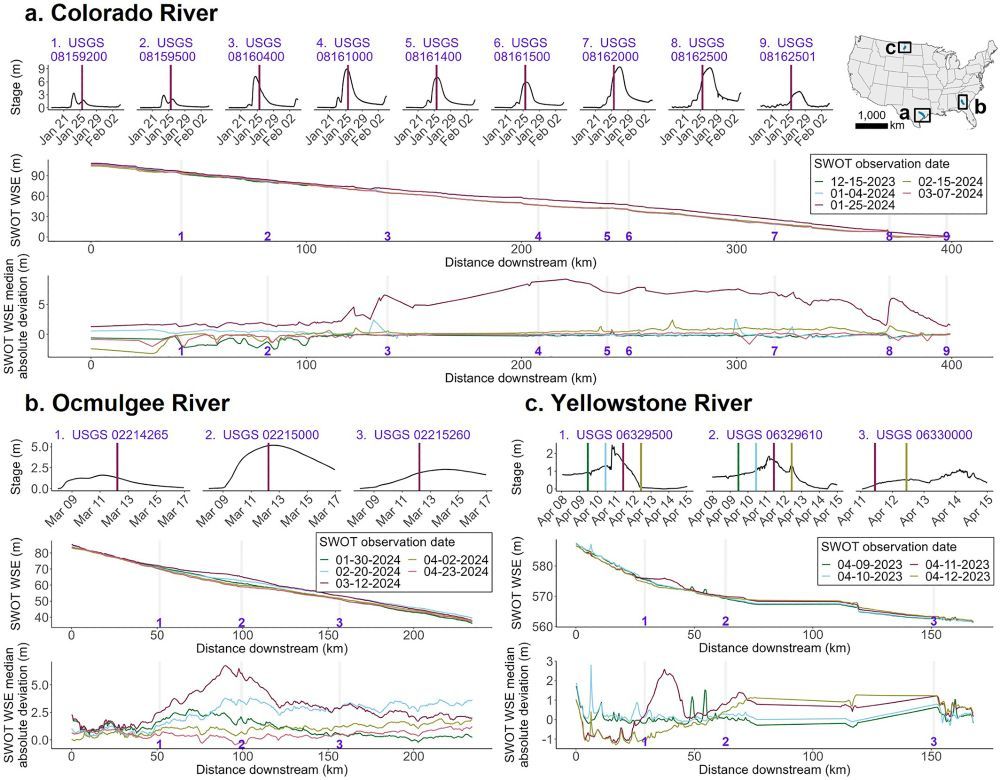
"Seen" meaning retrieved water surface elevation data over rivers while a flood wave is propagating down a river. Here are three examples of flood waves/flow waves traveling down rivers, including one in the Colorado River, TX - near the Guadalupe River:
12.07.2025 15:49 — 👍 1 🔁 0 💬 1 📌 0Flood waves like those that devastated Texas last week can be seen by the NASA #SWOT satellite. Another reason to support #NASA Earth Science
11.07.2025 17:17 — 👍 12 🔁 3 💬 1 📌 0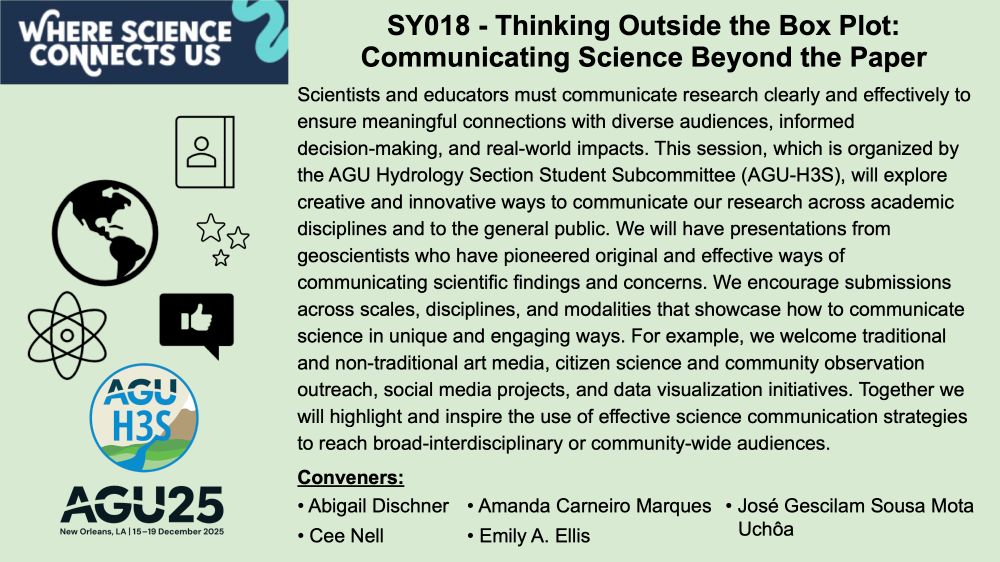
AGU H3S invites you to submit an abstract to our session at #AGU25 Thinking Outside the Box Plot:
Communicating Science Beyond the Paper! The session explores creative ways to communicate research. Conveners: @adischner.bsky.social
@acarneiromar.bsky.social
@gescilam.bsky.social
Cee Nell
Emily Ellis
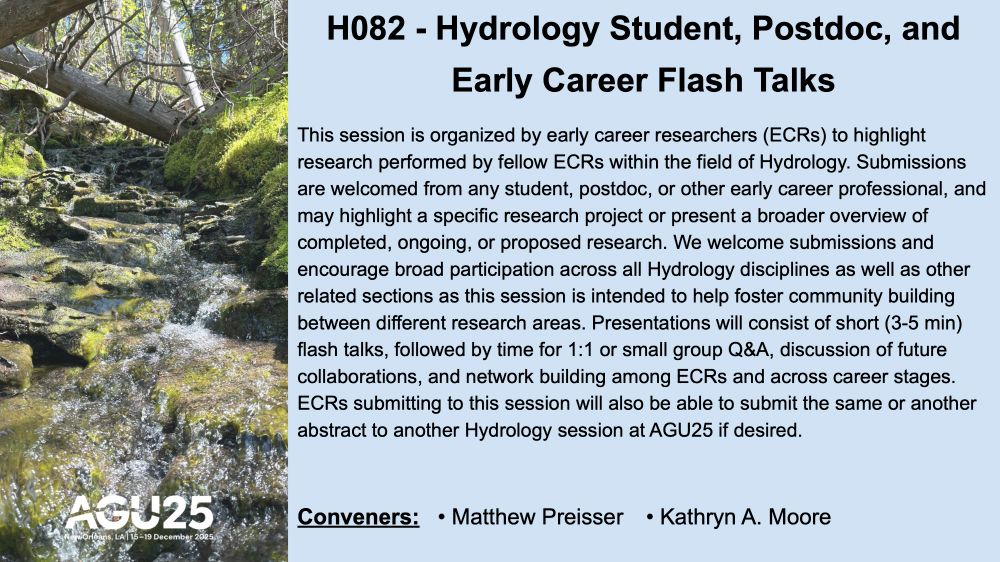
AGU H3S invites you to contribute to our session at #AGU25 Hydrology Student, Postdoc, and
Early Career Flash Talks! This session highlights
research performed by fellow Early Career Researchers within the field of Hydrology. Conveners: Matthew Preisser and Kathryn Moore
Hang in there and give yourself a break!
25.06.2025 01:03 — 👍 0 🔁 0 💬 0 📌 0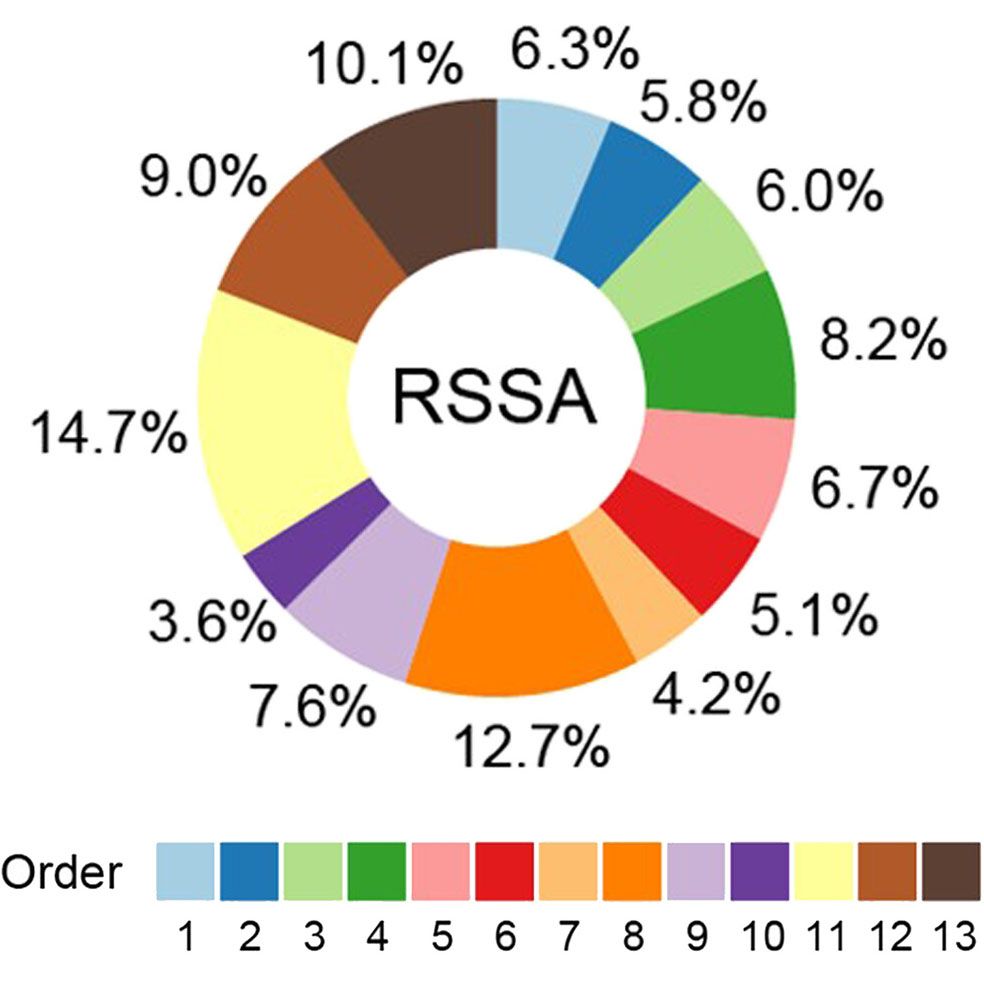
Donut chart shows the relative contributions of each stream order to basin total river and stream surface area (RSSA)
This has implications for how we calculate river and stream surface area (RSSA) at the global scale
19.06.2025 14:10 — 👍 2 🔁 0 💬 0 📌 0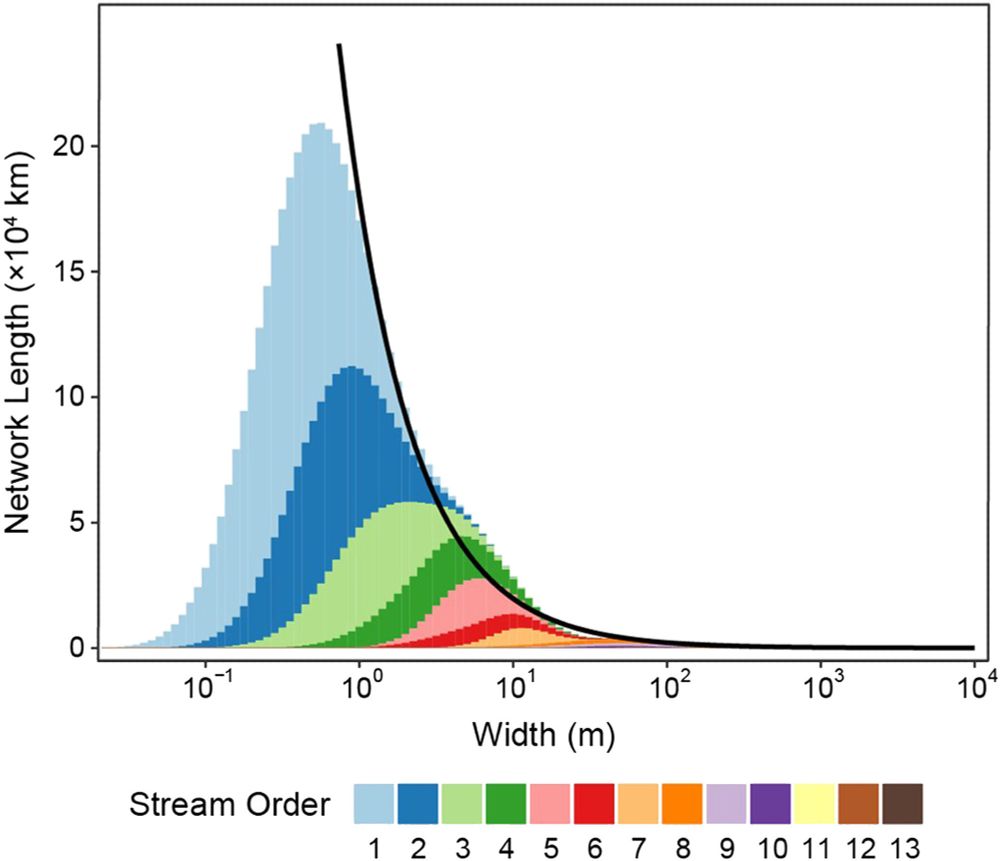
Stacked histograms of river widths colored by stream order in the Mississippi basin
Scaling these widths across the Mississippi basin, we find an emergent fractal distribution of river widths (black line)
19.06.2025 14:10 — 👍 2 🔁 0 💬 1 📌 0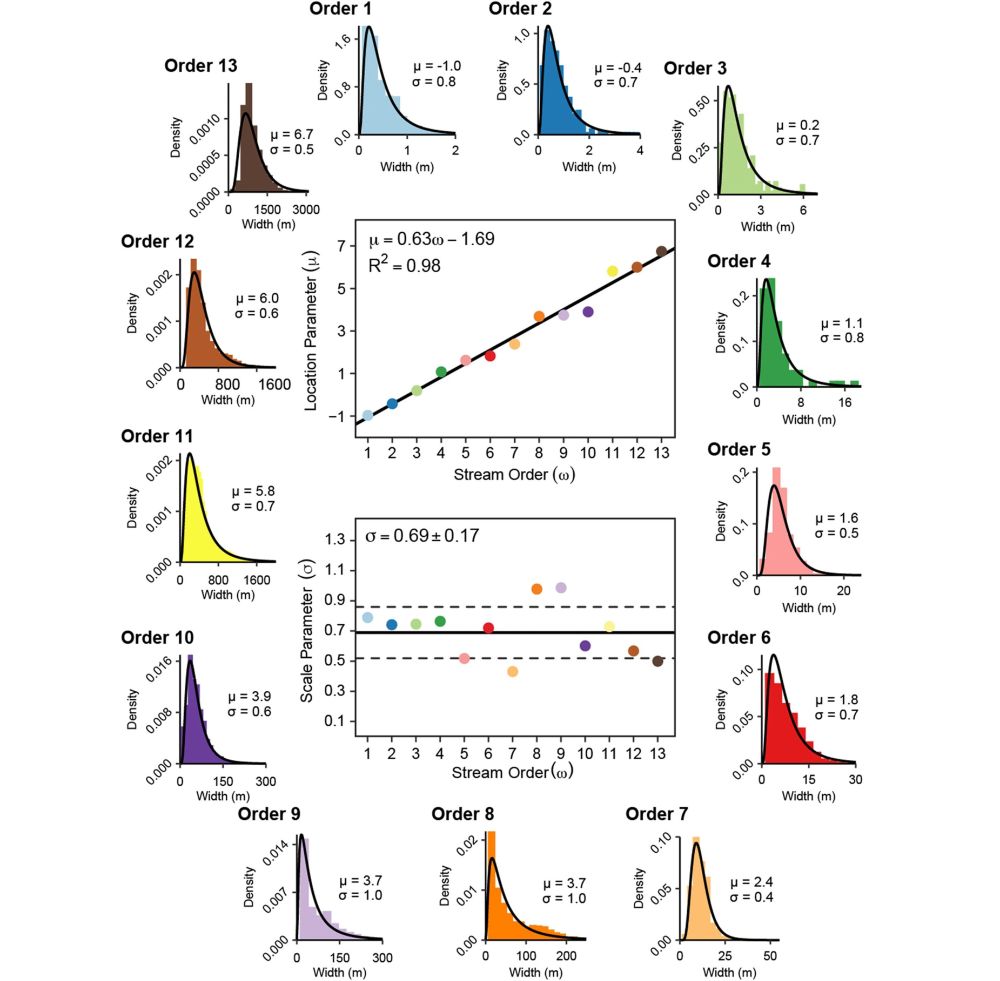
River widths of each stream order exhibit predictable log-normal distributions.
🚨New paper🚨 shows a remarkably clean relationship between river width and stream order across the US
𝑇ℎ𝑒 𝑊𝑖𝑑𝑡ℎ𝑠 𝑜𝑓 𝑅𝑖𝑣𝑒𝑟𝑠 𝑎𝑛𝑑 𝑆𝑡𝑟𝑒𝑎𝑚𝑠 𝐴𝑐𝑟𝑜𝑠𝑠 𝑆𝑝𝑎𝑡𝑖𝑎𝑙 𝑆𝑐𝑎𝑙𝑒𝑠... 🔗 doi.org/10.1029/2025...
#hydrology #geomorphology #rivers #RemoteSensing
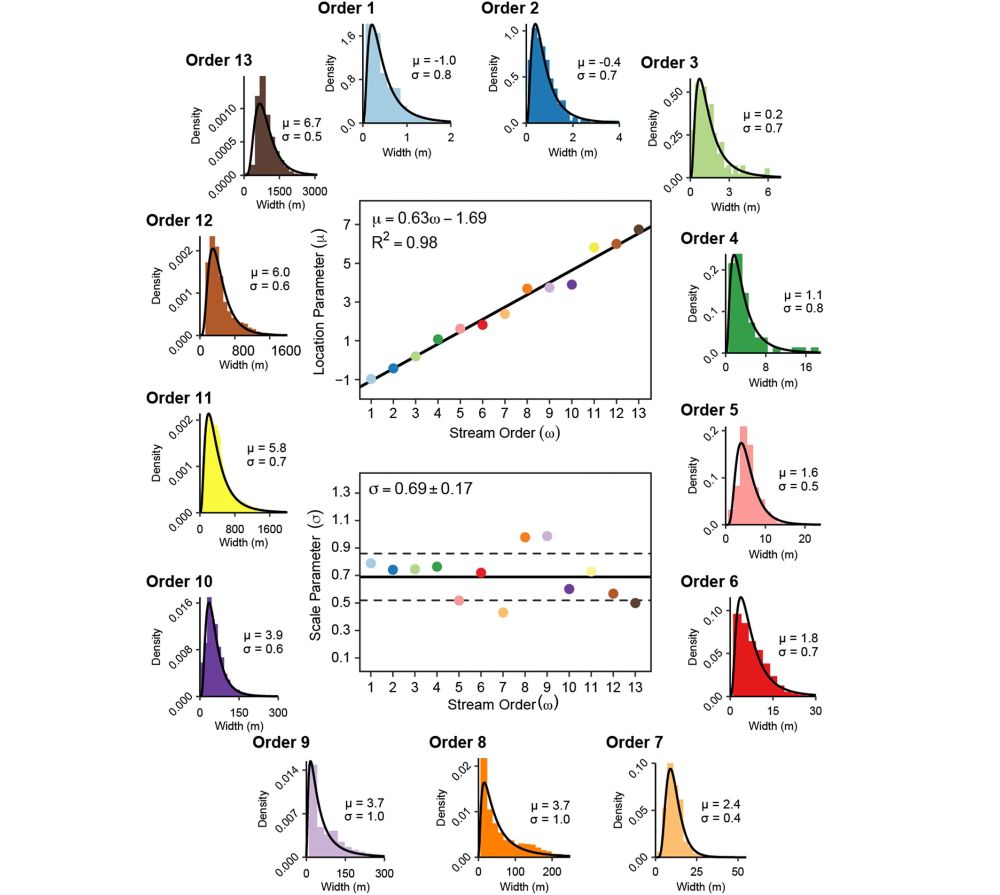
River widths of each stream order exhibit predictable log-normal distributions. Outer plots show distribution of river width measurements by stream order with fitted log-normal functions. Location parameter (μ) and scale parameter (σ) of log-normal fits are shown on each plot. Inner scatterplots show linear relationship between stream order (ω) and log-normal location parameter (upper scatterplot) and scale parameter (lower scatterplot).
Using multi-scale remote sensing and fieldwork, we found that river widths of each stream order exhibit a very predictable log-normal distribution:
16.06.2025 15:47 — 👍 0 🔁 0 💬 0 📌 0
The Washington Post also covered our paper! Here's the article with a soft paywall: wapo.st/43UuquB
03.06.2025 15:55 — 👍 6 🔁 2 💬 0 📌 0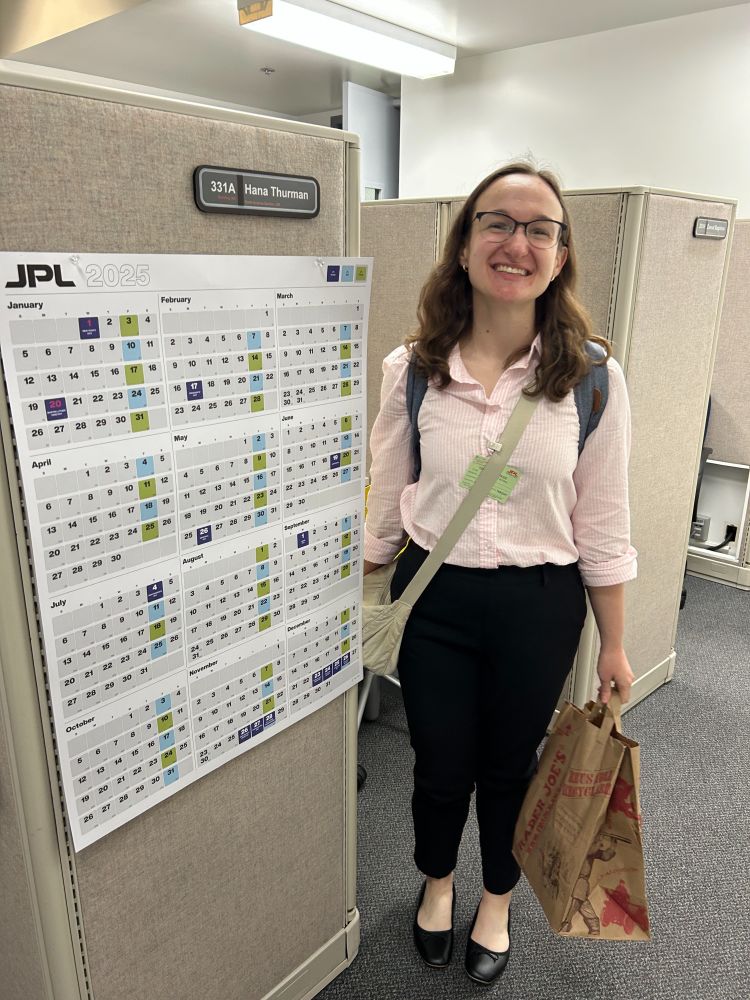
Hana (grad student in my group) will be doing a research internship at JPL this summer. Here she is on her first day on the job. Good luck, Hana!! 🚀🚀🚀
27.05.2025 16:43 — 👍 2 🔁 0 💬 0 📌 0