Shiny for R v1.12 is here with built-in OpenTelemetry support! 🎉
Trace sessions and reactive calculations in production with zero code changes. Just install {otel}/{otelsdk} and set your env vars.
Learn more: shiny.posit.co/blog/posts/s...
#RStats #RShiny #OpenTelemetry
10.12.2025 21:08 — 👍 26 🔁 8 💬 0 📌 1

plumber2 0.1.0
plumber2, a complete rewrite of plumber, has landed on CRAN, providing a modern, future proof solution for creating web servers in R. Read all about the new features here.
I am super hyped to finally share the first release of plumber2 with all of you. This has been the center of my attention for a big part of 2025 and I hope you'll find it a worthy update to the venerable plumber package.
The blog post will tell you more
#rstats
24.09.2025 06:51 — 👍 93 🔁 27 💬 2 📌 1
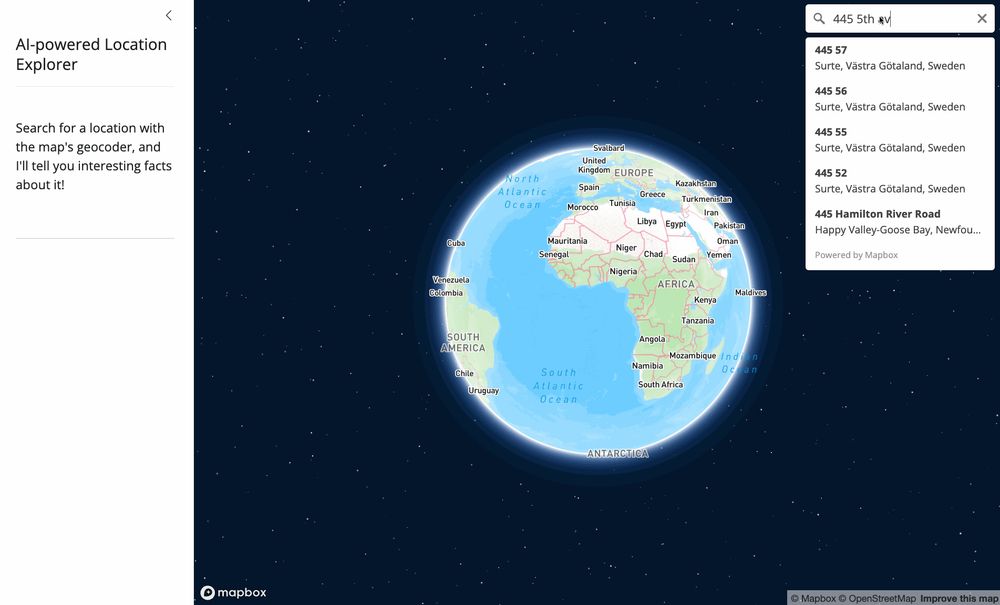
Building an AI-powered location explorer with Shiny and Claude – WALKER DATA
GIS, demographics, and data science consulting
On the blog: building an AI-powered location explorer with Shiny and Claude
Intrigued by apps you’ve seen that bridge GIS and LLMs? You can build them yourselves in #rstats!
Read the post: walker-data.com/posts/ai-loc...
26.07.2025 22:18 — 👍 9 🔁 2 💬 0 📌 0
A white stylized serpent or "S" curve with a circular head and dot for an eye, is centered on a dark blue circle. Behind the circle is a dark blue background with lighter blue vertical lines of varying heights, resembling an audio waveform.
Announcing Orbital for Python! For Scikit-learn users, this tool transforms your ML pipelines into SQL queries, letting predictions run directly in your database without a #Python environment.
Learn more: posit.co/blog/introdu...
14.07.2025 14:11 — 👍 38 🔁 11 💬 0 📌 7

Posit
We’re happy to announce that we’re supporting Typst by funding one of their full-time engineers.
At Posit, we love @typst.app:
⚡ Make PDFs in milliseconds, not minutes
✨ The power of LaTeX with today's technologies
✍️ Modern typography (including emojis!)
🧠 Clear mental model
So I'm thrilled to announce that we're now supporting its development: posit.co/blog/posit-a...
#rstats
03.06.2025 13:47 — 👍 241 🔁 52 💬 5 📌 11
Risky post!
(This is great, fun to read and the frustrated tone throughout really does capture how it feels sometimes to be an experienced programmer trying to argue that "LLMs are actually really useful" in many corners of the internet)
02.06.2025 23:41 — 👍 151 🔁 19 💬 13 📌 3
This feature is currently only available in python but is coming to R soon
25.05.2025 16:45 — 👍 1 🔁 0 💬 0 📌 0
Wow, this talk-to-the-data #RStats dashboard of terminated #NSF grants is really something.
08.05.2025 21:34 — 👍 26 🔁 4 💬 1 📌 0

A fun and cartoonish portrayal of bookmarking a web page
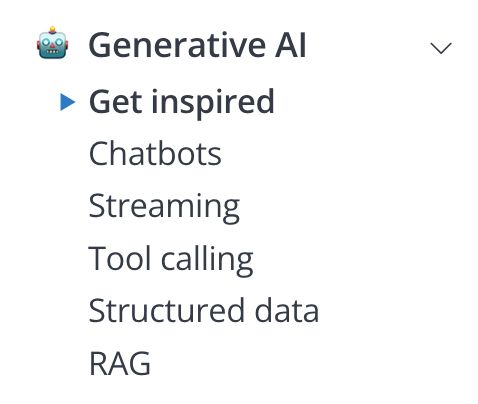
Screenshot of new Generative AI articles within the Shiny documentation
Shiny v1.4 is now on PyPI! 🎉
Highlights include bookmarking and new Generative AI documentation. 🔖🤖
Read here for more. 👀
shiny.posit.co/blog/posts/s...
16.04.2025 16:24 — 👍 3 🔁 3 💬 0 📌 0
Want to work with me on the Shiny team at @posit.co alongside @jcheng5.bsky.social @winstonchang.bsky.social @schloerke.bsky.social @grrrck.xyz?
We're looking for another engineer, apply here posit.co/job-detail/?...
#rstats #rshiny #ShinyConf #python #pydata
10.04.2025 18:57 — 👍 31 🔁 18 💬 0 📌 1
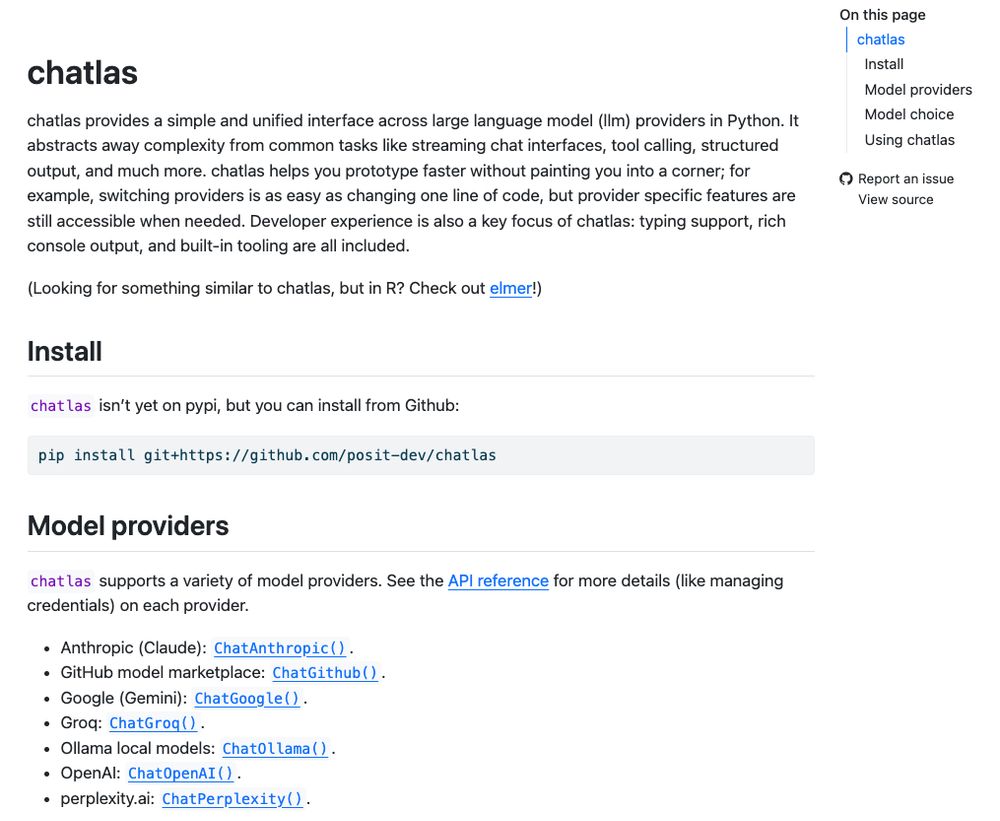
A dark blue hexagon with rounded corners containing a white silhouette of Atlas kneeling and holding two white chat bubbles above him. Below the hexagon is the word "CHATLAS" in white text. The background is a lighter blue with a pattern of white lines and dots resembling a circuit board. The Posit logo is in the corner.
We are thrilled to announce chatlas, a Python package that simplifies working with large language models (LLM) in Python!
Chat, tool call, stream API calls, RAG, and more, with developer details like typing support and rich console output.
Read the post: posit.co/blog/announc...
#Python #AI
24.03.2025 14:01 — 👍 34 🔁 7 💬 0 📌 1

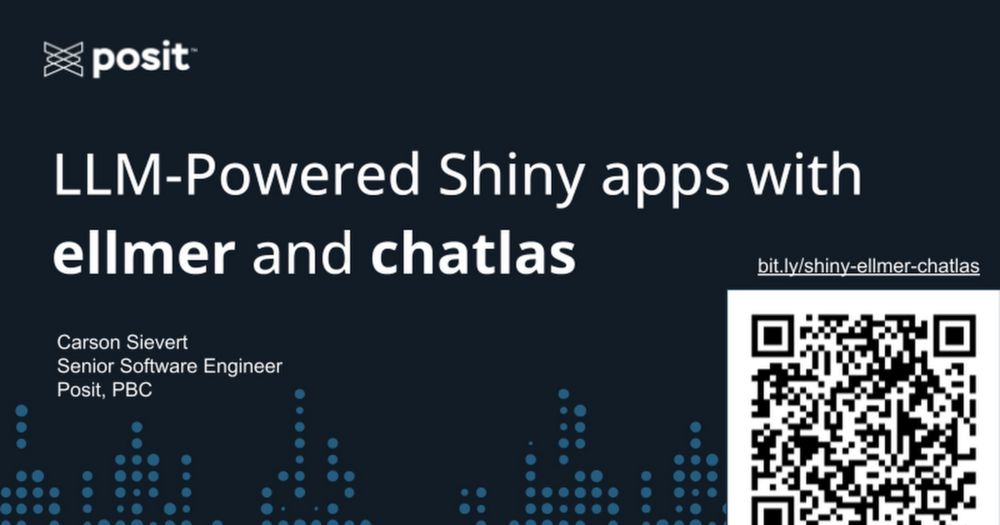
Shiny Conference 2025. Carson Sievert. Building LLM-Powered Shiny apps via ellmer and chatlas.
We're excited for #ShinyConf2025!
Posit's Carson Sievert will talk about "Building LLM-Powered Shiny apps via ellmer and chatlas"
Learn more and see the full agenda at www.shinyconf.com/agenda.
#RShiny #ShinyForPython #rstats
24.03.2025 00:26 — 👍 14 🔁 1 💬 0 📌 1
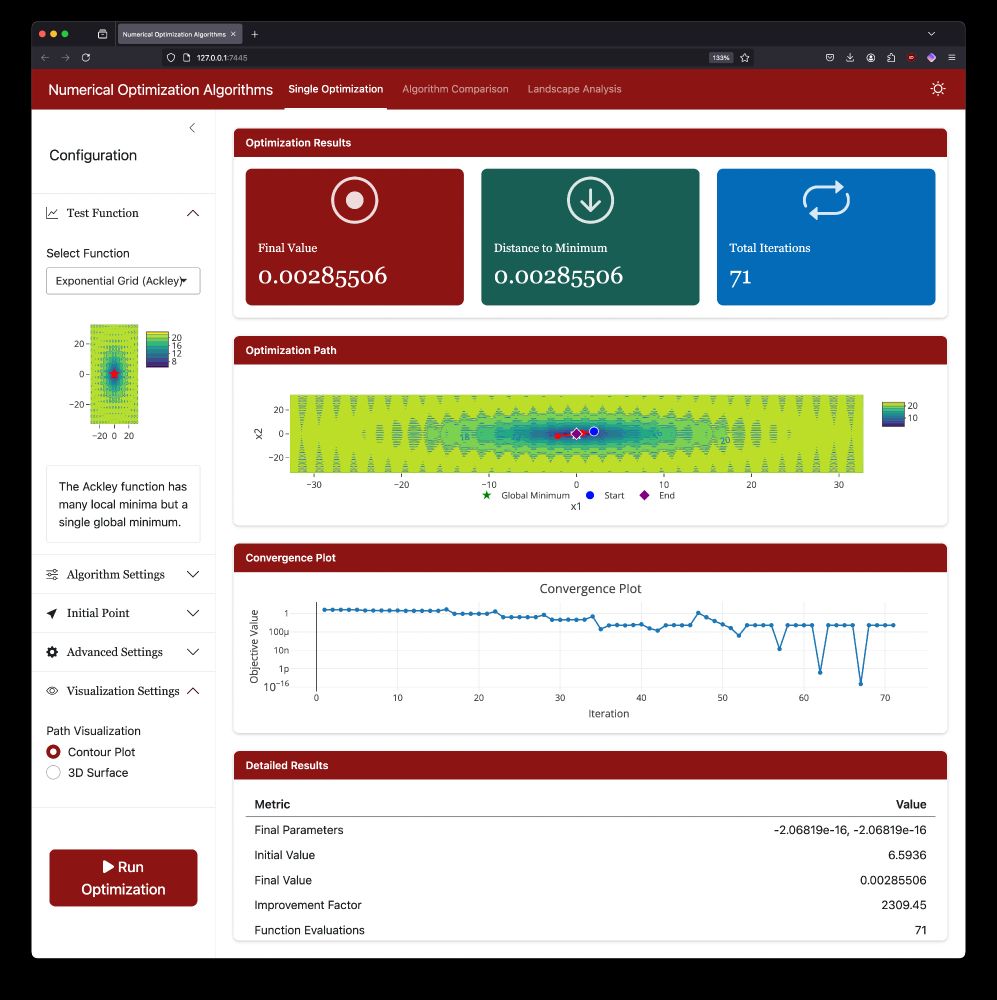
The Single Optimization tab showing results for the Ackley function. The interface displays optimization metrics (final value: 0.00285506, distance to minimum: 0.00285506, total iterations: 71), a contour visualization of the function and the optimization path, a convergence plot showing objective value vs iteration, and detailed results in a table format. The left sidebar contains various configuration options
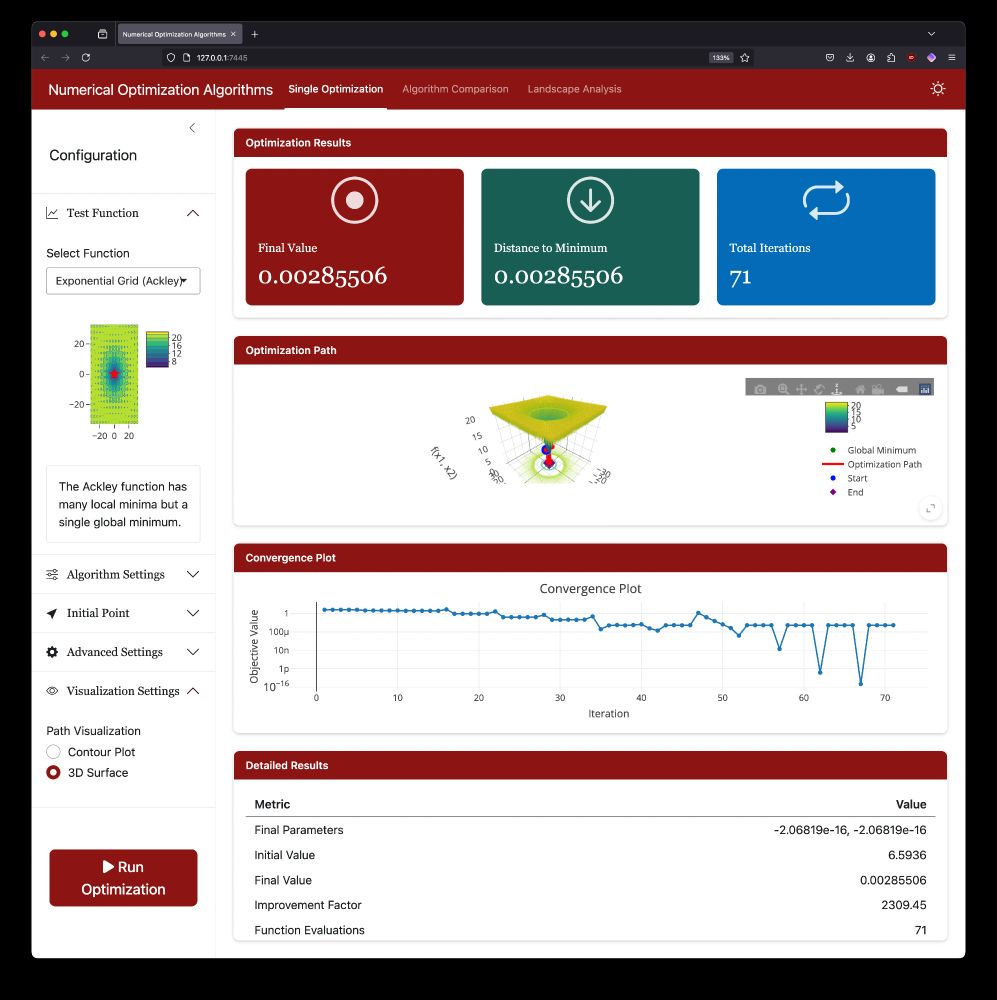
The Single Optimization tab showing results for the Ackley function. The interface displays optimization metrics (final value: 0.00285506, distance to minimum: 0.00285506, total iterations: 71), a 3D visualization of the optimization path, a convergence plot showing objective value vs iteration, and detailed results in a table format. The left sidebar contains various configuration options
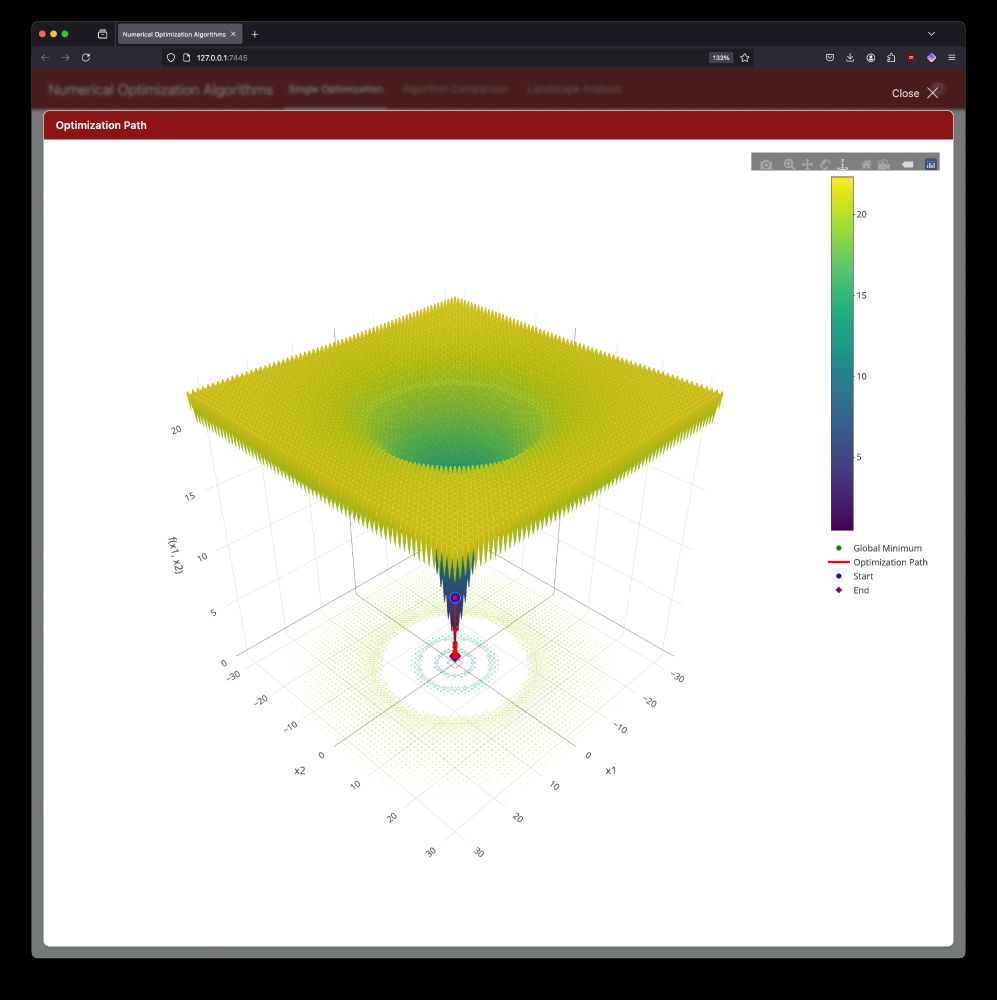
A 3D surface plot showing an optimization path on the Ackley function. The surface is colored in yellow to green, with a clear minimum point at the center. The optimization path is shown in red, moving from the starting point (blue dot) to the end point (purple diamond), converging towards the global minimum.
![The Landscape Analysis tab of the optimization app showing a 3D visualization of the Simple Bowl (Sphere) function. The interface includes settings for test function selection, analysis type, and grid resolution on the left. The main panel displays the bowl-shaped function surface and its mathematical formula f(x) = Σxᵢ² along with properties including domain [-5.12, 5.12], global minimum (0), and minimum location (0, 0).](https://cdn.bsky.app/img/feed_thumbnail/plain/did:plc:fgeozid7uyx2lfz3yo7zvm3b/bafkreift2xwr7557z37twkdpf2zmsmm3vb3acntjo5xcwh66gv5vaam2jq@jpeg)
The Landscape Analysis tab of the optimization app showing a 3D visualization of the Simple Bowl (Sphere) function. The interface includes settings for test function selection, analysis type, and grid resolution on the left. The main panel displays the bowl-shaped function surface and its mathematical formula f(x) = Σxᵢ² along with properties including domain [-5.12, 5.12], global minimum (0), and minimum location (0, 0).
Test BFGS, Nelder-Mead & other numerical optimization algorithms on classic functions like Rosenbrock & Ackley. Compare paths & landscapes in real-time. Built with #rstats #rshiny
🔗 App: shiny.thecoatlessprofessor.com/numerical-op...
💻 Code: github.com/coatless-shi...
05.01.2025 11:35 — 👍 22 🔁 5 💬 1 📌 0
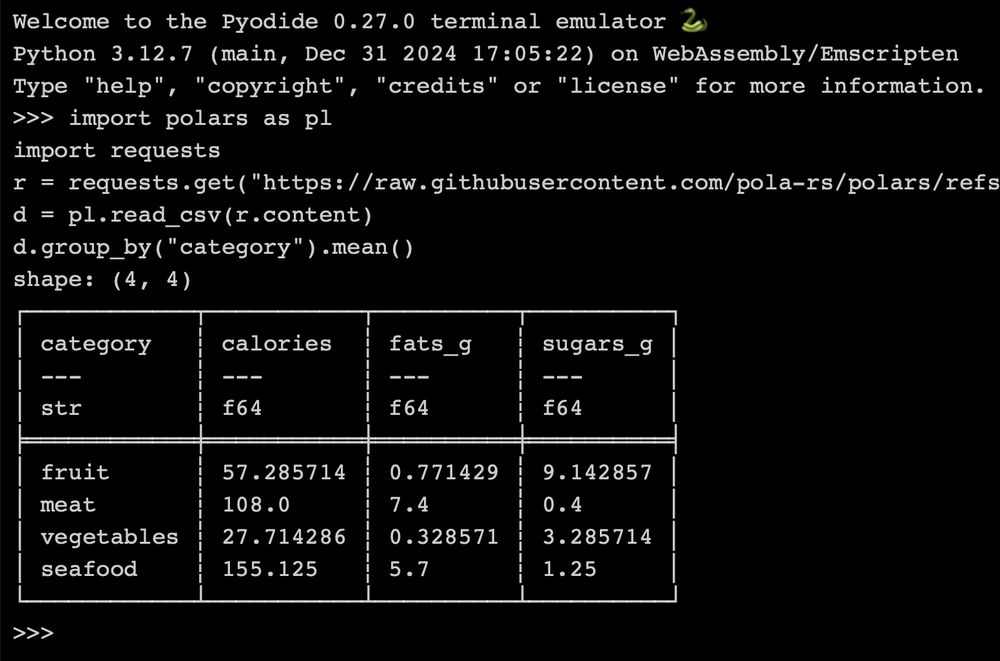
A screenshot of a Pyodide REPL executing Polars code:
import polars as pl
import requests
r = requests.get("https://raw.githubusercontent.com/pola-rs/polars/refs/heads/main/examples/datasets/foods2.csv")
pl.read_csv(r.content).group_by("category").mean()
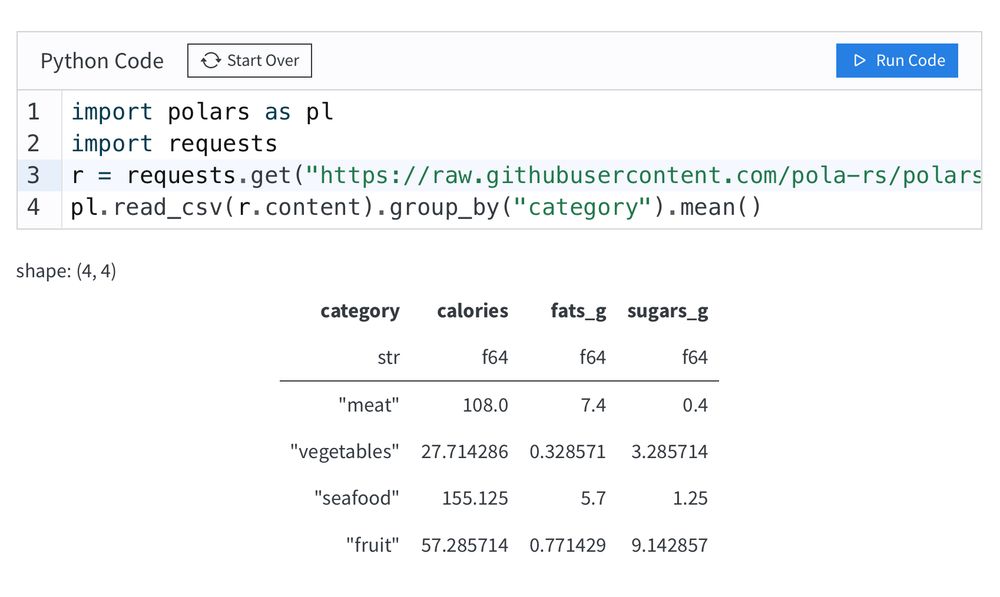
A screenshot of a Quarto Live code cell executing Polars code:
import polars as pl
import requests
r = requests.get("https://raw.githubusercontent.com/pola-rs/polars/refs/heads/main/examples/datasets/foods2.csv")
pl.read_csv(r.content).group_by("category").mean()
![A screenshot of a Shinylive app using Polars code:
from shiny import App, render, ui
import polars as pl
from pathlib import Path
app_ui = ui.page_fluid(
ui.input_select("cyl", "Select Cylinders", choices=["4", "6", "8"]),
ui.output_data_frame("filtered_data")
)
def server(input, output, session):
df = pl.read_csv(Path(__file__).parent / "mtcars.csv")
@output
@render.data_frame
def filtered_data():
return (df
.filter(pl.col("cyl") == int(input.cyl()))
.select(["mpg", "cyl", "hp"]))
app = App(app_ui, server)](https://cdn.bsky.app/img/feed_thumbnail/plain/did:plc:hnkswprmt42fkt2huzbkcpcx/bafkreifcr4vfugeei25pfex52gvvvxnukyy4sms4ytpk6isepn5c3j473i@jpeg)
A screenshot of a Shinylive app using Polars code:
from shiny import App, render, ui
import polars as pl
from pathlib import Path
app_ui = ui.page_fluid(
ui.input_select("cyl", "Select Cylinders", choices=["4", "6", "8"]),
ui.output_data_frame("filtered_data")
)
def server(input, output, session):
df = pl.read_csv(Path(__file__).parent / "mtcars.csv")
@output
@render.data_frame
def filtered_data():
return (df
.filter(pl.col("cyl") == int(input.cyl()))
.select(["mpg", "cyl", "hp"]))
app = App(app_ui, server)
Recently I've been working on getting #polars running in #pyodide. This was a fun one, even requiring patches to LLVM's #wasm writer! Everything has now been upstreamed and earlier this week Pyodide v0.27.0 released, including a Wasm build of Polars usable in Pyodide, Shinylive and Quarto Live 🎉
04.01.2025 11:59 — 👍 49 🔁 9 💬 0 📌 0
Great work by @halleeshearer.bsky.social in her first first-author paper. With 🎀 shiny app 🎀 to explore how FC reliability fares ACROSS DIFFERENT movies versus rest, region-by-region. Thanks @sneuroble.bsky.social @tingsterx.bsky.social @ninetlab.bsky.social for 👍 collab.
doi.org/10.1162/imag...
03.01.2025 17:39 — 👍 38 🔁 18 💬 0 📌 1
I finally tried the {shinychat} #RStats 📦 and it's nice to see LLM streaming responses in an R Shiny app!
By @jcheng5.bsky.social & @cpsievert.bsky.social at @posit.co
github.com/posit-dev/sh...
#RShiny #GenAI 1/2
26.12.2024 22:48 — 👍 2 🔁 2 💬 1 📌 0
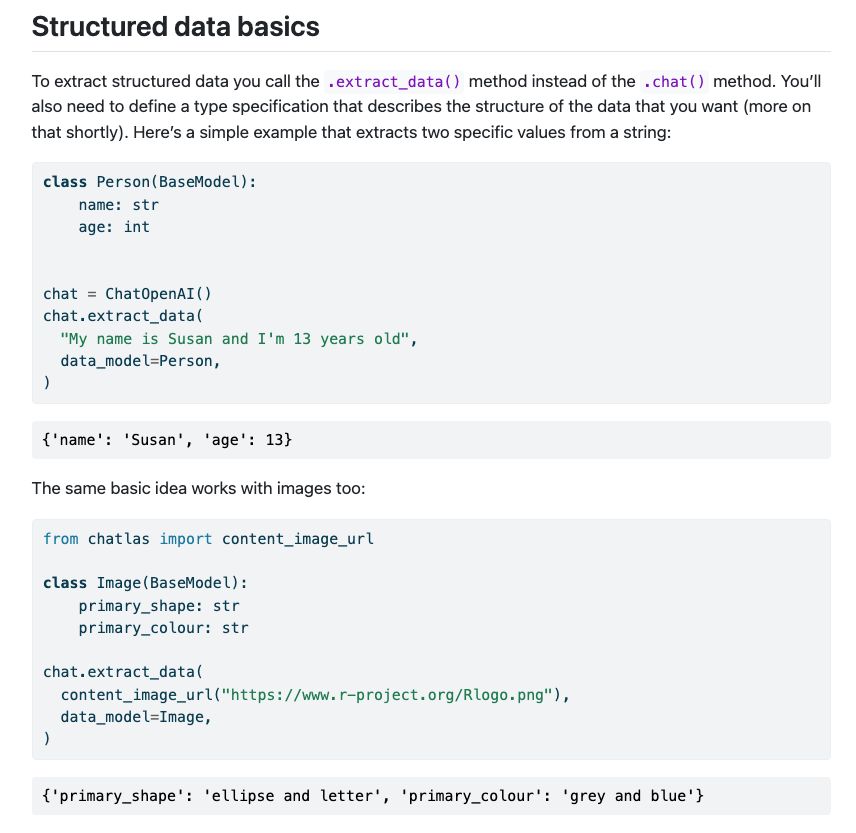
I've been working with a variety of #LLM / #GenAI interfaces in #Python, but I haven't found one that does exactly what I need in a streamlined way.
The new chatlas package from Posit may be just that. It supports multiple providers, structured data outputs, and more!
posit-dev.github.io/...
09.12.2024 23:07 — 👍 12 🔁 3 💬 2 📌 0
Software Engineer, Open Source @posit.co
Independent AI researcher, creator of datasette.io and llm.datasette.io, building open source tools for data journalism, writing about a lot of stuff at https://simonwillison.net/
Technical Directory at QuantStack, Project Jupyter Core Developer & Distinguished Contributor - he / him - https://github.com/jtpio - jtp.io
PhD in economics from LISER, Luxembourg, now looking for research software engineer or data science positions. Mostly here to talk about #rstats
https://github.com/etiennebacher
⚡️ makin' ideas click
👨🍳 staff design engineer @shopify (ex @google, @vercel 🫡)
📚 making ui/ux playbook craftofui.dev
👰♀️ @seaotta.dev
Director of data science, fanboy of #rstats
Make interoperability, not war.
Also at @ataustin@fosstodon.org
Expert in Reproducible Research & Scalable Data Workflows | Founder at tidy-intelligence.com | Co-creator of tidy-finance.org & econdataverse.org | Data Editor at sfs.org | Lecturer at hu-berlin.de
Anaconda Founder&Head of AI; created the PyData movement, PyScript, Bokeh, Datashader; Fellow @ Python Software Foundation; Center for Humane Tech
Game~B; Physics, Cybernetics, Memetics. A student of the human condition.
Memento mori
Husband / Father of two / Founder voidzero.dev / Creator @vuejs.org & @vite.dev
Data Science, Causal Inference, Economics, Statistics and Machine Learning
Two joys in life:
[1] Learning something interesting about the world
[2] Telling people about it
Data Science @OpenAI
Platform DX at Shopify. Created #Preact. Do more with less.
#JavaScript #PreactJS #React #Frontend #DeveloperExperience #OSS #Coffee #Foxes #Drumming #Metalhead
there's always an obstacle
Opinions my own.
https://sarah.dev
Sr Director of Engineering @ Google: Core Web, Android, iOS Infrastructure
Formerly Vue Core •
Frontend Masters teacher •
O'Reilly Author •
https://www.engmanagement.dev/
https://github.com/sdras
Author of Practical R for Mass Communication & Journalism
❤️ #RStats, writing & cities designed for walking/biking
Having fun with #GenAI
(Mostly) retired; former tech journalist
Also #HamRadio #VibrantAging #Running #Photography #Crochet #ASL
DuckDB is an analytical in-process SQL database management system. "DuckDB" and the DuckDB logo are registered trademarks of the DuckDB Foundation.
I like databases and boats. Co-creator of @duckdb.org, Co-Founder and CEO DuckDB Labs.
Chief Scientist @ Distributional.com @dbnlAI.bsky.social #MLSky #StatSky
Founder @ datascientific.com
Founder wimlds.org & co-founder rladies.org
PhD @ UC Berkeley
🏡 🌈 Oakland, California.
Biostatistician. Baritone. He/Him.
Product of more than one country.
May contain nuts.
Professor of Statistics, Monash University, Australia. FAA, FASSA. Interested in #forecasting, #rstats, #statistics. he/him http://robjhyndman.com
Ph.D, stats lover/writer✍🏼, #statistics #scicomm #datascience #statstiktok 👩🏻💻 she/her