July 2025 Poll on Latinos, Trump and the Economy | Equis Research
This memo summarizes key findings from a national poll of 1,614 registered Hispanic voters, conducted with Data for Progress from July 7 to 17, 2025. This poll has a margin of error of ± 2 pp.
New national polling of Latinos out today from the Equis team in partnership w/ @dataforprogress.org : views on Trump’s economic moves, what they most want to see now, & how it shapes their views of the parties — & their vote in 2026.
Memo & toplines here:
www.weareequis.us/research/202...
31.07.2025 17:52 — 👍 10 🔁 4 💬 0 📌 0
Bar chart of polling data from Data For Progress.
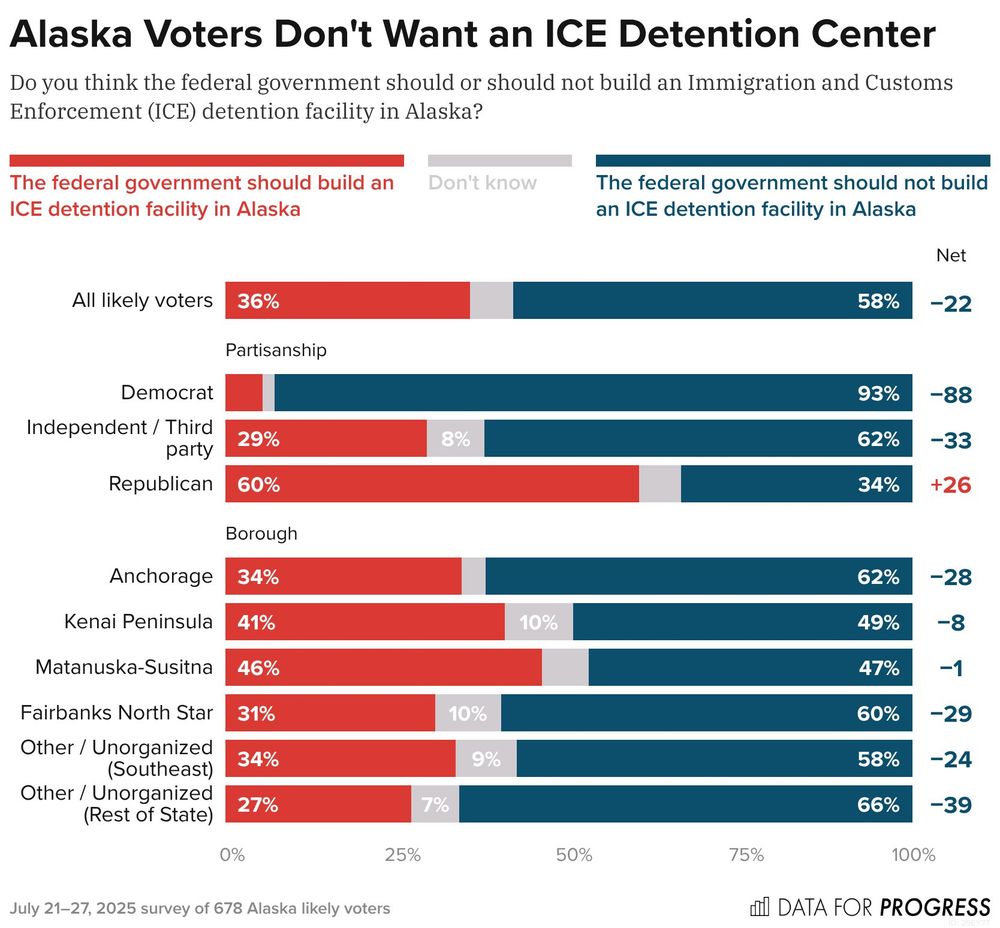
Title: Alaska Voters Don't Want an ICE Detention Center.
Description: Do you think the federal government should or should not build an Immigration and Customs Enforcement (ICE) detention facility in Alaska?
Response Options:
A) The federal government should build an ICE detention facility in Alaska
B) Don't know
C) The federal government should not build an ICE detention facility in Alaska
All likely voters — 36% chose A, 6% chose B, 58% chose C
Democrat — 5% chose A, 2% chose B, 93% chose C
Independent / Third party — 29% chose A, 8% chose B, 62% chose C
Republican — 60% chose A, 6% chose B, 34% chose C
July 21–27, 2025 survey of 678 Alaska likely voters.
Only 36% of Alaska voters think the federal government should build an ICE detention facility in Alaska.
www.dataforprogress.org/blog/2025/7/...
31.07.2025 17:54 — 👍 4 🔁 1 💬 1 📌 0
**Bar chart of polling data from Data For Progress.**
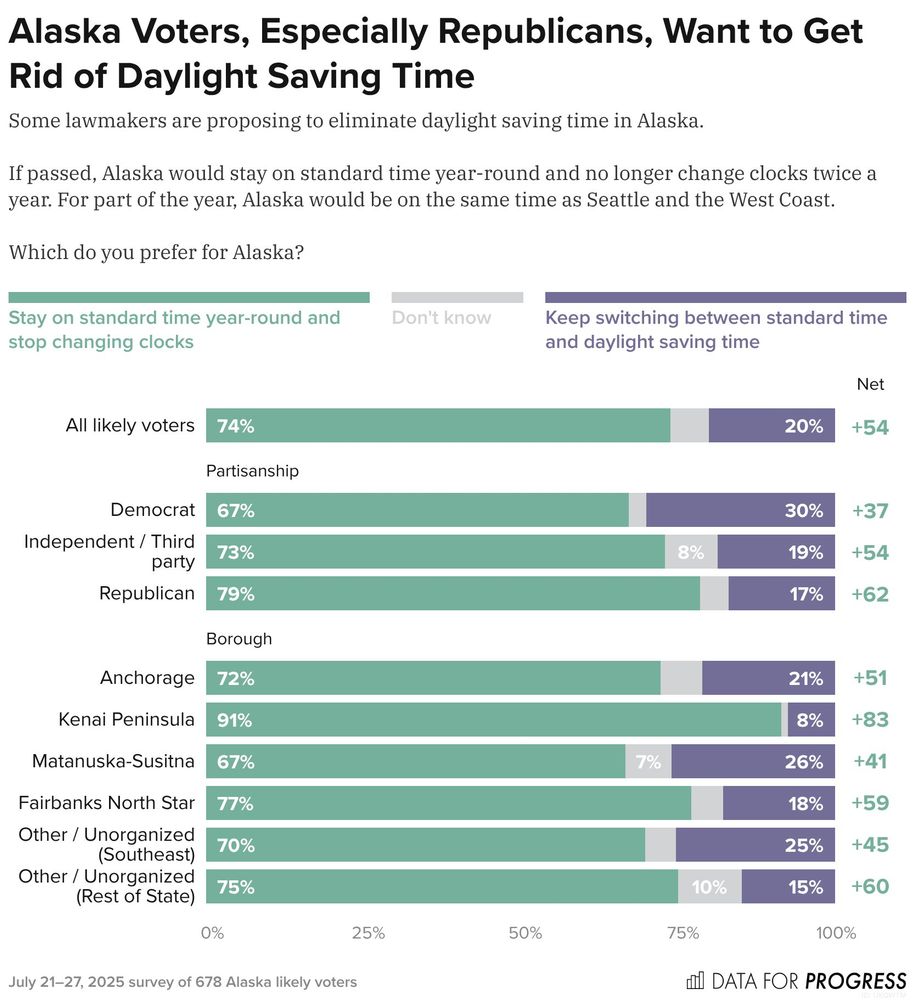
**Title:** Alaska Voters, Especially Republicans, Want to Get Rid of Daylight Saving Time.
**Description:**
The chart shows responses to the question:
*“Do you prefer Alaska to stay on standard time year-round or continue switching between standard and daylight saving time?”*
**Key:**
* a = Stay on standard time year-round
* b = Don’t know
* c = Keep switching between standard and daylight saving time
**Results:**
* All likely voters — a: 74%, b: 6%, c: 20%
* Democrat — a: 67%, b: 3%, c: 30%
* Independent / Third party — a: 73%, b: 8%, c: 19%
* Republican — a: 79%, b: 5%, c: 17%
Survey conducted July 21–27, 2025 among 678 Alaska likely voters.
In May, the Alaska Senate passed a bill to eliminate daylight saving time.
Almost 3 in 4 Alaska voters (74%) prefer to stay on standard time year-round and stop changing clocks.
www.dataforprogress.org/blog/2025/7/...
31.07.2025 17:54 — 👍 7 🔁 2 💬 1 📌 1
Bar chart of polling data from Data For Progress.
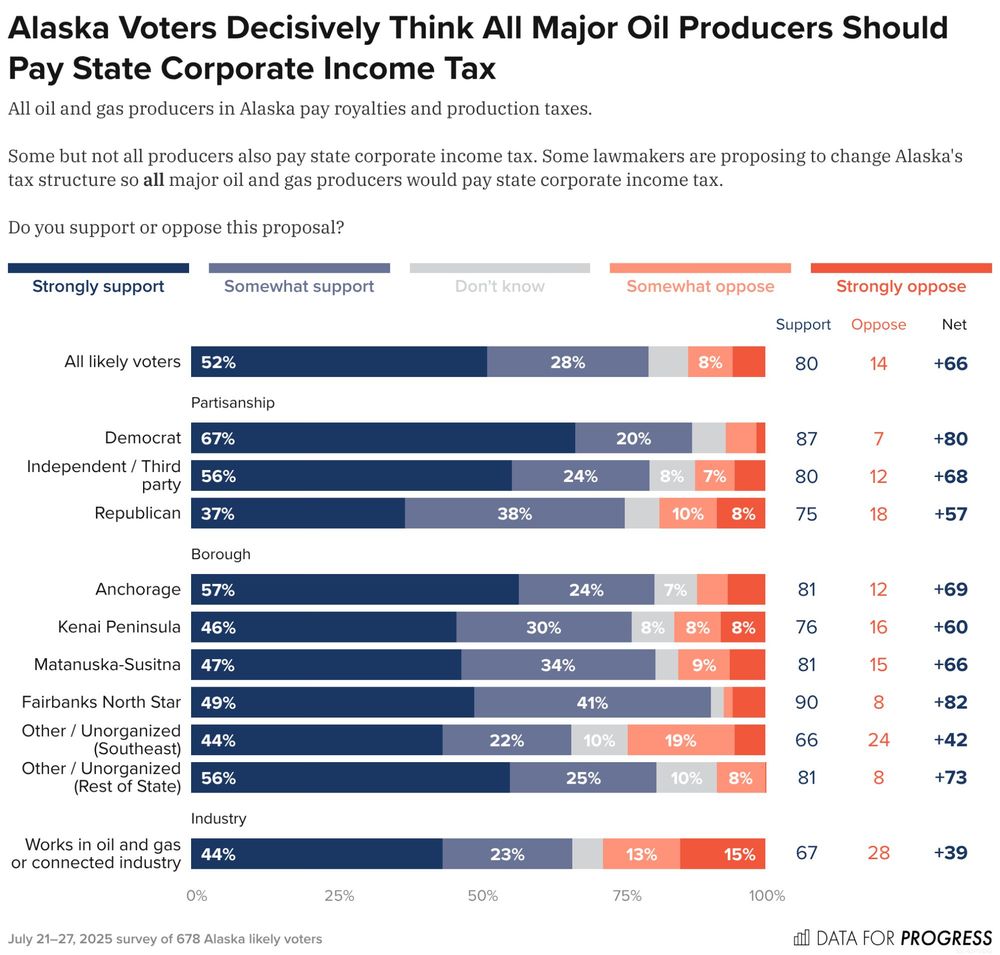
Title: Alaska Voters Decisively Think All Major Oil Producers Should Pay State Corporate Income Tax.
Description: All oil and gas producers in Alaska pay royalties and production taxes. Some but not all producers also pay state corporate income tax. Some lawmakers are proposing to change Alaska's tax structure so all major oil and gas producers would pay state corporate income tax. Do you support or oppose this proposal?
All likely voters — Support: 80%, Oppose: 13%
Democrat — Support: 87%, Oppose: 7%
Independent / Third party — Support: 80%, Oppose: 12%
Republican — Support: 75%, Oppose: 19%
Works in oil and gas or connected industry — Support: 66%, Oppose: 28%
July 21–27, 2025 survey of 678 Alaska likely voters.
Eighty percent of Alaska voters — including 75% of Republicans — support changing the tax structure so all major oil and gas producers would pay state corporate income tax.
www.dataforprogress.org/blog/2025/7/...
31.07.2025 17:54 — 👍 5 🔁 3 💬 1 📌 0
Bar chart of polling data from Data For Progress.
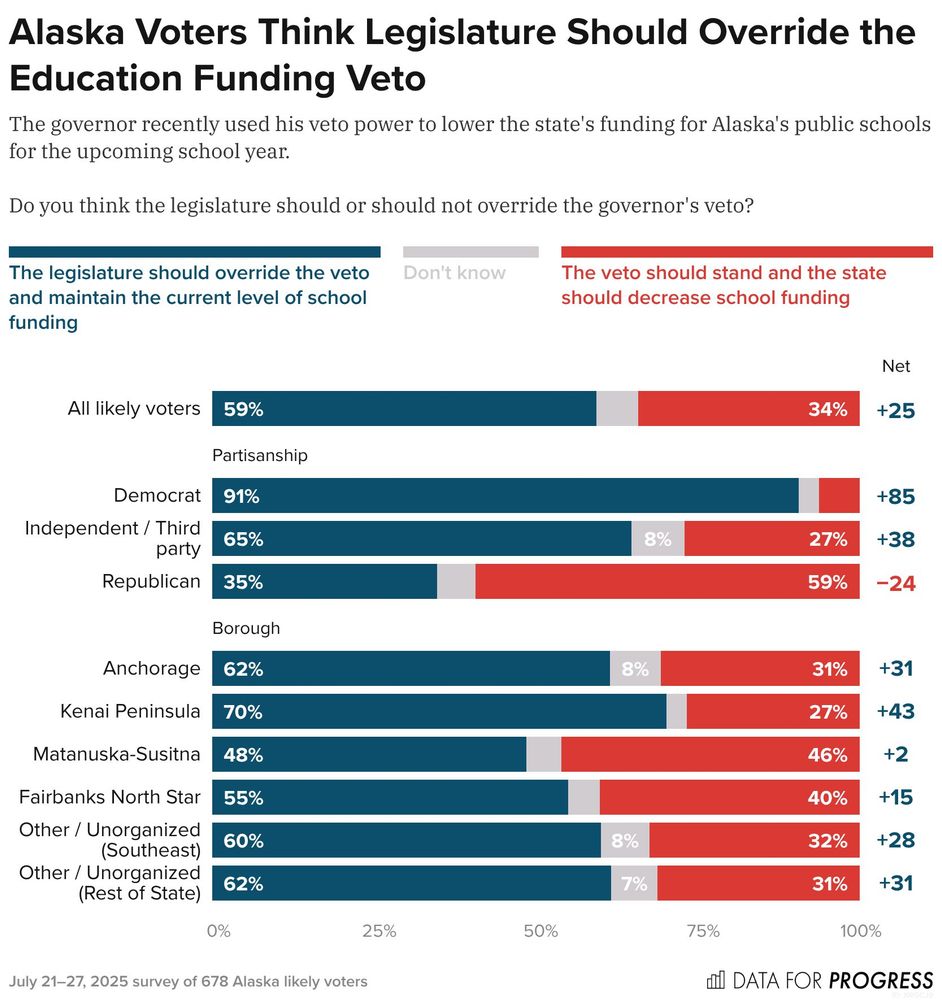
Title: Alaska Voters Think Legislature Should Override the Education Funding Veto.
Description: The governor recently used his veto power to lower the state's funding for Alaska's public schools for the upcoming school year. Do you think the legislature should or should not override the governor's veto?
Response Options:
A) The legislature should override the veto and maintain the current level of school funding
B) Don't know
C) The veto should stand and the state should decrease school funding
All likely voters — 59% chose A, 7% chose B, 34% chose C
Democrat — 91% chose A, 3% chose B, 6% chose C
Independent / Third party — 65% chose A, 8% chose B, 27% chose C
Republican — 35% chose A, 6% chose B, 59% chose C
July 21–27, 2025 survey of 678 Alaska likely voters.
NEW ALASKA POLL:
As the state legislature convenes for a special session this Saturday, a majority of Alaska voters want to override Gov. Dunleavy's veto of education funding.
www.dataforprogress.org/blog/2025/7/...
31.07.2025 17:54 — 👍 20 🔁 9 💬 3 📌 2
Bar chart of polling data from Data For Progress.
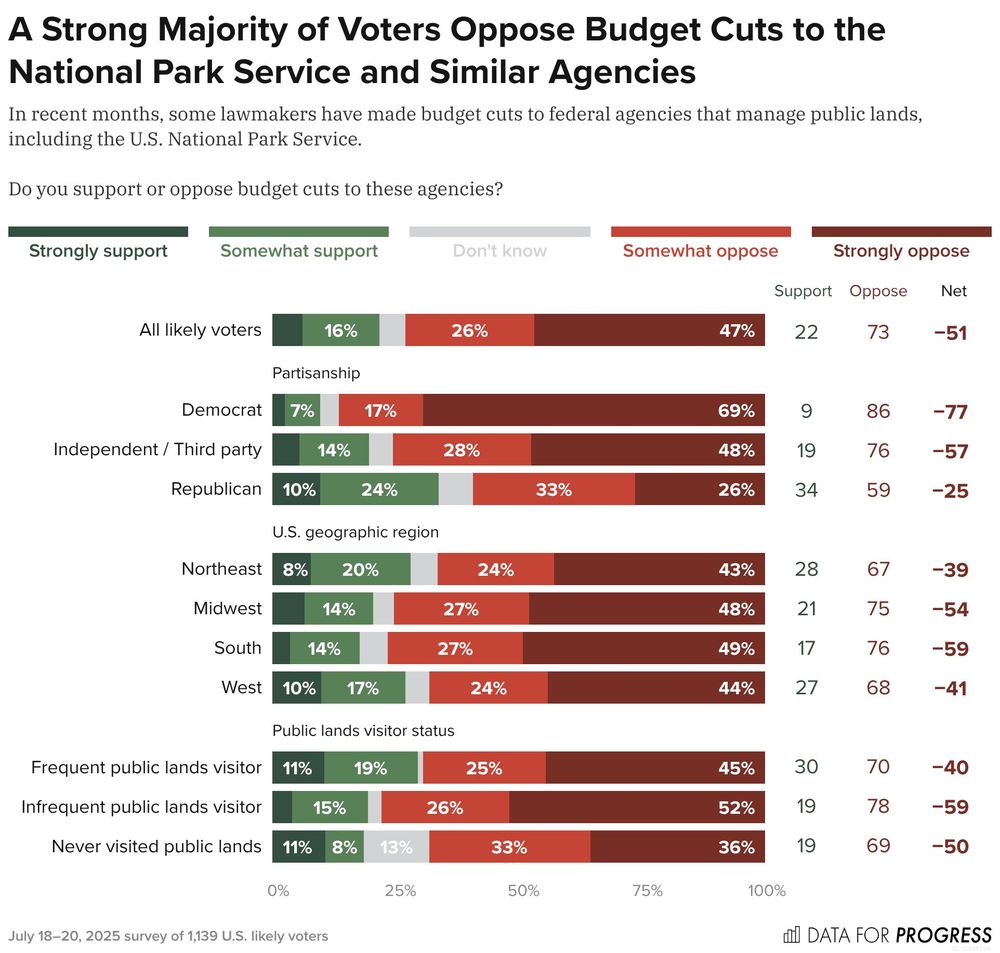
Title: A Strong Majority of Voters Oppose Budget Cuts to the National Park Service and Similar Agencies.
Description: In recent months, some lawmakers have made budget cuts to federal agencies that manage public lands, including the U.S. National Park Service. Do you support or oppose budget cuts to these agencies?
All likely voters — Support: 22%, Oppose: 73%
Democrat — Support: 10%, Oppose: 87%
Independent / Third party — Support: 20%, Oppose: 76%
Republican — Support: 34%, Oppose: 59%
Northeast — Support: 28%, Oppose: 66%
Midwest — Support: 21%, Oppose: 75%
South — Support: 18%, Oppose: 77%
West — Support: 27%, Oppose: 68%
Frequent public lands visitor — Support: 29%, Oppose: 69%
Infrequent public lands visitor — Support: 19%, Oppose: 78%
Never visited public lands — Support: 19%, Oppose: 68%
July 18–20, 2025 survey of 1,139 U.S. likely voters.
Voters are similarly opposed to cutting the budgets of federal agencies, like the National Park Service, that manage public lands.
www.dataforprogress.org/blog/2025/7/...
31.07.2025 14:30 — 👍 17 🔁 3 💬 0 📌 0
Bar chart of polling data from Data For Progress.
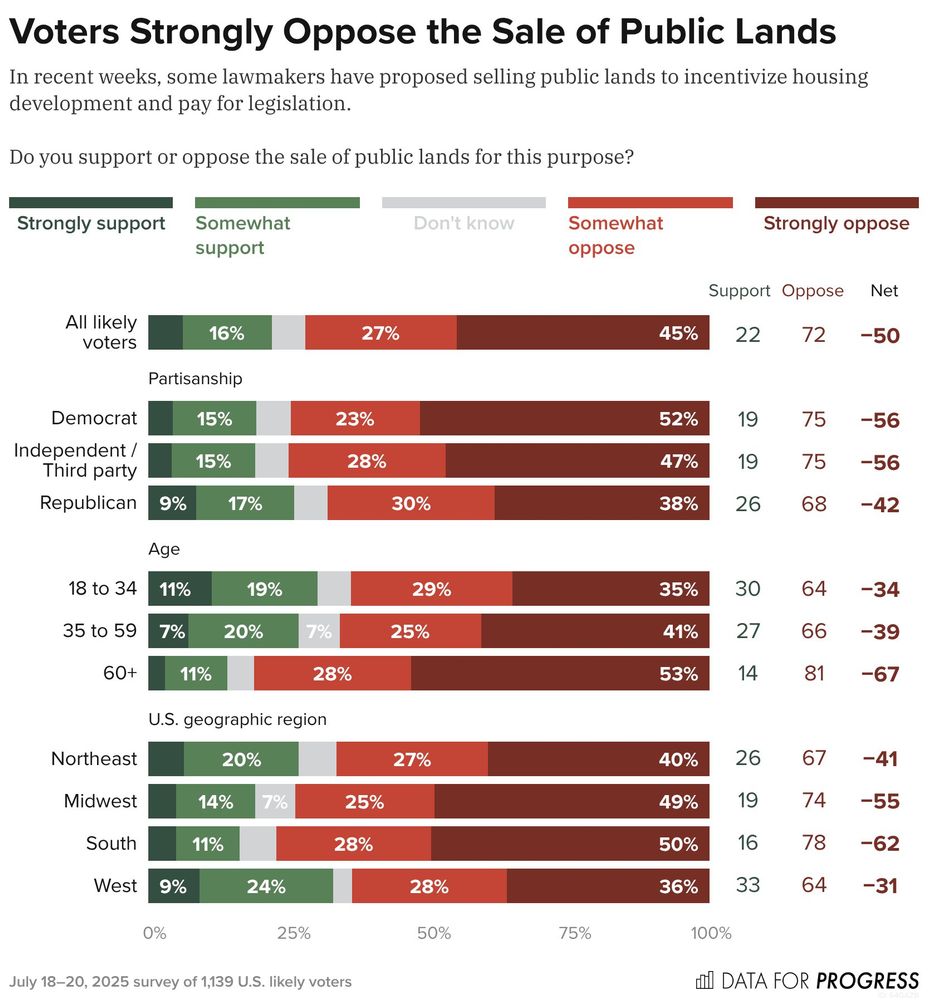
Title: Voters Strongly Oppose the Sale of Public Lands.
Description: In recent weeks, some lawmakers have proposed selling public lands to incentivize housing development and pay for legislation. Do you support or oppose the sale of public lands for this purpose?
All likely voters — Support: 22%, Oppose: 72%
Democrat — Support: 19%, Oppose: 75%
Independent / Third party — Support: 19%, Oppose: 75%
Republican — Support: 26%, Oppose: 68%
18 to 34 — Support: 30%, Oppose: 64%
35 to 59 — Support: 27%, Oppose: 66%
60+ — Support: 14%, Oppose: 81%
Northeast — Support: 27%, Oppose: 66%
Midwest — Support: 19%, Oppose: 74%
South — Support: 16%, Oppose: 77%
West — Support: 33%, Oppose: 64%
July 18–20, 2025 survey of 1,139 U.S. likely voters.
NEW: Voters strongly oppose the sale of public lands, including more than two-thirds of Democrats, Independents, and Republicans.
www.dataforprogress.org/blog/2025/7/...
31.07.2025 14:30 — 👍 26 🔁 7 💬 1 📌 0
Bar chart of polling data from Data For Progress.
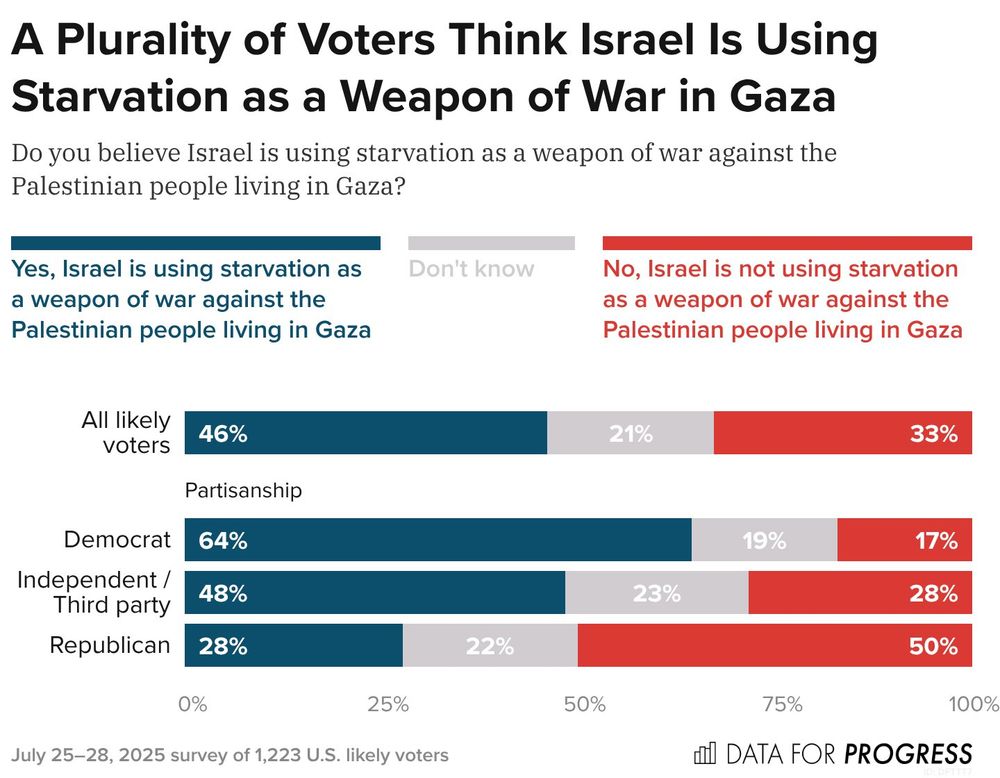
Title: A Plurality of Voters Think Israel Is Using Starvation as a Weapon of War in Gaza.
Description: Do you believe Israel is using starvation as a weapon of war against the Palestinian people living in Gaza?
Response Options:
A) Yes, Israel is using starvation as a weapon of war against the Palestinian people living in Gaza
B) Don't know
C) No, Israel is not using starvation as a weapon of war against the Palestinian people living in Gaza
All likely voters — 46% chose A, 21% chose B, 33% chose C
Democrat — 64% chose A, 19% chose B, 17% chose C
Independent / Third party — 48% chose A, 23% chose B, 28% chose C
Republican — 28% chose A, 22% chose B, 50% chose C
July 25–28, 2025 survey of 1,223 U.S. likely voters.
NEW: A plurality of voters (46%) believe that Israel is using starvation as a weapon of war in Gaza.
Another 33% say Israel is not doing so, and 21% are unsure.
www.dataforprogress.org/datasets/pol...
30.07.2025 19:54 — 👍 14 🔁 6 💬 0 📌 0
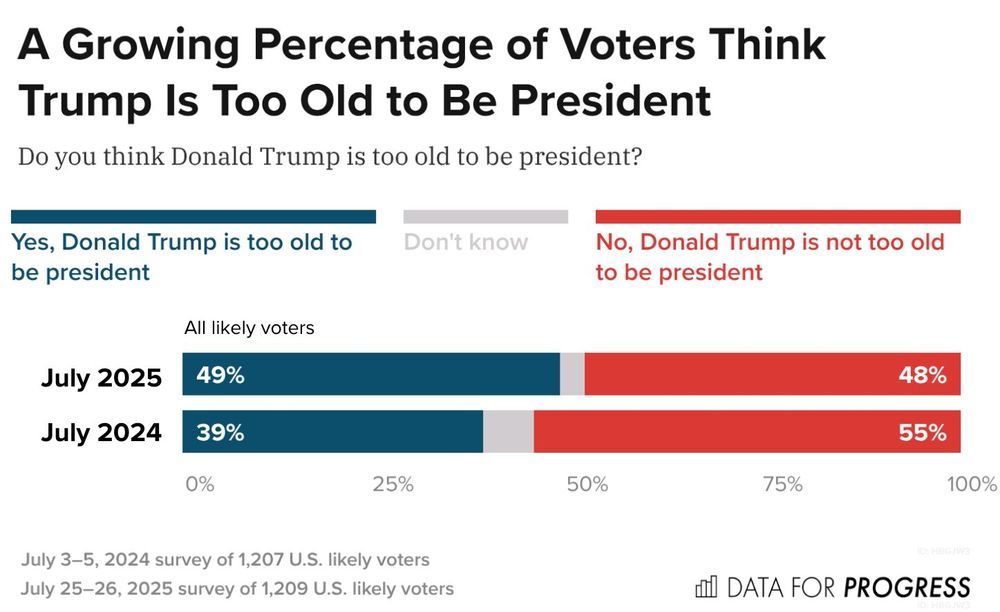
Bar chart titled "A Growing Percentage of Voters Think Trump Is Too Old to Be President." It shows responses to the question: "Do you think Donald Trump is too old to be president?" for all likely voters, comparing July 2024 to July 2025.
July 2025:
49% say Yes, Donald Trump is too old to be president (dark blue)
48% say No, Donald Trump is not too old to be president (red)
Remainder (light gray) are Don't know
July 2024:
39% say Yes
55% say No
Remainder are Don't know
Source: Data for Progress surveys of U.S. likely voters (1,207 in July 2024, 1,209 in July 2025).
NEW POLL: Voters are split, 49% to 48%, over whether Trump is too old to be president.
However, the percentage of voters who believe Trump is too old has jumped 10 points over the last year.
www.dataforprogress.org/blog/2025/7/...
30.07.2025 15:40 — 👍 12 🔁 3 💬 0 📌 1
Bar chart of polling data from Data For Progress.
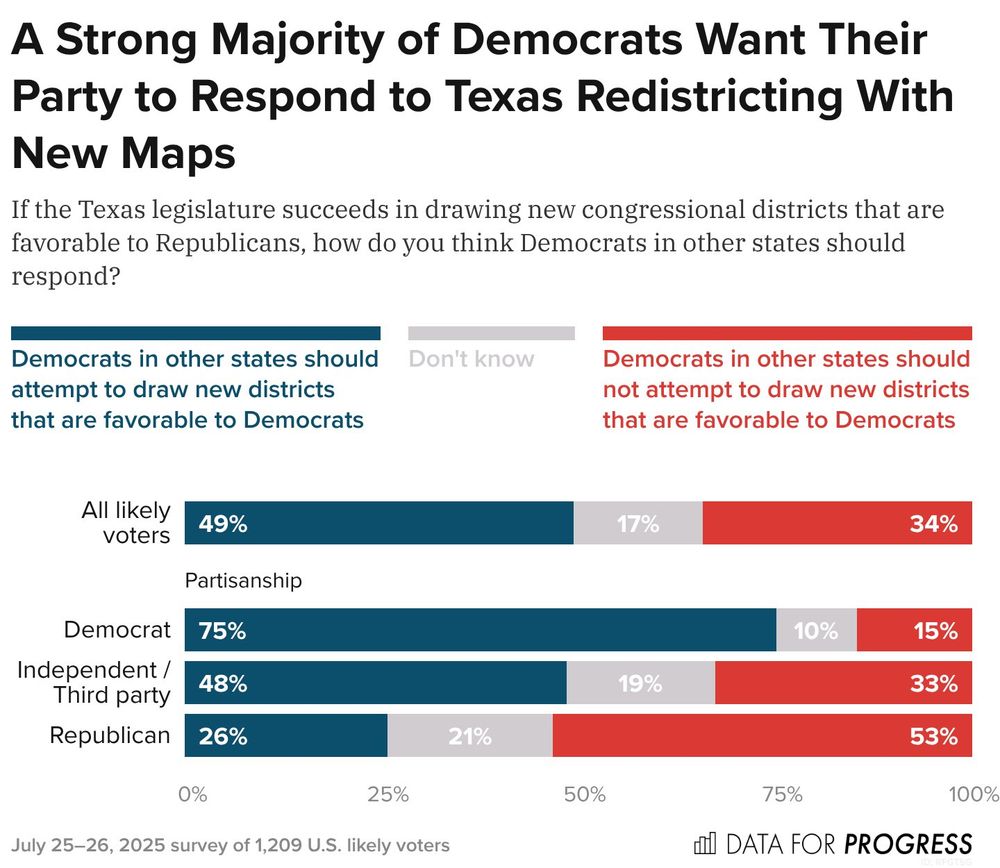
Title: A Strong Majority of Democrats Want Their Party to Respond to Texas Redistricting With New Maps.
Description: If the Texas legislature succeeds in drawing new congressional districts that are favorable to Republicans, how do you think Democrats in other states should respond?
Response Options:
A) Democrats in other states should attempt to draw new districts that are favorable to Democrats
B) Don't know
C) Democrats in other states should not attempt to draw new districts that are favorable to Democrats
All likely voters — 49% chose A, 17% chose B, 34% chose C
Democrat — 75% chose A, 10% chose B, 15% chose C
Independent / Third party — 48% chose A, 19% chose B, 33% chose C
Republican — 26% chose A, 21% chose B, 53% chose C
July 25–26, 2025 survey of 1,209 U.S. likely voters.
If the Texas legislature redraws its districts, 75% of Democrats want their leaders in other states to draw new districts favorable to Democrats.
www.dataforprogress.org/datasets/pol...
29.07.2025 19:21 — 👍 25 🔁 9 💬 2 📌 0
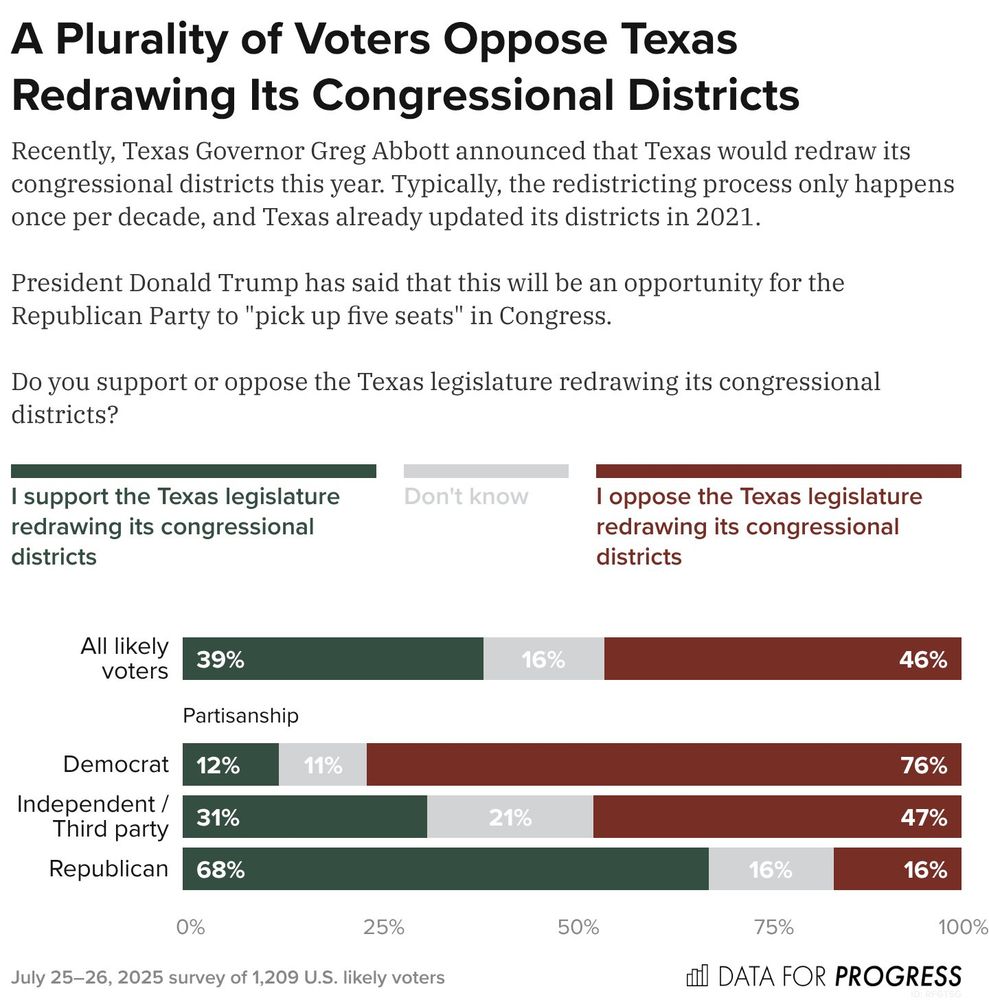
Title: A Plurality of Voters Oppose Texas Redrawing Its Congressional Districts.
Description: Recently, Texas Governor Greg Abbott announced that Texas would redraw its congressional districts this year. Typically, the redistricting process only happens once per decade, and Texas already updated its districts in 2021. President Donald Trump has said that this will be an opportunity for the Republican Party to "pick up five seats" in Congress. Do you support or oppose the Texas legislature redrawing its congressional districts?
Response Options:
A) I support the Texas legislature redrawing its congressional districts
B) Don't know
C) I oppose the Texas legislature redrawing its congressional districts
All likely voters — 39% chose A, 16% chose B, 46% chose C
Democrat — 12% chose A, 11% chose B, 76% chose C
Independent / Third party — 31% chose A, 21% chose B, 47% chose C
Republican — 68% chose A, 16% chose B, 16% chose C
July 25–26, 2025 survey of 1,209 U.S. likely voters.
NEW POLL: A plurality of voters nationwide oppose Texas redrawing its congressional districts to give Republicans five seats in Congress.
www.dataforprogress.org/datasets/pol...
29.07.2025 19:21 — 👍 14 🔁 3 💬 1 📌 0
Bar chart of polling data from Data For Progress.
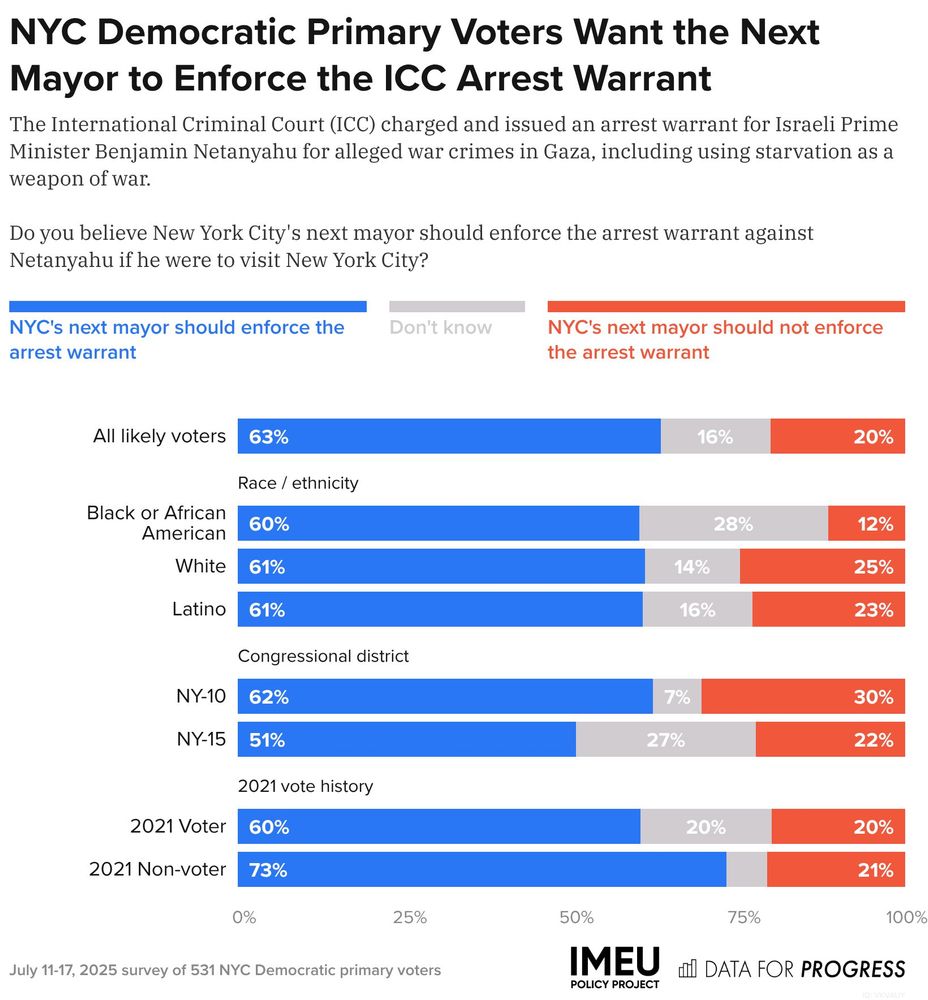
Title: NYC Democratic Primary Voters Want the Next Mayor to Enforce the ICC Arrest Warrant.
Description: The International Criminal Court (ICC) charged and issued an arrest warrant for Israeli Prime Minister Benjamin Netanyahu for alleged war crimes in Gaza, including using starvation as a weapon of war. Do you believe New York City's next mayor should enforce the arrest warrant against Netanyahu if he were to visit New York City?
All likely voters — NYC's next mayor should enforce the arrest warrant: 63%, Don't know: 16%, NYC's next mayor should not enforce the arrest warrant: 20%
Black or African American — NYC's next mayor should enforce the arrest warrant: 60%, Don't know: 28%, NYC's next mayor should not enforce the arrest warrant: 12%
White — NYC's next mayor should enforce the arrest warrant: 61%, Don't know: 14%, NYC's next mayor should not enforce the arrest warrant: 25%
Latino — NYC's next mayor should enforce the arrest warrant: 61%, Don't know: 16%, NYC's next mayor should not enforce the arrest warrant: 23%
NY-10 — NYC's next mayor should enforce the arrest warrant: 62%, Don't know: 7%, NYC's next mayor should not enforce the arrest warrant: 30%
NY-15 — NYC's next mayor should enforce the arrest warrant: 51%, Don't know: 27%, NYC's next mayor should not enforce the arrest warrant: 22%
2021 Voter — NYC's next mayor should enforce the arrest warrant: 60%, Don't know: 20%, NYC's next mayor should not enforce the arrest warrant: 20%
2021 Non-voter — NYC's next mayor should enforce the arrest warrant: 73%, Don't know: 6%, NYC's next mayor should not enforce the arrest warrant: 21%
July 11-17, 2025 survey of 531 NYC Democratic primary voters.
Roughly 2-in-3 NYC Democratic primary voters want the next mayor to enforce the ICC arrest warrant against Benjamin Netanyahu.
www.dataforprogress.org/blog/2025/7/...
29.07.2025 13:43 — 👍 56 🔁 9 💬 3 📌 1
Bar chart of polling data from Data For Progress.
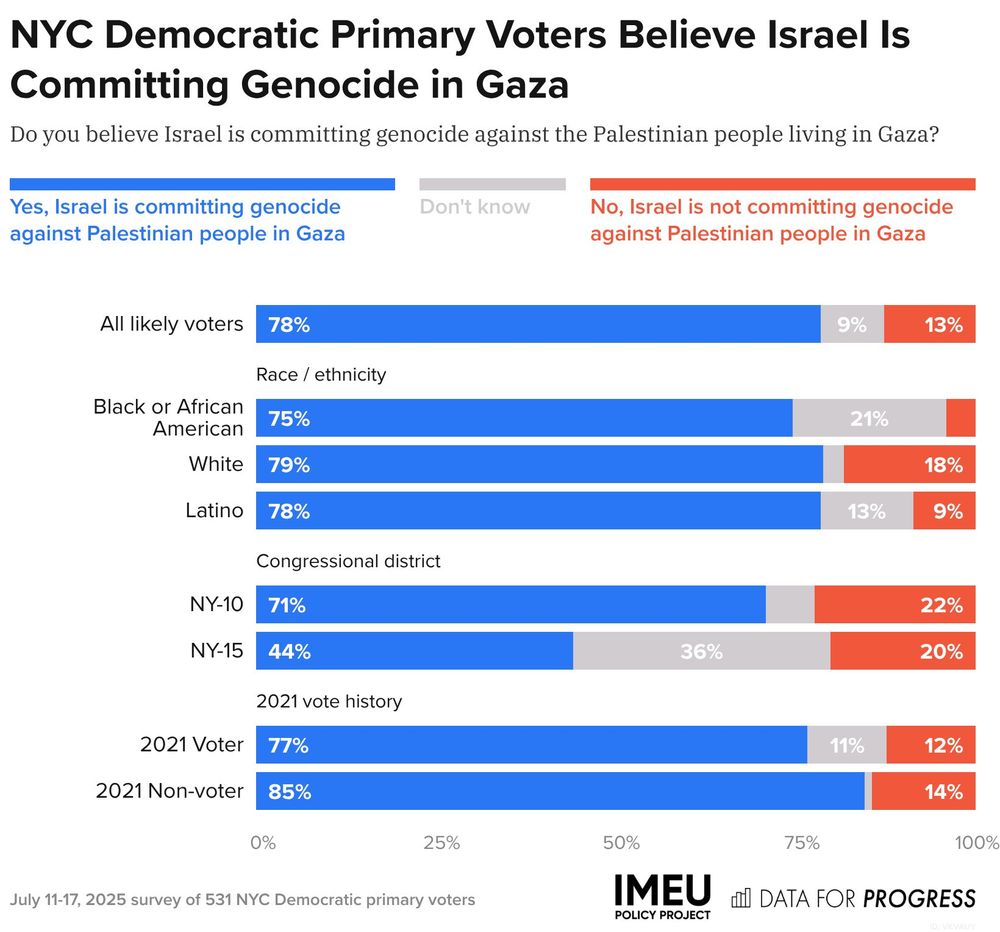
Title: NYC Democratic Primary Voters Believe Israel Is Committing Genocide in Gaza.
Description: Do you believe Israel is committing genocide against the Palestinian people living in Gaza?
Response Options:
A) Yes, Israel is committing genocide against Palestinian people in Gaza
B) Don't know
C) No, Israel is not committing genocide against Palestinian people in Gaza
All likely voters — 78% chose A, 9% chose B, 13% chose C
Black or African American — 75% chose A, 21% chose B, 4% chose C
White — 79% chose A, 3% chose B, 18% chose C
Latino — 78% chose A, 13% chose B, 9% chose C
NY-10 — 71% chose A, 7% chose B, 22% chose C
NY-15 — 44% chose A, 36% chose B, 20% chose C
2021 Voter — 77% chose A, 11% chose B, 12% chose C
2021 Non-voter — 85% chose A, 1% chose B, 14% chose C
July 11-17, 2025 survey of 531 NYC Democratic primary voters.
Seventy-eight percent of NYC Democratic primary voters believe Israel is committing genocide in Gaza.
www.dataforprogress.org/blog/2025/7/...
29.07.2025 13:43 — 👍 64 🔁 16 💬 1 📌 3
Bar chart of polling data from Data For Progress.
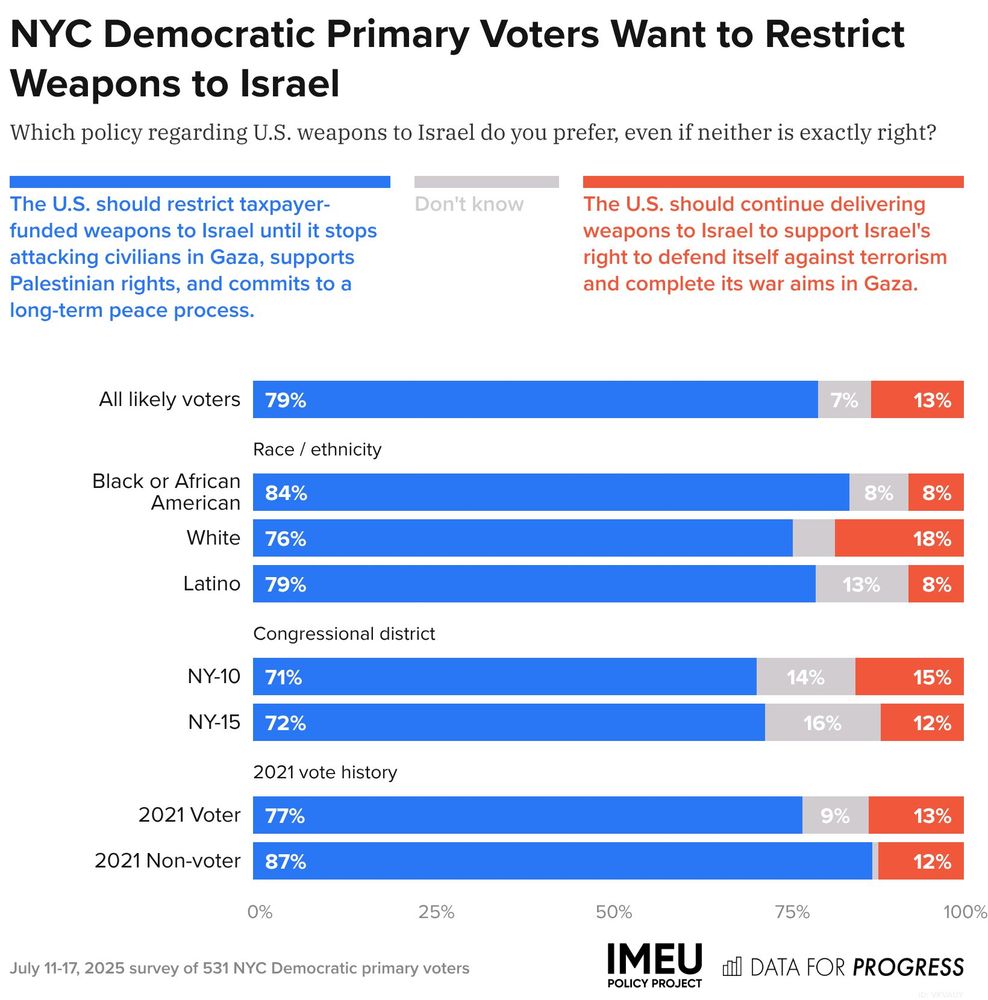
Title: NYC Democratic Primary Voters Want to Restrict Weapons to Israel.
Description: Which policy regarding U.S. weapons to Israel do you prefer, even if neither is exactly right?
Response Options:
A) The U.S. should restrict taxpayer-funded weapons to Israel until it stops attacking civilians in Gaza, supports Palestinian rights, and commits to a long-term peace process.
B) Don't know
C) The U.S. should continue delivering weapons to Israel to support Israel's right to defend itself against terrorism and complete its war aims in Gaza.
All likely voters — 79% chose A, 7% chose B, 13% chose C
Black or African American — 84% chose A, 8% chose B, 8% chose C
White — 76% chose A, 6% chose B, 18% chose C
Latino — 79% chose A, 13% chose B, 8% chose C
NY-10 — 71% chose A, 14% chose B, 15% chose C
NY-15 — 72% chose A, 16% chose B, 12% chose C
2021 Voter — 77% chose A, 9% chose B, 13% chose C
2021 Non-voter — 87% chose A, 1% chose B, 12% chose C
July 11-17, 2025 survey of 531 NYC Democratic primary voters.
A majority of NYC Democratic primary voters believe the U.S. should restrict weapons to Israel.
www.dataforprogress.org/blog/2025/7/...
29.07.2025 13:43 — 👍 44 🔁 6 💬 1 📌 1
Bar chart of polling data from Data For Progress.
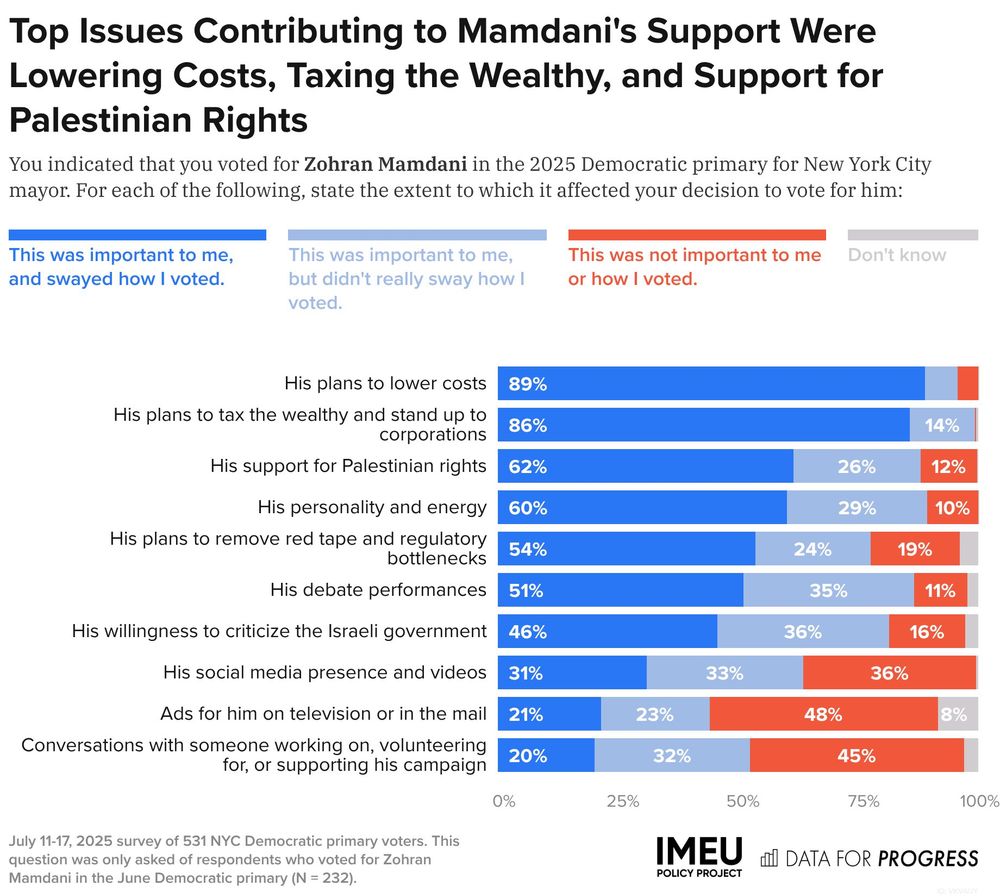
Title: Top Issues Contributing to Mamdani's Support Were Lowering Costs, Taxing the Wealthy, and Support for Palestinian Rights.
Description:
The chart shows how various factors influenced respondents who voted for Zohran Mamdani in the 2025 NYC Democratic mayoral primary.
Key:
a = This was important to me, and swayed how I voted
b = This was important to me, but didn’t really sway how I voted
c = This was not important to me or how I voted
d = Don’t know
Results:
Lowering costs — a: 89%, b: 7%, c: 4%, d: 0%
Taxing the wealthy / standing up to corporations — a: 86%, b: 14%, c: 0%, d: 0%
Support for Palestinian rights — a: 62%, b: 26%, c: 12%, d: 0%
Personality and energy — a: 60%, b: 29%, c: 10%, d: 0%
Removing red tape / regulatory bottlenecks — a: 54%, b: 24%, c: 19%, d: 4%
Debate performances — a: 51%, b: 35%, c: 11%, d: 2%
Willingness to criticize Israeli government — a: 46%, b: 36%, c: 16%, d: 3%
Social media presence / videos — a: 31%, b: 33%, c: 36%, d: 0%
TV / mail ads — a: 21%, b: 23%, c: 48%, d: 8%
Conversations with campaign staff/supporters — a: 20%, b: 32%, c: 45%, d: 3%
Survey conducted July 11–17, 2025 among 531 NYC Democratic primary voters. This question was asked only of the 232 respondents who voted for Mamdani.
NEW POLL with @imeupolicy.bsky.social:
Among NYC voters for Mamdani in the mayoral primary, the top-cited reasons for voting for him are:
- His plans to lower costs
- His plans to tax the wealthy
- His support for Palestinian rights
www.dataforprogress.org/blog/2025/7/...
29.07.2025 13:43 — 👍 135 🔁 43 💬 1 📌 7
Bar chart of polling data from Data For Progress.
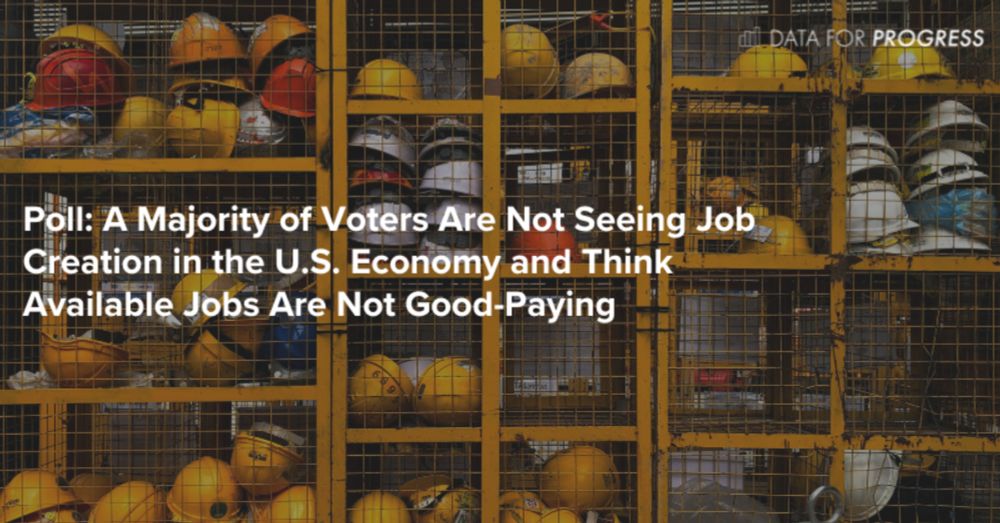
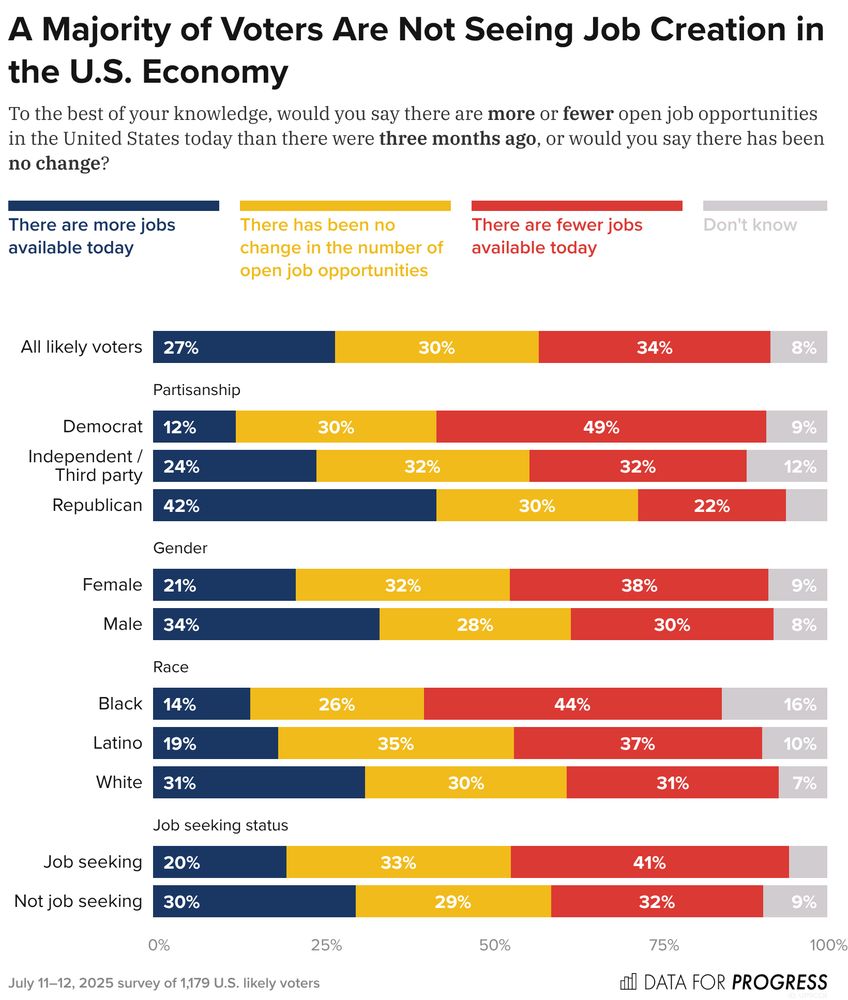
Title: A Majority of Voters Are Not Seeing Job Creation in the U.S. Economy.
Description: To the best of your knowledge, would you say there are more or fewer open job opportunities in the United States today than there were three months ago, or would you say there has been no change?
All likely voters — There are more jobs available today: 27%, There has been no change in the number of open job opportunities: 30%, There are fewer jobs available today: 34%, Don't know: 8%
July 11–12, 2025 survey of 1,179 U.S. likely voters.
Less than a third of voters (27%) say there are more jobs available today than there were three months ago, and a majority (54%) say that available jobs today are not “good-paying.”
25.07.2025 17:45 — 👍 9 🔁 1 💬 1 📌 0
Bar chart of polling data from Data For Progress.
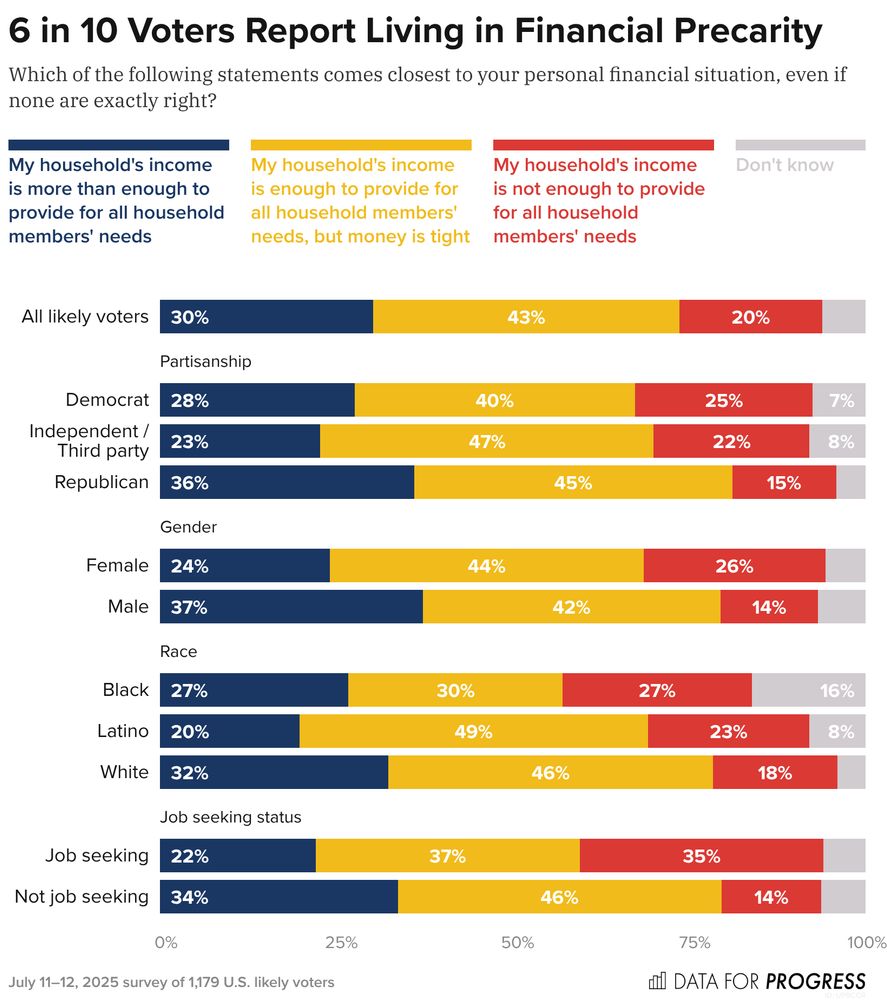
Title: 6 in 10 Voters Report Living in Financial Precarity.
Description: Which of the following statements comes closest to your personal financial situation, even if none are exactly right?
Response Options:
A) My household's income is more than enough to provide for all household members' needs
B) My household's income is enough to provide for all household members' needs, but money is tight
C) My household's income is not enough to provide for all household members' needs
D) Don't know
All likely voters — 30% chose A, 43% chose B, 20% chose C, 6% chose D
Democrat — 28% chose A, 40% chose B, 25% chose C, 7% chose D
Independent / Third party — 23% chose A, 47% chose B, 22% chose C, 8% chose D
Republican — 36% chose A, 45% chose B, 15% chose C, 4% chose D
July 11–12, 2025 survey of 1,179 U.S. likely voters.
NEW: While the White House claims the U.S. is in an “economic boom,” only 30% of voters report having more than enough income to provide for their household’s needs.
25.07.2025 17:45 — 👍 18 🔁 8 💬 1 📌 0
Bar chart of polling data from Data For Progress.
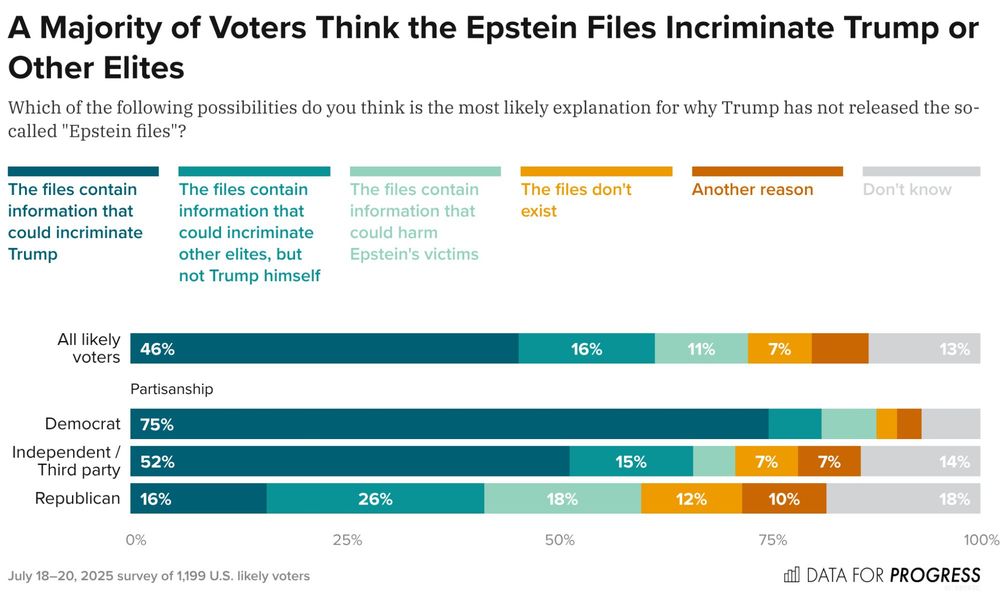
Title: A Majority of Voters Think the Epstein Files Incriminate Trump or Other Elites.
Description: Which of the following possibilities do you think is the most likely explanation for why Trump has not released the so-called "Epstein files"?
Response Options:
A) The files contain information that could incriminate Trump
B) The files contain information that could incriminate other elites, but not Trump himself
C) The files contain information that could harm Epstein's victims
D) The files don't exist
E) Another reason
F) Don't know
All likely voters — 46% chose A, 16% chose B, 11% chose C, 7% chose D, 7% chose E, 13% chose F
Democrat — 75% chose A, 6% chose B, 6% chose C, 2% chose D, 3% chose E, 7% chose F
Independent / Third party — 52% chose A, 15% chose B, 5% chose C, 7% chose D, 7% chose E, 14% chose F
Republican — 16% chose A, 26% chose B, 18% chose C, 12% chose D, 10% chose E, 18% chose F
July 18–20, 2025 survey of 1,199 voters
A majority of voters think that the Epstein files incriminate Trump or other elites.
www.dataforprogress.org/blog/2025/7/...
22.07.2025 18:31 — 👍 13 🔁 4 💬 1 📌 1
![Bar chart titled “The Most Heard News Story From July 18–20 Was the Epstein Files,” based on 1,199 U.S. voter responses. Top answers:
Epstein (237)
Texas floods / Extreme weather (172)
Nothing / None (130)
[All other items] (95)
Immigration / Deportations (76)
One Big Beautiful Bill (74)
Tariffs (61)
Trump admin comments (46)
Coldplay concert CEO (44)
Blank / Unintelligible (42)
Trump’s health (37)
Crime (29)
Don’t know (27)
Israel-Gaza (21)
Russia-Ukraine (21)
War with Iran (17)
Economy (9)
Obama / Russiagate (9)
Sports (9)
Cryptocurrency / GENIUS Act (8)
Foreign policy (8)
Plane crashes (8)
Colbert Show cancellation (7)
Car strikes crowd in LA (6)
Zohran Mamdani (6)](https://cdn.bsky.app/img/feed_thumbnail/plain/did:plc:ltzetlayeqsp4qu7pb4irz24/bafkreibr4vcc3ttthvcl3rsjpc5zddzlp3rnidct7j2he2mrl2u2dax52u@jpeg)
Bar chart titled “The Most Heard News Story From July 18–20 Was the Epstein Files,” based on 1,199 U.S. voter responses. Top answers:
Epstein (237)
Texas floods / Extreme weather (172)
Nothing / None (130)
[All other items] (95)
Immigration / Deportations (76)
One Big Beautiful Bill (74)
Tariffs (61)
Trump admin comments (46)
Coldplay concert CEO (44)
Blank / Unintelligible (42)
Trump’s health (37)
Crime (29)
Don’t know (27)
Israel-Gaza (21)
Russia-Ukraine (21)
War with Iran (17)
Economy (9)
Obama / Russiagate (9)
Sports (9)
Cryptocurrency / GENIUS Act (8)
Foreign policy (8)
Plane crashes (8)
Colbert Show cancellation (7)
Car strikes crowd in LA (6)
Zohran Mamdani (6)
NEW POLL: Despite Trump's best efforts to distract from the Epstein files, the Epstein case was the top news story for voters last week.
37% of voters have now heard "a lot" about the files, up from 25%.
www.dataforprogress.org/blog/2025/7/...
22.07.2025 18:31 — 👍 29 🔁 9 💬 2 📌 3

Jobs
📢 Come work at Data for Progress!
Have a knack for data and an interest in research?
We're hiring a polling analyst to help draft survey questions, analyze data, and craft polling memos for the progressive movement.
Apply at the link below ⤵️
www.dataforprogress.org/jobs
21.07.2025 19:29 — 👍 50 🔁 18 💬 4 📌 2
Bar chart of polling data from Data For Progress.
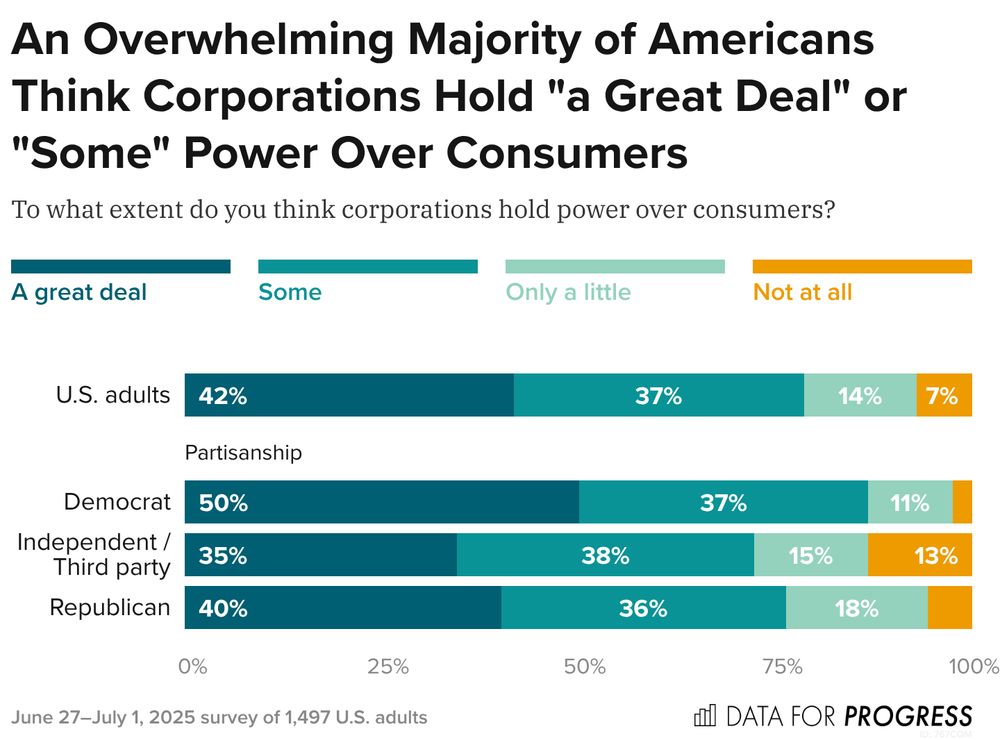
Title: An Overwhelming Majority of Americans Think Corporations Hold "a Great Deal" or "Some" Power Over Consumers.
Description: To what extent do you think corporations hold power over consumers?
U.S. adults — A great deal: 42%, Some: 37%, Only a little: 14%, Not at all: 7%
Democrat — A great deal: 50%, Some: 37%, Only a little: 11%, Not at all: 3%
Independent / Third party — A great deal: 35%, Some: 38%, Only a little: 15%, Not at all: 13%
Republican — A great deal: 40%, Some: 36%, Only a little: 18%, Not at all: 6%
June 27–July 1, 2025 survey of 1,497 U.S. adults.
The piece features new polling, which finds that Americans overwhelmingly think corporations hold power over consumers, and a majority have little or no trust in the U.S. government to protect their rights as consumers.
21.07.2025 17:44 — 👍 11 🔁 4 💬 0 📌 0

We Need a New Consumer Movement to Rein in Corporate Power
We need engaged and active consumers who will stand up to the corporate power that only keeps growing because we continue to feed it.
New DFP Insights from former CFPB Supervision Director Lorelei Salas:
"We need engaged and active consumers who will stand up to the corporate power that only keeps growing because we continue to feed it."
www.dataforprogress.org/insights/202...
21.07.2025 17:44 — 👍 133 🔁 48 💬 4 📌 4
Bar chart of polling data from Data For Progress.
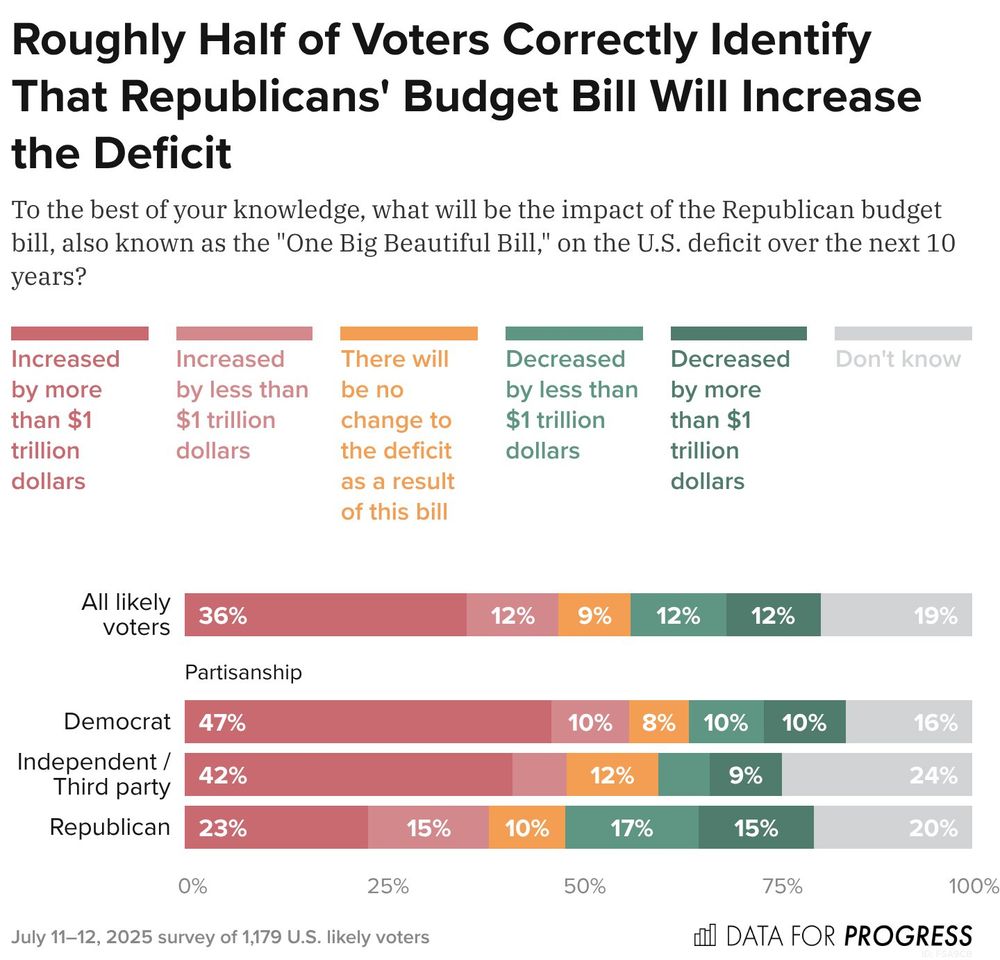
Title: Roughly Half of Voters Correctly Identify That Republicans' Budget Bill Will Increase the Deficit.
Description:
The chart shows responses to the question:
“What will be the impact of the Republican budget bill, also known as the 'One Big Beautiful Bill,' on the U.S. deficit over the next 10 years?”
Key:
a = Increased by more than $1 trillion
b = Increased by less than $1 trillion
c = No change to the deficit
d = Decreased by less than $1 trillion
e = Decreased by more than $1 trillion
f = Don't know
Results:
All likely voters — a: 36%, b: 12%, c: 9%, d: 12%, e: 12%, f: 19%
Democrat — a: 47%, b: 10%, c: 8%, d: 10%, e: 10%, f: 16%
Independent / Third party — a: 42%, b: 7%, c: 12%, d: 7%, e: 9%, f: 24%
Republican — a: 23%, b: 15%, c: 10%, d: 17%, e: 15%, f: 20%
Survey conducted July 11–12, 2025, among 1,179 U.S. likely voters.
Over the next 10 years, the Republican budget bill will add about $3 trillion to the deficit.
About half of voters say the bill will raise the deficit, but only 36% think that the bill will increase the deficit by more than $1 trillion.
www.dataforprogress.org/blog/2025/7/...
16.07.2025 18:16 — 👍 7 🔁 3 💬 0 📌 0
Bar chart of polling data from Data For Progress.
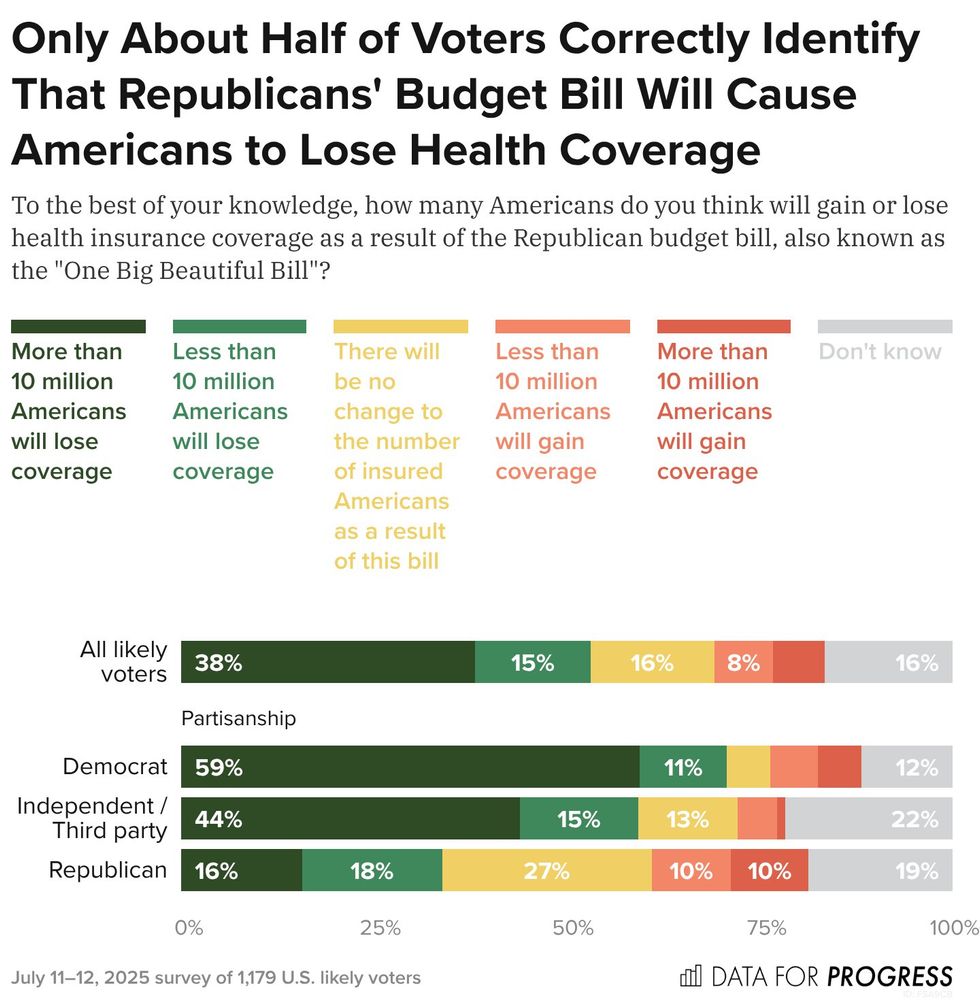
Title: Only About Half of Voters Correctly Identify That Republicans' Budget Bill Will Cause Americans to Lose Health Coverage.
Description:
The chart shows responses to the question:
“How many Americans do you think will gain or lose health insurance coverage as a result of the Republican budget bill, also known as the 'One Big Beautiful Bill'?”
Key:
a = More than 10 million will lose coverage
b = Less than 10 million will lose coverage
c = No change in number insured
d = Less than 10 million will gain coverage
e = More than 10 million will gain coverage
f = Don't know
Results:
All likely voters — a: 38%, b: 15%, c: 16%, d: 8%, e: 7%, f: 16%
Democrat — a: 59%, b: 11%, c: 6%, d: 6%, e: 6%, f: 12%
Independent / Third party — a: 44%, b: 15%, c: 13%, d: 5%, e: 1%, f: 22%
Republican — a: 16%, b: 18%, c: 27%, d: 10%, e: 10%, f: 19%
Survey conducted July 11–12, 2025 among 1,179 U.S. likely voters.
NEW: While a majority of voters (53%) say Trump's budget law will cause Americans to lose health insurance coverage, only 38% think that more than 10 million Americans will lose coverage.
www.dataforprogress.org/blog/2025/7/...
16.07.2025 18:16 — 👍 11 🔁 4 💬 1 📌 1
Bar chart of polling data from Data For Progress.
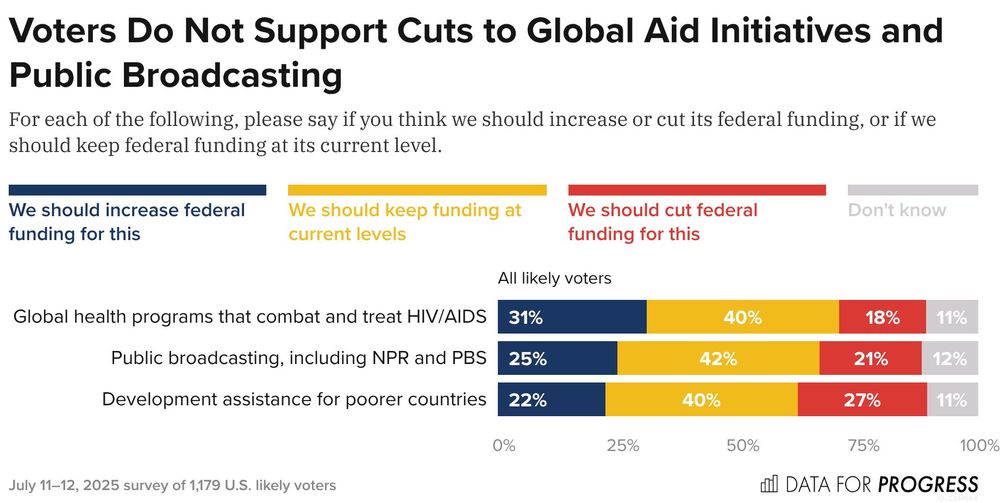
Title: Voters Do Not Support Cuts to Global Aid Initiatives and Public Broadcasting.
Description: For each of the following, please say if you think we should increase or cut its federal funding, or if we should keep federal funding at its current level.
Global health programs that combat and treat HIV/AIDS — We should increase federal funding for this: 31%, We should keep funding at current levels: 40%, We should cut federal funding for this: 18%, Don't know: 11%
Public broadcasting, including NPR and PBS — We should increase federal funding for this: 25%, We should keep funding at current levels: 42%, We should cut federal funding for this: 21%, Don't know: 12%
Development assistance for poorer countries — We should increase federal funding for this: 22%, We should keep funding at current levels: 40%, We should cut federal funding for this: 27%, Don't know: 11%
July 11–12, 2025 survey of 1,179 U.S. likely voters.
NEW: As Senate Republicans approach the Friday deadline to pass Trump’s rescissions package, voters reject the proposed billions of dollars in cuts to global aid and public broadcasting.
We find that less than 30% of voters want cuts to these programs.
www.dataforprogress.org/datasets/pol...
15.07.2025 13:54 — 👍 22 🔁 15 💬 0 📌 1
Bar chart of polling data from Data For Progress.
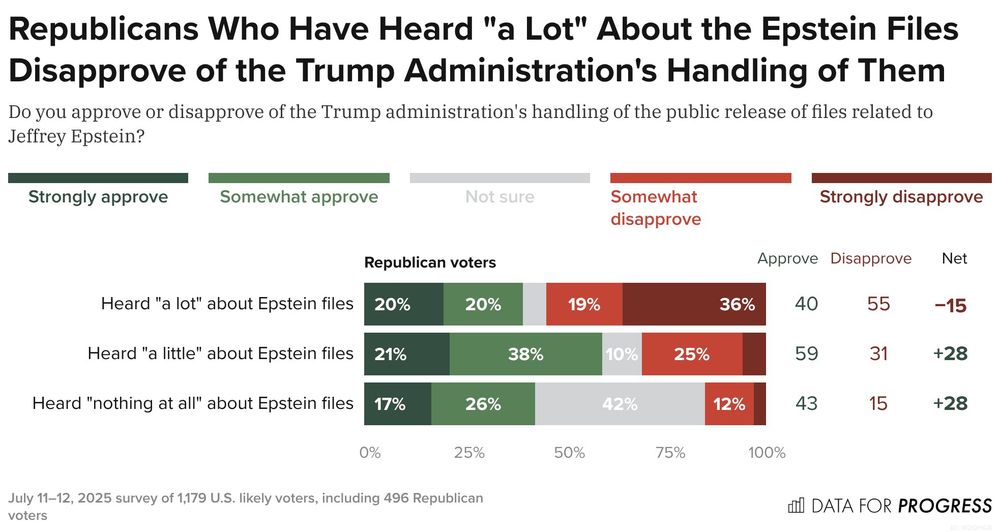
Title: Republicans Who Have Heard "a Lot" About the Epstein Files Disapprove of the Trump Administration's Handling of Them.
Description: Do you approve or disapprove of the Trump administration's handling of the public release of files related to Jeffrey Epstein?
Heard "a lot" about Epstein files — Approve: 39%, Disapprove: 55%
Heard "a little" about Epstein files — Approve: 59%, Disapprove: 31%
Heard "nothing at all" about Epstein files — Approve: 43%, Disapprove: 15%
July 11–12, 2025 survey of 1,179 U.S. likely voters, including 496 Republican voters.
Among Republican voters, those who have heard "a lot" about the Epstein files disapprove of Trump's handling of them by a -15-point margin.
www.dataforprogress.org/datasets/pol...
14.07.2025 19:12 — 👍 8 🔁 2 💬 1 📌 0
Bar chart of polling data from Data For Progress.
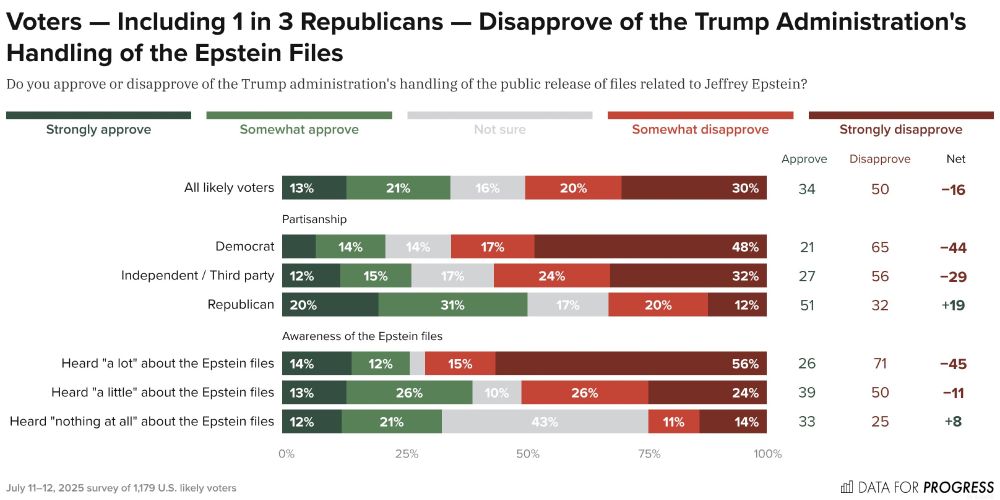
Title: Voters — Including 1 in 3 Republicans — Disapprove of the Trump Administration's Handling of the Epstein Files.
Description: Do you approve or disapprove of the Trump administration's handling of the public release of files related to Jeffrey Epstein?
All likely voters — Approve: 35%, Disapprove: 50%
Democrat — Approve: 21%, Disapprove: 65%
Independent / Third party — Approve: 27%, Disapprove: 56%
Republican — Approve: 51%, Disapprove: 33%
Heard "a lot" about the Epstein files — Approve: 26%, Disapprove: 71%
Heard "a little" about the Epstein files — Approve: 39%, Disapprove: 51%
Heard "nothing at all" about the Epstein files — Approve: 33%, Disapprove: 24%
July 11–12, 2025 survey of 1,179 U.S. likely voters.
NEW: Voters disapprove of the Trump administration's handling of the Epstein files by a -16-point margin, including 1 in 3 Republicans.
Voters who have heard "a lot" about the files disapprove by a -45-point margin.
www.dataforprogress.org/datasets/pol...
14.07.2025 19:12 — 👍 20 🔁 5 💬 1 📌 0