![People moving in Water logged area [Credit: DMC Sri Lanka via WHO]](https://cdn.bsky.app/img/feed_thumbnail/plain/did:plc:u6g7lrvd3rqarb36jqeekqb3/bafkreierikhmc6xpheb6qjn3fmioccfimhhawu53eil7b3rure7fvhulyu@jpeg)
People moving in Water logged area [Credit: DMC Sri Lanka via WHO]
Global #climate hazards @ukhsa.bsky.social 5th Dec 2025:
🌧️ #floods & landslides affect South & Southeast Asia, Bolivia, Peru & South Africa
🌩️ storms hit DR Congo & New Zealand
www.met.reading.ac.uk/~sgs02rpa/ex...
05.12.2025 16:58 — 👍 3 🔁 0 💬 0 📌 0

Flooded roads in Italy from above
Global #climate hazards @ukhsa.bsky.social 28 Nov 25
🌧️ #floods & landslides Albania, Italy, South Africa, French Polynesia, Malaysia, Indonesia, Philippines, Vietnam, Mexico
⛈️ storms hit eastern Australia, Brazil, USA, Sri Lanka & India
🥀 #drought grips Somalia
www.met.reading.ac.uk/~sgs02rpa/ex...
28.11.2025 17:04 — 👍 2 🔁 2 💬 0 📌 0

Chart showing annual cycle of Arctic sea ice extent for 2022-2025 plus 2016 and 2012
Slow late November growth in #Arctic sea ice extent, 2nd only to 2016 based on @nsidc.bsky.social data:
nsidc.org/sea-ice-toda...
24.11.2025 12:40 — 👍 3 🔁 3 💬 0 📌 0
You could email the author? Couldn’t find an open access version
21.11.2025 19:59 — 👍 0 🔁 0 💬 0 📌 0

In this photo released by the Indonesian National Search and Rescue Agency (BASARNAS) on Monday, Nov. 17, 2025, rescuers recover a victim of a landslide in Cilacap, Indonesia. (BASARNAS via AP)
Global #climate hazards @ukhsa.bsky.social 21 Nov 2025:
⛈️ storms hit Chile/Argentina, Portugal & UK
🌧️ #floods & landslides affect Italy/Slovenia, France, Republic of the Congo, Thailand, Vietnam, Indonesia, USA
www.met.reading.ac.uk/~sgs02rpa/ex...
21.11.2025 17:01 — 👍 4 🔁 1 💬 0 📌 0
No. But at the top of our new large water tank is the computer that assesses various in/out temperatures & weather conditions to fine tune things. There’s a survey before install to assess heat loss from each room so they know if to install bigger radiators and they’d answer these kinds of questions
19.11.2025 19:37 — 👍 1 🔁 0 💬 1 📌 0
Not noticed any issues? Our air to water heat pump is designed to work effectively and without issue down to -10C snd below and has inbuilt frost settings so shouldn’t be an issue in the UK, though regularly checking for debris or snow build up is also recommended.
19.11.2025 13:59 — 👍 1 🔁 0 💬 1 📌 0

The fast-fix for global warming that the UN climate summit can’t ignore
Removing so-called ‘short-lived climate pollutants’ from the atmosphere could reduce global warming – fast.
As well as rapidly cutting CO2 emissions, tackling short-lived warming agents like methane & surface ozone pollution boosts action to limit #climate warming + counteracts warming from cleaning our air of harmful aerosol particles that have robbed us of sunlight: theconversation.com/the-fast-fix...
19.11.2025 11:59 — 👍 12 🔁 2 💬 1 📌 1

Frost hollow created by heat pump
Our heat pump doing it’s job taking in cold air, extracting energy to heat our house and exhaling even colder air that has kept the dusting of snow happy in its artificial frost hollow long after it had melted away elsewhere!
19.11.2025 11:42 — 👍 28 🔁 3 💬 2 📌 0

map showing normal soil moisture in UK in October 2025

map showing very low groundwater in many UK aquifers in October 2025

map showing above average river flows in north west UK and below average in south and east in October 2025

map showing below average rainfall in October 2025 in most of UK
October 2025 quite dry in UK apart from N Ireland/west Scotland/Kent with below average river flows in east & depleted groundwater/reservoirs but wetter soils with low groundwater-fed river flows expected to continue despite early November deluges - @ceh.org summary:
nrfa.ceh.ac.uk/sites/defaul...
17.11.2025 17:19 — 👍 3 🔁 0 💬 1 📌 0

In this undated photo released by the Indonesian National Search and Rescue Agency (BASARNAS) on Friday, Nov. 14, 2025, rescuers search for survivors after a landslide on Thursday, Nov. 13 hit a village in Cilacap, Indonesia. (BASARNAS via AP)
Global #climate hazards @ukhsa.bsky.social 14 Nov 2025:
🌀 tropical cyclones affect Philippines, Taiwan, Japan
⛈️ storms hit Brazil, Portugal, Spain, Burundi
🌧️ landslides #floods DR Congo, Pakistan, Thailand, Indonesia
🏭 smog Delhi/India
🥀 #drought Iran, Somalia
www.met.reading.ac.uk/~sgs02rpa/ex...
14.11.2025 17:18 — 👍 3 🔁 0 💬 0 📌 0

Flows of carbon in giga tonnes carbon per year between atmosphere, ocean and land
New assessment reported @nature.com finds weaker land carbon sink but stronger ocean sink than previously thought with #climate change and deforestation stifling how much carbon the continents can take up, leaving more behind to raise atmospheric CO2 levels:
doi.org/10.1038/s415...
13.11.2025 12:28 — 👍 4 🔁 2 💬 0 📌 0

Keep Caversham Tidy volunteers stand ubiquitously by their collected litter
In glorious Autumn sunshine we cleared Amersham Rd & southern offshoots, collecting 8 large/14 small bags of litter, finding wrappers so old they could be archaeological! See future rubbish events on the rubbish website:
www.met.reading.ac.uk/~sgs02rpa/KCT/
08.11.2025 13:41 — 👍 3 🔁 1 💬 0 📌 0

© WFP/Arete Communities in Jamaica are clearing up after the devastation caused by Hurricane Melissa.
Global #climate hazards @ukhsa.bsky.social 7th Nov 25:
🌀 Tropical Cyclones affect Caribbean and South East Asia
🌧️ Landslides & floods hit Uganda/Kenya
⛈️ Storms strike Brazil
⚪ Giant Hail in northeast Australia
🏔️ Avalanches in Italy & Nepal
www.met.reading.ac.uk/~sgs02rpa/ex...
07.11.2025 16:38 — 👍 4 🔁 0 💬 0 📌 0

Schematic of solar radiation modification techniques
New @royalsociety.org report assesses geoengineering #climate to mask human caused warming by artificially injecting aerosol haze to reflect sunlight, arguing it can only be used as a well coordinated compliment to deficient mitigation of greenhouse gas emissions:
royalsociety.org/news-resourc...
06.11.2025 06:49 — 👍 8 🔁 1 💬 1 📌 0

Your flight emissions are way higher than carbon calculators suggest
Existing tools that work out the carbon footprint of flights greatly underestimate their warming impact, say the makers of a new calculator
Impact of flights on global warming severely underestimated by many carbon calculators & offset schemes that don’t properly account for taxiing, sub-optimal routing or non-CO2 climate effects which are larger component:
www.newscientist.com/article/2502...
Research paper:
doi.org/10.1038/s432...
03.11.2025 08:11 — 👍 124 🔁 71 💬 1 📌 10
![A building stands amid torn tree branches in an affected area, after Hurricane Melissa made landfall in Black River, Jamaica, on October 30, 2025 [Octavio Jones/REUTERS]](https://cdn.bsky.app/img/feed_thumbnail/plain/did:plc:u6g7lrvd3rqarb36jqeekqb3/bafkreigghpatx627u4o6vfqai346rjricb7aw54x7tf54hxqb3ugt6dlma@jpeg)
A building stands amid torn tree branches in an affected area, after Hurricane Melissa made landfall in Black River, Jamaica, on October 30, 2025 [Octavio Jones/REUTERS]
Global #climate hazards @ukhsa.bsky.social 31 Oct 2025:
🌀 Hurricane MELISSA hits Caribbean
🌀 Cyclone MONTHA affects India
⛈️ storms across USA
🌧️ #floods over Colombia, Indonesia, Vietnam, Spain, South Sudan
🏔️landslides in Uganda & Papua New Guinea
www.met.reading.ac.uk/~sgs02rpa/ex...
31.10.2025 15:52 — 👍 5 🔁 1 💬 0 📌 0

Figure 3 of Burgard et al. showing how Antarctic ice shelves become unviable for warming above 4.7 degrees Celsius

Fig. 4 of Brugard et al. shwoing ice shelves at risk in low and high emissions scenarios
Keeping the planet below the 2°C Paris #climate limit will ensure almost all Antarctic ice shelves remain, while most will eventually melt as after warming passes 4.5°C with the potential for 10 metres of sea level rise - based on @nature.com study:
doi.org/10.1038/s415...
30.10.2025 12:34 — 👍 5 🔁 2 💬 0 📌 0

10 New Insights in Climate Science
Essential research findings to support decision-making in a critical decade.
Rapid warming from rising greenhouse gases + declining aerosol particle pollution are worsening extremes, depleting groundwater & limiting carbon uptake by land - #10ClimateInsights:
10insightsclimate.science
30.10.2025 08:12 — 👍 5 🔁 2 💬 0 📌 0
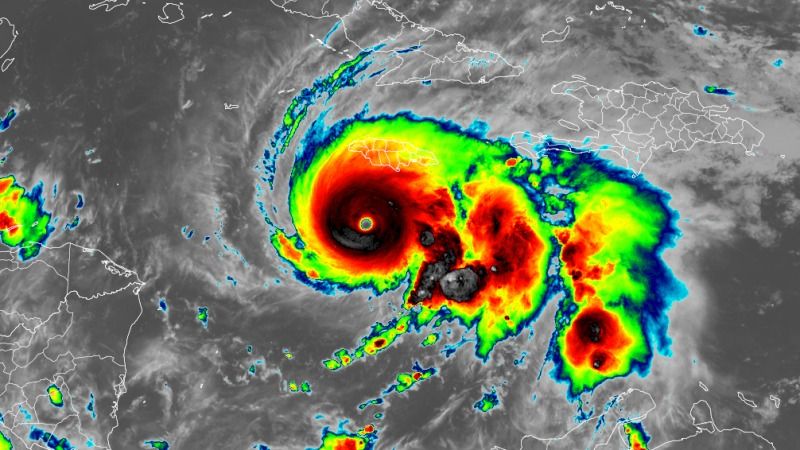
Hurricane Melissa is now the strongest storm on the planet this year | CNN
Melissa is about to deliver Jamaica its most devastating blow from a hurricane.
Mandatory evacuation orders have been issued for coastal areas of Jamaica before landfall by Melissa, currently the strongest hurricane of 2025.
Follow live updates: https://cnn.it/3WYcbAd
27.10.2025 19:30 — 👍 78 🔁 40 💬 11 📌 6

climate extremes contribute to food insecurity in Zambia [IPC ACUTE FOOD INSECURITY ANALYSIS APRIL 2025 – MARCH 2026 Published on 17 October 2025
Global #climate hazards @ukhsa.bsky.social:
🌀 tropical cyclone MELISSA in Caribbean
💨 storm Amy France/UK
⛈️ storms Brazil, Colombia, New Zealand, Philippines
🏭 smog N India
🌫️ freezing fog Finland
🌧️ #floods Indonesia, Mexico
🥀 #heatwave & #drought Mali & Zambia
www.met.reading.ac.uk/~sgs02rpa/ex...
24.10.2025 15:03 — 👍 4 🔁 1 💬 0 📌 0

Map showing above average rainfall in September 2025 over many western and central parts of UK in contrast to last 6 months

High river flows in many western parts of UK in September 2025 but low in the east
Latest @ukceh.bsky.social UK hydrological summary for September 2025 - some respite from dry conditions with high river flow in northwest but low in parts of the east and depleted groundwater across many regions:
nrfa.ceh.ac.uk/sites/defaul...
17.10.2025 14:29 — 👍 9 🔁 2 💬 0 📌 0
🎓 PhD (Environment & Resource Studies) | MSS & BSS Hons' (Anthropology)| 🛠️ Nature-based Solutions, Climate Resilient Development, Green Finance, Coastal Management, Gender–Environment | X: @Gender_Env
Associate Professor of Climate Science at Scripps Institution of Oceanography/UCSD
Independent Journalist | IT Engineer | Advocate for Peace, Democracy & Social Justice | Son of a farmer who works in the fields. | Motherland & land of duty, Nepal. 🇳🇵 | Father of 18 orphaned daughters. | A person who enjoys doing social service.
Senior Scientist of Coastal and Marine Ecology Division at GUIDE. Oceanography and Marine biologist.
Environment editor @ The Economist
PhD Student @UBCGeog: Climate science, summer heat in coastal urban areas, and climate adaptation. Former HS Math & Physics Teacher. Prior PhD Geophysics @UMNEarthScience
M.Sc. Graduate, KNT University
Photogrammetry | Remote Sensing
Remote Sensing → Environmental Monitoring, Forest Ecology, Wildfire
Photogrammetry → Bundle Adjustment, UAV, Canopy Cover
#RemoteSensing #Photogrammetry #UAV #Drone #DeepLearning #GIS
Research Manager for @cclusa.org, environmental scientist, climate journalist for @climateconnections.bsky.social. Views my own.
The Rutgers Climate and Energy Institute advances a resilient, equitable, and sustainable climate future by connecting faculty, staff, and students through research, innovation, education, and outreach. https://rcei.rutgers.edu/
reporter at cnbc.com. email: lora.kolodny@cnbc.com - ex-wsj, techcrunch & all over. i cover: elon musk cos. mostly tesla (some climate tech startups). my posts here are my own. optimistic on the inside. dm me on signal: lorakolodny.55
Vermont-based climate and weather blogger/reporter Also, gardens, photography, nature, humor
Author, feminist, liberal arts educator, homeschool consultant. Lives in Rome. Cares about climate change & outdated education systems. Excited by poetry & science. No DM’s. 🇪🇺
Under the Camelthorn Tree W&N 2019
The Maternal Element Salt Publishing 2026
All in on refrigerants and f-gases. Especially the environmental impacts - upstream and downstream.
Climate scientist; ocean carbon cycle and climate solutions. Professor, University of Hawaiʻi at Mānoa; Visiting Faculty, Arizona State University. https://linktr.ee/david_ho
Associate Professor at LSE Geography & Environment
🌏 environmental change & sustainability 🔥 wildfire emissions & models 🌴 tropical peatlands 👨🎓 innovative climate education #firstgen
Asking the hard questions and bringing unique perspectives from across the globe. This is CNN.
Teacher, robotics coach & occasional blogger. Optimist & incremental revolutionary. Introvert. Idealist. Enjoy audiobooks, long bicycle rides, travel & coffee.
Climate Scientist
Assistant Professor at @vuamsterdam.bsky.social
Working on climate and weather extremes & impacts
https://sites.google.com/view/bor-ting-jong/home
Microbial oceanographer, crochet designer, Mashreq percussionist, and friEndo. Welcome to the House of Tortitude.
she/her