Life satisfaction mostly declines with age. Previous findings (esp. the famous U-shaped age-SWB trajectory) were artifacts of misspecified models. doi.org/10.1093/esr/...
29.09.2025 12:14 — 👍 163 🔁 51 💬 10 📌 43
@fabitmart.bsky.social
Applied Economist. Research Fellow at University of Newcastle, Australia. Health, Law & Econ, Education. Passionate applied econometrics. #econsky
Life satisfaction mostly declines with age. Previous findings (esp. the famous U-shaped age-SWB trajectory) were artifacts of misspecified models. doi.org/10.1093/esr/...
29.09.2025 12:14 — 👍 163 🔁 51 💬 10 📌 43Like this! sessioninfo::session_info() can now (or will after review) output to LaTeX #rstats github.com/r-lib/sessio...
19.09.2025 17:28 — 👍 44 🔁 4 💬 0 📌 0
Extending ideas originally proposed by Charles Manski in 1988 and considering quantile-welfare evaluations of health policy as an alternative to utilitarian evaluation, from Charles F. Manski and @johnmullahy.bsky.social https://www.nber.org/papers/w34247
19.09.2025 19:00 — 👍 10 🔁 1 💬 1 📌 0
A new paper I worked on is out in Justice Quarterly! I won't speak on the substantive nature of the paper as I worked solely as the methodologist, but I developed a new matching method not otherwise described in the literature, and I want to tell you about it!
#statssky #casualsky

For the open source devotees out there, I've integrated @OpenFreeMapOrg into the #rstats {mapgl} package.
Do `maplibre(style = openfreemap_style("liberty"))` for an excellent street map with 3D buildings; "bright" & "positron" are also available.
Map with no API keys required!
The new {marginaleffects} release for #RStats (0.30.0) comes with two new vignettes:
1. Speed up computation with automatic differentiation (often 10x gains) marginaleffects.com/bonus/perfor...
2. Power analyses with {marginaleffects} and {DeclareDesign}. marginaleffects.com/bonus/power....

I am beyond excited to announce that ggplot2 4.0.0 has just landed on CRAN.
It's not every day we have a new major #ggplot2 release but it is a fitting 18 year birthday present for the package.
Get an overview of the release in this blog post and be on the lookout for more in-depth posts #rstats
New The Effect materials today: introductions to basic coding and data manipulation in R, Stata, and Python. Get the wheels turning on using these languages with data with these intro pages and exercises:
nickchk.com/Coding%20and...
nickchk.com/Coding%20and...
nickchk.com/Coding%20and...
My paper on designing and analyzing powerful experiments is now up online at Fiscal Studies. Here is my shareable link for free access: onlinelibrary.wiley.com/share/author...
04.09.2025 19:17 — 👍 14 🔁 3 💬 0 📌 1
📢 R Dev Day @ Australia
🏢 Monash University, Melbourne
🌐 Remote, Australia
📅 Fri 21 Nov
It's happening!
Apply to attend this free event, to collaborate on contributions to #RStats! You don't need to be an R guru!
Deadline Sunday 16 Nov: pretix.eu/r-contributo...
#RDevDay #RSEng
Running R code on your phone... that is definitely magic!!
webR also makes it super easy to create #rstats learning resources that students can work with using just a browser, no install drama needed.
jen-richmond.quarto.pub/barbarplots/
Didn't they get the memo that some of us use Windows for work, not to roleplay Tron?
14.08.2025 01:39 — 👍 0 🔁 0 💬 0 📌 0


Grad programs often don't teach folks how to write good reviewer reports. Here are some resources:
1. @brendannyhan.bsky.social review checklist: thepoliticalmethodologist.files.wordpress.com/2016/02/tpm_...
2. "How to Write an Effective Referee Report": aeaweb.org/articles?id=...
What else?

Source: "Producing Health: Measuring Value Added of Nursing Homes"
Forthcoming, Econometrica
dropbox.com/scl/fi/3nw2j...

All good things come in pairs. Or threes?
My 3rd paper using football data. This time a labor question.
draft! Comments welcome
papers.ssrn.com/sol3/papers....
Lol I love this hot take. On point.
05.08.2025 12:12 — 👍 1 🔁 0 💬 0 📌 0Highly relevant to anybody working with regression discontinuity designs
03.08.2025 21:40 — 👍 11 🔁 4 💬 0 📌 0Georgia Papadogeorgou, Zhaoyan Song, Guido Imbens, Fabrizia Mealli: Causal Inference when Intervention Units and Outcome Units Differ https://arxiv.org/abs/2507.20231 https://arxiv.org/pdf/2507.20231 https://arxiv.org/html/2507.20231
29.07.2025 06:53 — 👍 3 🔁 2 💬 0 📌 0How insane is it that openai asks for BIOMETRIC information for using its API with the o3 model?! Asking me to take a selfie and upload personal documents. Anthropic, here I come #dataskyence
28.07.2025 05:22 — 👍 1 🔁 1 💬 0 📌 0Yes please!
28.07.2025 01:13 — 👍 1 🔁 0 💬 0 📌 0Something you might find helpful is ggview::canvas() for setting the in RStudio viewing pane to be in the proportions you intend to export in. So it should look the same as a saved figure.
25.07.2025 09:48 — 👍 26 🔁 3 💬 5 📌 1A little while ago I saw a really beautiful colour palette/colour science post. It was something to do with capturing pastel/water colours and transformations to the colourspace. I can't for the life of me remember what is was called, does anyone remember this? #rstats
23.07.2025 08:20 — 👍 7 🔁 9 💬 2 📌 0Revising my survey and experiments grad course and looking for examples of papers that do a good job of (really) integrating observational and experimental data. Suggestions? Self-reference welcome.
21.07.2025 21:50 — 👍 14 🔁 7 💬 7 📌 0Very very interesting and looking forward to reading it in full
23.07.2025 01:46 — 👍 4 🔁 1 💬 0 📌 0These course notes on nonparametric regression (including kernel density estimation) by Eduardo García Portugués are *fantastic*. So clear, with great visuals and clear code.
22.07.2025 21:10 — 👍 54 🔁 6 💬 5 📌 0This goes in the right direction but I guess I'm wondering what is the best practice for implement something like this in latex
18.07.2025 07:16 — 👍 1 🔁 0 💬 0 📌 0I'm talking about several things at once. The mechanical way of placing figures is maybe easier to figure out. But how to do it in a way that is aesthetically pleasing, like a professional magazine editor would it, is less easy. It's an overlooked aspect of data viz
18.07.2025 02:11 — 👍 1 🔁 0 💬 1 📌 0#rstats and TeX friends: what are your best takes on how to nicely size and place figures in academic articles? I spend time curating my #dataviz but then I default to big page-wide plots that end up automatically at the bottom of the document. Any tips/resources?
#latex
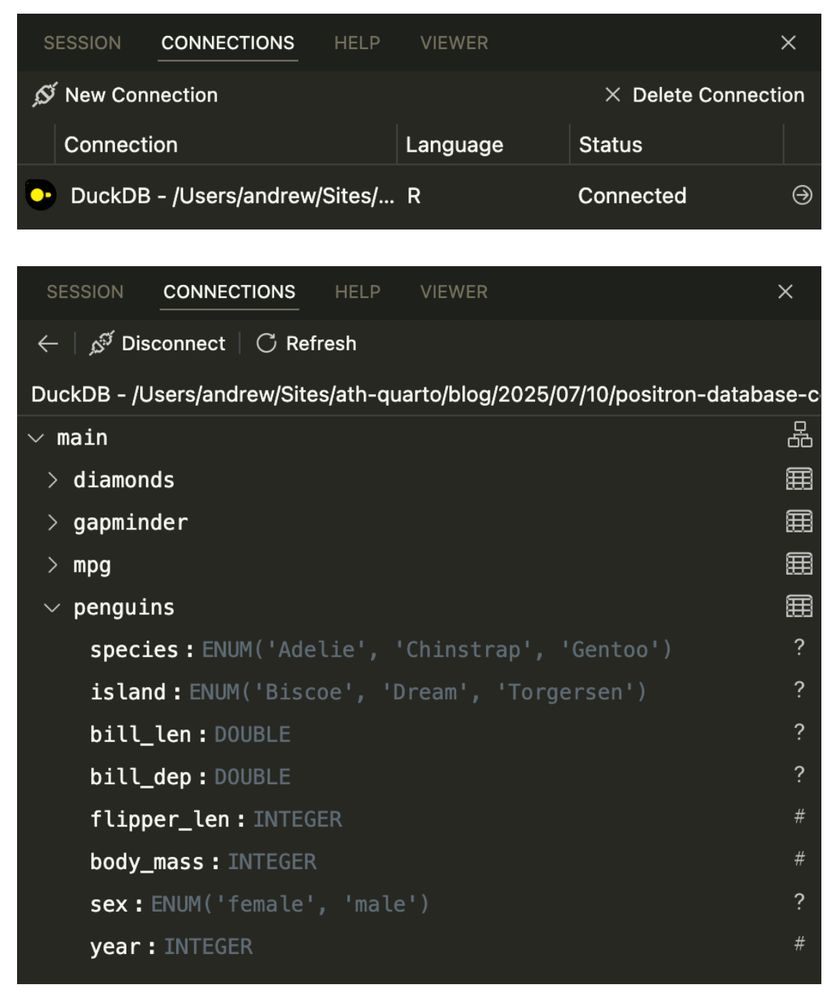
Screenshot of a connection to a DuckDB database, and a screenshot of the columns of one of the tables in that database
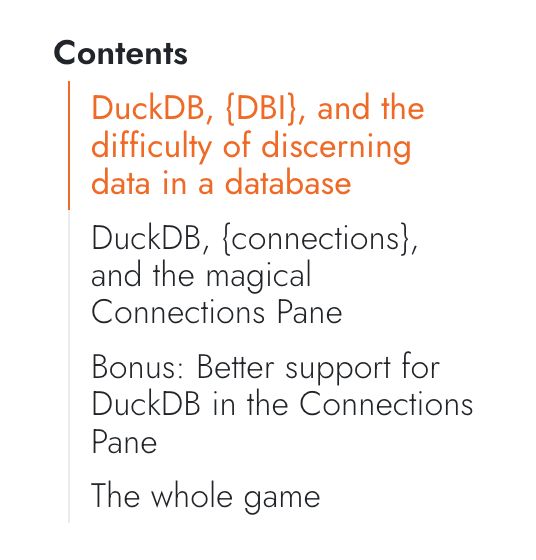
Table of contents for the post: - DuckDB, {DBI}, and the difficulty of discerning data in a database - DuckDB, {connections}, and the magical Connections Pane - Bonus: Better support for DuckDB in the Connections Pane - The whole game
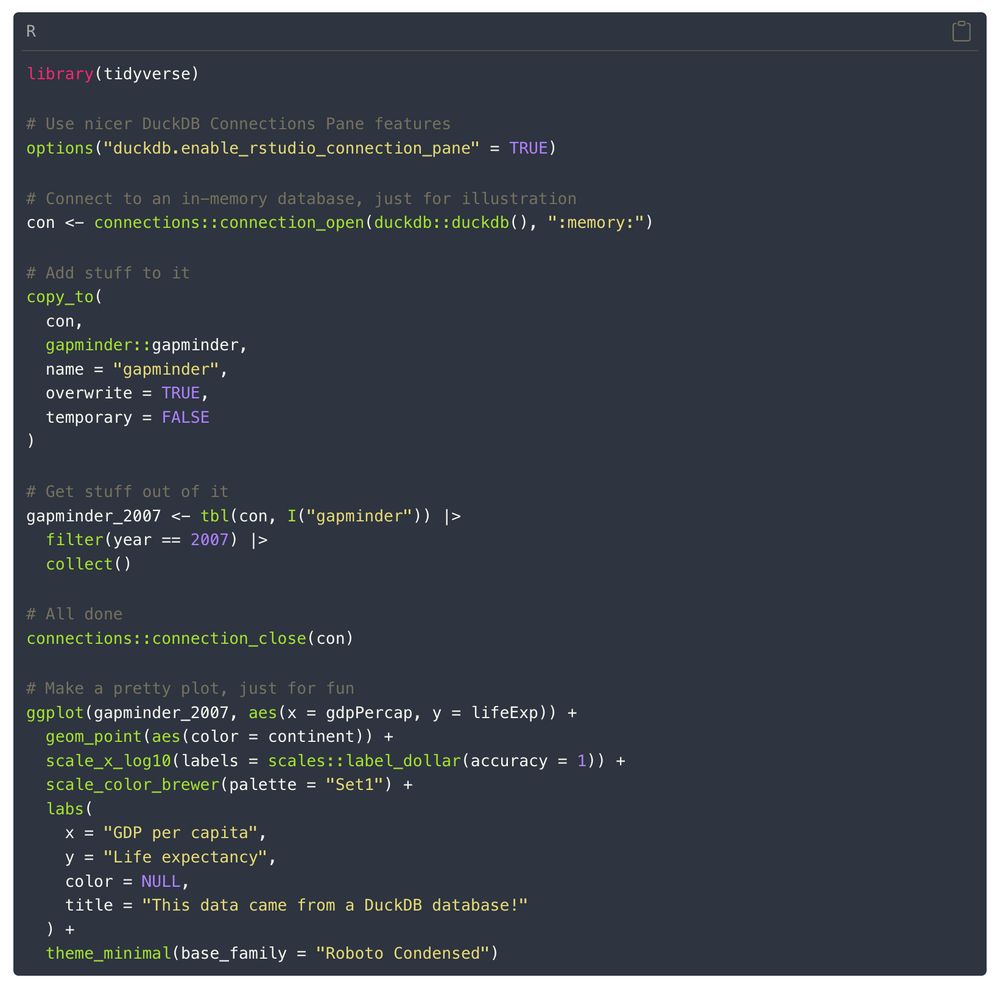
R code for connecting to a database, adding stuff to it, extracting it, and plotting it library(tidyverse) # Use nicer DuckDB Connections Pane features options("duckdb.enable_rstudio_connection_pane" = TRUE) # Connect to an in-memory database, just for illustration con <- connections::connection_open(duckdb::duckdb(), ":memory:") # Add stuff to it copy_to( con, gapminder::gapminder, name = "gapminder", overwrite = TRUE, temporary = FALSE ) # Get stuff out of it gapminder_2007 <- tbl(con, I("gapminder")) |> filter(year == 2007) |> collect() # All done connections::connection_close(con) # Make a pretty plot, just for fun ggplot(gapminder_2007, aes(x = gdpPercap, y = lifeExp)) + geom_point(aes(color = continent)) + scale_x_log10(labels = scales::label_dollar(accuracy = 1)) + scale_color_brewer(palette = "Set1") + labs( x = "GDP per capita", y = "Life expectancy", color = NULL, title = "This data came from a DuckDB database!" ) + theme_minimal(base_family = "Roboto Condensed")
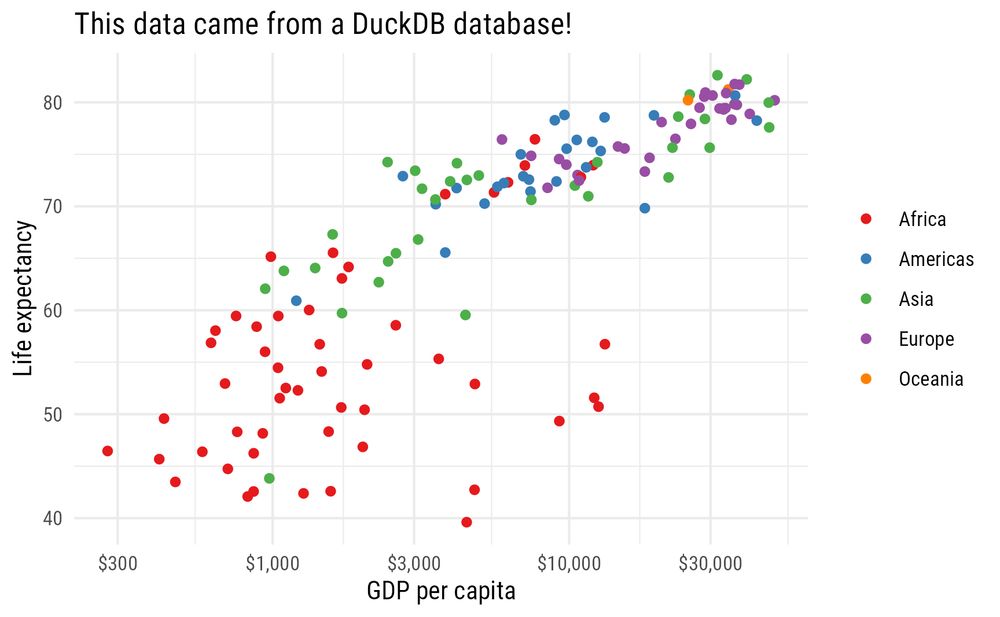
Scatterplot showing global health and wealth from gapminder in 2007
Another @posit.co Positron blog post! To make it easier to work with some huge data in one of my projects, I've loaded it into @duckdb.org. The Connections Pane makes it really easy and convenient to connect to and explore databases with #rstats. Here's how: www.andrewheiss.com/blog/2025/07...
10.07.2025 18:19 — 👍 82 🔁 20 💬 2 📌 0