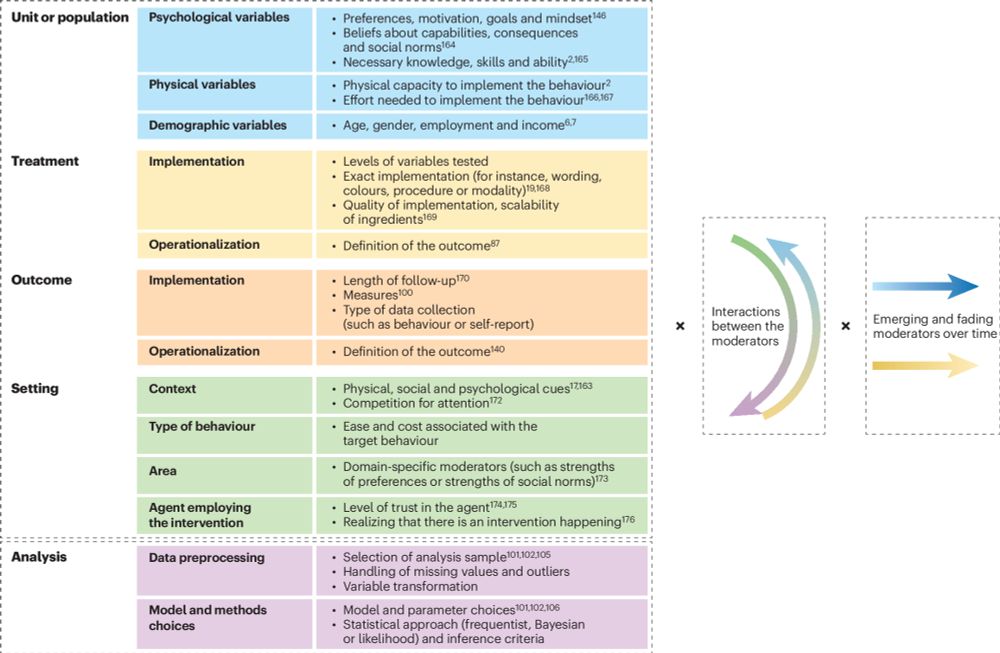
Generalizability of choice architecture interventions
Nature Reviews Psychology - Choice architecture interventions (or ‘nudges’) aim to guide behaviour by changing the proximal physical, social or psychological environment. In this...
🧵 Can you predict whether behavioral interventions will work in new contexts?
… probably not, right?
In our new paper with @dggoldst.bsky.social @dilipsoman.bsky.social @susanmichie.bsky.social, we dive into how to better understand and improve generalizability. rdcu.be/ewD2z
Summary👇
28.07.2025 10:53 — 👍 38 🔁 14 💬 2 📌 0

UPF and HFSS – different labels, same foods?
An analysis of where ultra-processed foods meet those high in fat, sugar and salt
Ultra-processed foods (UPFs) have become central to recent debates around fixing our broken food environment.
Latest Nesta analysis looks at whether regulating UPFs could help to improve UK diets ⬇️ www.nesta.org.uk/report/upf-a...
11.04.2025 08:55 — 👍 3 🔁 1 💬 1 📌 3
Weighting by price can create a perverse incentive for companies to lower the price of less healthy products so that these products count less towards their health measure.
To find out more check out the blog here www.nesta.org.uk/blog/how-com...
(12/12)
18.03.2025 17:50 — 👍 0 🔁 0 💬 0 📌 0
Finally, these continuous measures should be sales weighted and these sales should be measured in kilograms. Weighting by sales in kilograms ensures we capture the impact of these products on consumption. (11/12)
18.03.2025 17:50 — 👍 0 🔁 0 💬 1 📌 0
With a binary measure, they are forced to select from a narrow subset of products, limiting a company's ability to make the most cost-effective health improvements. (10/12)
18.03.2025 17:50 — 👍 0 🔁 0 💬 1 📌 0
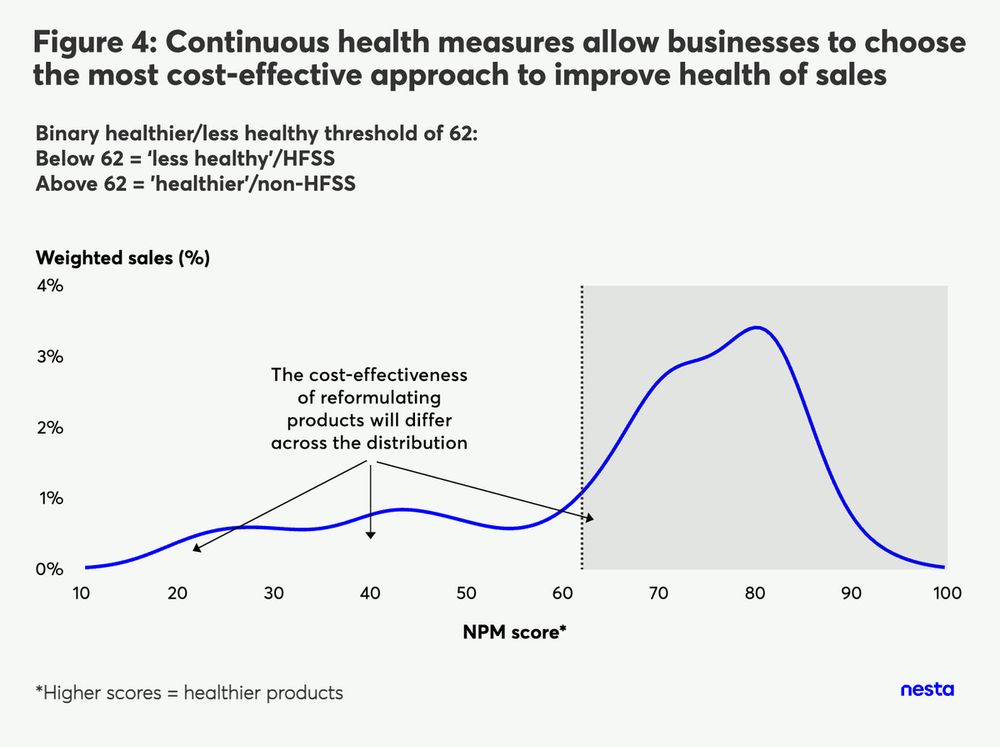
Figure 4: Continuous health measures allow businesses to choose the most cost-effective approach to improve the health of sales
A line chart illustrates how reformulation incentives vary across the NPM score distribution. The x-axis represents NPM scores (0-100), and the y-axis shows weighted sales (%). Unlike binary targets, continuous health measures enable businesses to improve product health strategically. Instead of focusing only on products near a single threshold, companies can make cost-effective decisions to reformulate a wider range of products. This flexibility ensures broader improvements in product health and a more effective approach to encouraging healthier sales, as shown by the annotations indicating varying cost-effectiveness across different NPM score ranges.
Reformulation costs differ by product. With continuous measures, a company can choose the products that are the most cost effective to improve for a given level of health impact. This is because improvements to health are equally rewarded regardless of how healthy the product is to start with (9/12)
18.03.2025 17:50 — 👍 0 🔁 0 💬 1 📌 0
So, it is clear that continuous measures are better measures of health.
These continuous measures are also better for business. (8/12)
18.03.2025 17:50 — 👍 0 🔁 0 💬 1 📌 0
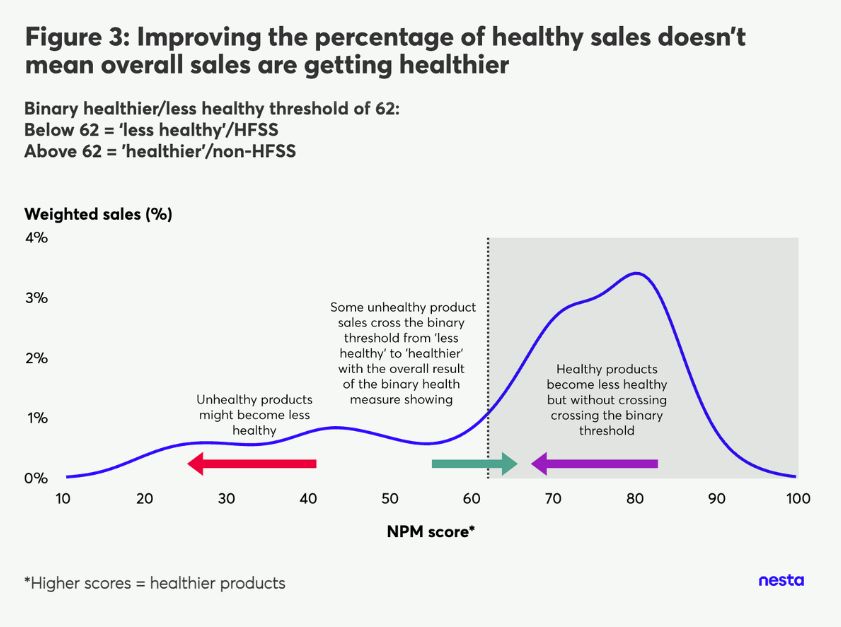
Figure 3: Improving the percentage of healthy sales doesn't mean overall sales are getting healthier
A line chart demonstrates that binary health thresholds can create misleading improvements. The x-axis represents NPM scores (0-100), and the y-axis shows weighted sales (%). Some unhealthy products are reformulated just enough to cross the threshold, classifying them as “healthier,” while other products may become less healthy but remain within the same category. This shift increases the percentage of "healthy" sales without significantly improving overall product health. The arrows indicate how sales are redistributed across the threshold, highlighting the unintended consequences of relying on binary health classifications rather than continuous measures.
This situation can happen when: 1) already-healthy products become less healthy but stay above the threshold, 2) unhealthy products become even worse, while 3) some products near cross from "less healthy" into "healthy" territory. (7/12)
18.03.2025 17:50 — 👍 0 🔁 0 💬 1 📌 0
Now, a seemingly contradictory statement - A company can improve its percentage of "healthy" products, i.e. its binary health score, without actually making their overall sales healthier. How is this possible? (6/12)
18.03.2025 17:50 — 👍 0 🔁 0 💬 1 📌 0
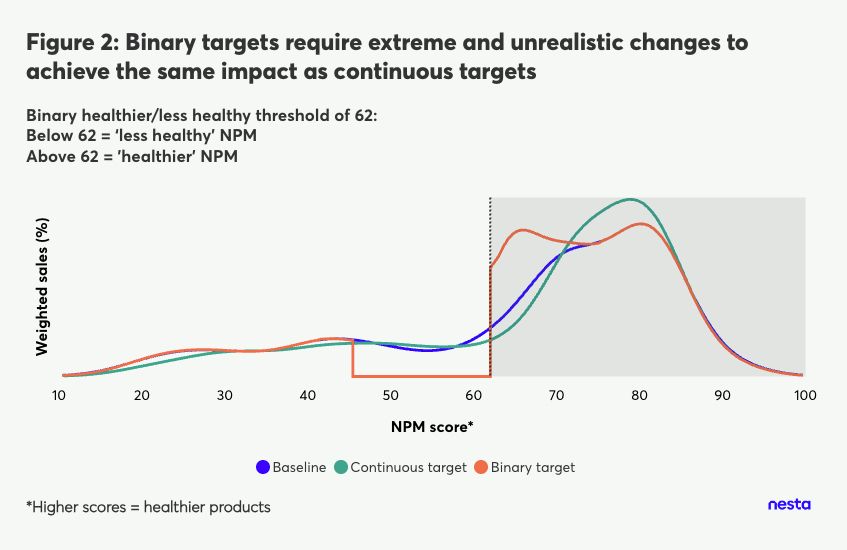
We modelled the reformulation required under binary and continuous health measures to achieve a similar impact on calories. The results? Continuous targets require smaller, realistic improvements spread across more products, while binary targets demand extreme reformulation of fewer products. (5/12)
18.03.2025 17:50 — 👍 0 🔁 0 💬 1 📌 0
A continuous measure, however, incentivises change across the whole portfolio, as products don't need to cross a threshold to "count" as being improved. A continuous measure recognises improvements in health regardless of how healthy the product is to begin with. (4/12)
18.03.2025 17:50 — 👍 0 🔁 0 💬 1 📌 0
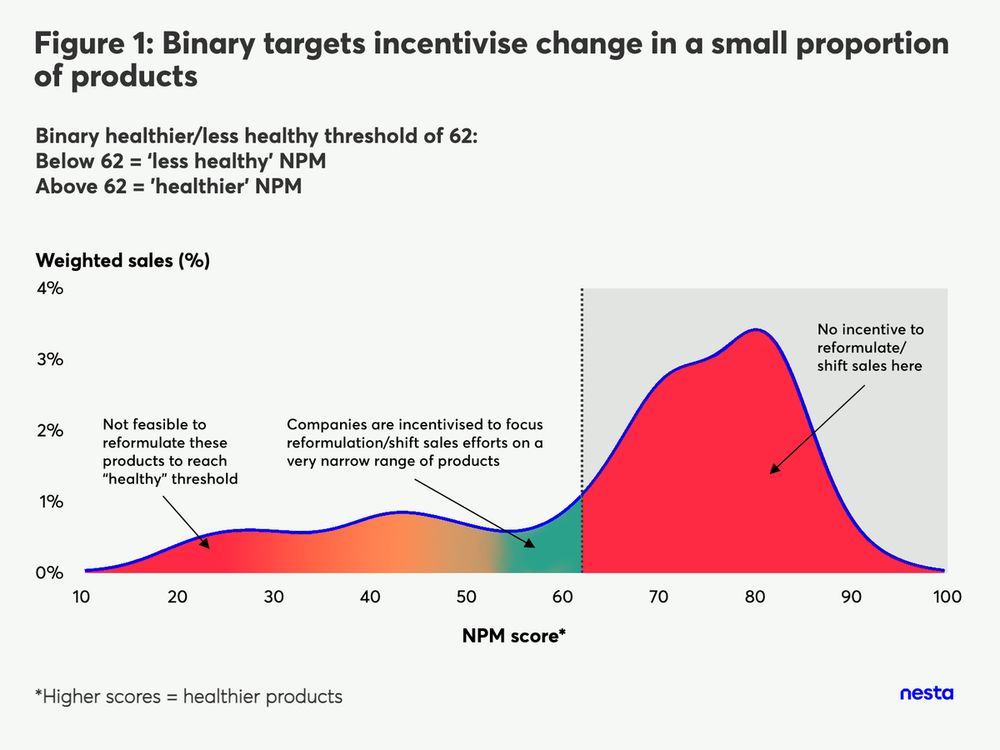
Figure 1: Binary targets incentivise change in a small proportion of products
The chart shows the distribution of product sales by NPM score, illustrating how binary health targets create limited incentives for reformulation. The x-axis represents NPM scores (0-100), and the y-axis shows weighted sales (%). Companies focus only on products just below the "healthy" threshold (62), while products far below or above remain unchanged. This narrow focus results in minimal overall health improvements. The shaded areas highlight where reformulation is prioritized and where it is not, emphasizing how binary thresholds fail to drive widespread product health improvements.
The key issue with binary measures is that they only incentivise change in a narrow subset of products - those products that are just below the "healthy threshold". (3/12)
18.03.2025 17:50 — 👍 0 🔁 0 💬 1 📌 0
What are binary and continuous measures? Binary measures bin products into 2 categories, e.g. healthier and less healthy, and then report what percentage of products sold are healthy. Continuous measures instead take the average nutrition score of products sold by a company. (2/12)
18.03.2025 17:50 — 👍 0 🔁 0 💬 1 📌 0
How companies should measure and set targets for the healthiness of their products
Food companies should set targets using continuous, kilogram-weighted health measures, rather than relying solely on binary thresholds
Excited to share my blog on how food companies should measure and set targets for the healthiness of their products.
A 🧵 on the benefits of continuous measures of health, over and above binary ones, for reporting and target setting. (1/12)
18.03.2025 17:50 — 👍 0 🔁 0 💬 1 📌 0

A woman looking earnestly into the camera saying "your outie enjoys programming in base R"
#RStats
"Your outie enjoys programming in base R."
03.03.2025 08:16 — 👍 25 🔁 6 💬 2 📌 0
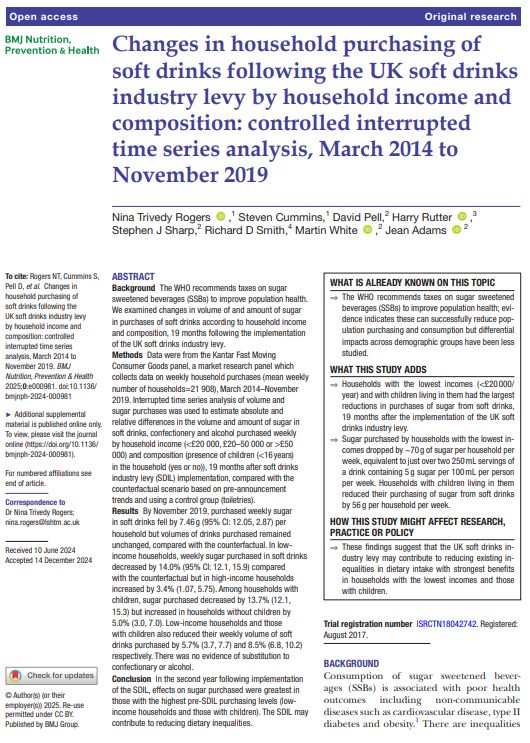
Background The WHO recommends taxes on sugar sweetened beverages (SSBs) to improve population health. We examined changes in volume of and amount of sugar in purchases of soft drinks according to household income and composition, 19 months following the implementation of the UK soft drinks industry levy.
Methods Data were from the Kantar Fast Moving Consumer Goods panel, a market research panel which collects data on weekly household purchases (mean weekly number of households=21 908), March 2014–November 2019. Interrupted time series analysis of volume and sugar purchases was used to estimate absolute and relative differences in the volume and amount of sugar in soft drinks, confectionery and alcohol purchased weekly by household income (<£20 000, £20–50 000 or >£50 000) and composition (presence of children (<16 years) in the household (yes or no)), 19 months after soft drinks industry levy (SDIL) implementation, compared with the counterfactual scenario based on pre-announcement trends and using a control group (toiletries).
Results By November 2019, purchased weekly sugar in soft drinks fell by 7.46 g (95% CI: 12.05, 2.87) per household but volumes of drinks purchased remained unchanged, compared with the counterfactual. In low-income households, weekly sugar purchased in soft drinks decreased by 14.0% (95% CI: 12.1, 15.9) compared with the counterfactual but in high-income households increased by 3.4% (1.07, 5.75). Among households with children, sugar purchased decreased by 13.7% (12.1, 15.3) but increased in households without children by 5.0% (3.0, 7.0). Low-income households and those with children also reduced their weekly volume of soft drinks purchased by 5.7% (3.7, 7.7) and 8.5% (6.8, 10.2) respectively. There was no evidence of substitution to confectionary or alcohol.
Conclusion In the second year following implementation of the SDIL, effects on sugar purchased were greatest in those with the highest pre-SDIL purchasing levels (low-income household…
ICYMI: Our new paper on the impact of the UK Soft Drinks Industry Levy is out. 19 months after implementation, we found that households purchased 7.5g less sugar from soft drinks compared to expected - equivalent to a 2.6% reduction. nutrition.bmj.com/content/earl...
06.02.2025 18:17 — 👍 39 🔁 16 💬 2 📌 1

The UK wants to lose weight - and backs government action to make food healthier
Most of the public are concerned about their weight and support interventions that would improve the nation's health.
New analysis and polling from @nestauk.bsky.social — and my first blog for Nesta.
The UK wants to lose weight and supports government action to make food healthier. This support spans the political spectrum.
www.nesta.org.uk/blog/the-uk-...
A short 🧵 (1/6)
10.01.2025 08:58 — 👍 2 🔁 1 💬 1 📌 0
It's clear that the public support government intervention to make the food environment healthier. We know the impact that poor diet has on the nation's health. We also know that there are effective, evidence based policies that can address the issue.
It is time for the government to act. (6/6)
10.01.2025 08:58 — 👍 0 🔁 0 💬 0 📌 0
Interestingly, this support spans the political spectrum. In our poll, voters from the Conservative, Lib Dem, Labour, and Green parties backed every single policy. Reform voters even showed net support for five out of seven policies. (5/6)
10.01.2025 08:58 — 👍 0 🔁 0 💬 1 📌 0
Support for these types of interventions is remarkably consistent across polls conducted by different organisations. Nearly every policy in almost every poll receives net public support. (4/6)
10.01.2025 08:58 — 👍 0 🔁 0 💬 1 📌 0
We also surveyed over 2,000 people to gather their opinions on a range of policies aimed at making food healthier. The findings were clear: every single policy received net public support, meaning more people supported the policies than opposed them. (3/6)
10.01.2025 08:58 — 👍 0 🔁 0 💬 1 📌 0
We surveyed over 5,000 people, asking about their current weight and ideal weight. 67% expressed a desire to lose weight, aiming for an average reduction of 9.2kg. (2/6)
10.01.2025 08:58 — 👍 0 🔁 0 💬 1 📌 0
The UK wants to lose weight - and backs government action to make food healthier
Most of the public are concerned about their weight and support interventions that would improve the nation's health.
New analysis and polling from @nestauk.bsky.social — and my first blog for Nesta.
The UK wants to lose weight and supports government action to make food healthier. This support spans the political spectrum.
www.nesta.org.uk/blog/the-uk-...
A short 🧵 (1/6)
10.01.2025 08:58 — 👍 2 🔁 1 💬 1 📌 0

The UK wants to lose weight - and backs government action to make food healthier
Most of the public are concerned about their weight and support interventions that would improve the nation's health.
Politicians shouldn't be wary of regulating the food industry to help tackle obesity - the public backs government action.
Our latest research found that a majority of people want to lose weight and endorse government interventions - even across political divides.
09.01.2025 15:51 — 👍 19 🔁 6 💬 2 📌 1

The UK wants to lose weight - and backs government action to make food healthier
Most of the public are concerned about their weight and support interventions that would improve the nation's health.
Trying to lose a few pounds this January? You're not alone. @nestauk.bsky.social's latest research found that most of the UK public want to lose weight.
And most back government intervention to reduce obesity - from banning junk food ads to taxing sugar and salt.
www.nesta.org.uk/blog/the-uk-...
09.01.2025 15:50 — 👍 2 🔁 1 💬 1 📌 0

Project Manager
2-year fixed term contract
Salary: Up to £58,929 per annum plus excellent benefits
Application deadline: 6 January 2025, 23.59
CLOSING SOON: Do you have experience in setting up and managing large-scale change projects in a complex environment?
We are looking for a Project Manager to support the 'Our Future Foundation' programme.
Find out more and apply by 23.59 on 6 January ⬇️
https://buff.ly/3ZKRCbB
04.01.2025 22:19 — 👍 4 🔁 5 💬 0 📌 0
Hi Páraic, would love to be added. Working on the causal impacts of loneliness on health
30.12.2024 20:20 — 👍 1 🔁 0 💬 1 📌 0
Behavior change at scale, decision-making, meta-science, inequality, and a 'little bit' of happiness. Fulbright Alumn at Harvard & Columbia. Also leading the BS lab at ELTE.
Journalist writing on global health, development policy and finance, inequality. Also: the role of journalism, data, and science in an age of misinformation
📍 New Delhi, India, but often elsewhere
Tips, data, research papers -> cathedavison@gmail.com
Trans Europe Express (show AND pod!), H&J on @Talksport. @vftlpodcast Spurs pod via @theathleticuk. Ex-editor NME, Q. Fast and bulbous! Located: Kilkenny and the Canyons Of My Mind
We're a not-for-profit organisation working with communities towards an Australia free from alcohol harms.
RIC-KI connects researchers & scientists across the world for collaboration. Hosted by the Centre for Lifestyle Medicine and Behaviour, Loughborough University.
Join today: https://ric-ki.lboro.ac.uk/
The European Association for the Study of Obesity represents 40 European nations dedicated to understanding and addressing obesity to improve public health.
Evidence synthesis + behavioural science at UCL • population health • interventions • environments • unpopular culture • architecture (& morality) • "fun-sponge boffin" (Daily Star)
🔗 https://profiles.ucl.ac.uk/92345-gareth-hollands
🌍 London, UK
Behavioural Scientist. Sea swimmer. Bilingual (English & Spanish). My cat’s name is Rutilia, Ruti to friends.
A bit more about me: https://lourdesvalenciatorres.com/
Behavioural Research Unit at ESRI & Trinity College Dublin School of Psychology. All views my own. Our lab page is: http://esri.ie/bru
Journalist writing for New Scientist, Nature, Live Science and Scientific American. Formerly an editor at New Scientist and Nature.
Selection of articles here: https://www.newscientist.com/author/chris-simms/
Comms @EuroHealthNet. Passionate about health and social equity. Frustrated with the status quo. Dutchie in Madrid 🇪🇸 Crochet enthusiast/newby 🧶
A European partnership of public health bodies working to reduce health inequalities and improve health and wellbeing for all.
At wired.com where tomorrow is realized || Sign up for our newsletters: https://wrd.cm/newsletters
Find our WIRED journalists here: https://bsky.app/starter-pack/couts.bsky.social/3l6vez3xaus27
The Association for the Study of Obesity (ASO) is the UK’s foremost charitable organisation dedicated to the understanding, prevention and treatment of obesity.
Health inequalities, inclusive economies, devolution, employment & welfare
@healthfoundation.bsky.social
Previously working on disability, social care & carers policy
Voted best rebounder at my local basketball game with 80 percent of the vote, December 2022
Assistant Professor of Psychology at Duke University studying kids & culture. Director of the Mind & Culture Lab. Mom x3. Some people just want to watch the world learn.
dorsaamir.com | mindandculturelab.com
Lecturer of Public Health @ Newcastle University in NE England
Chair, Trade & Health Forum, @aphapublichealth.bsky.social
Health equity, macroeconomics, international trade, social determinants of health, commercial determinants of health