We will release the full data record with the new version in regular processing mode in a few days. The v300 files that are already on the ftp server are from the near real-time processing mode. These are released faster, but have small differences to the regular products.
01.12.2025 08:57 — 👍 4 🔁 0 💬 0 📌 0

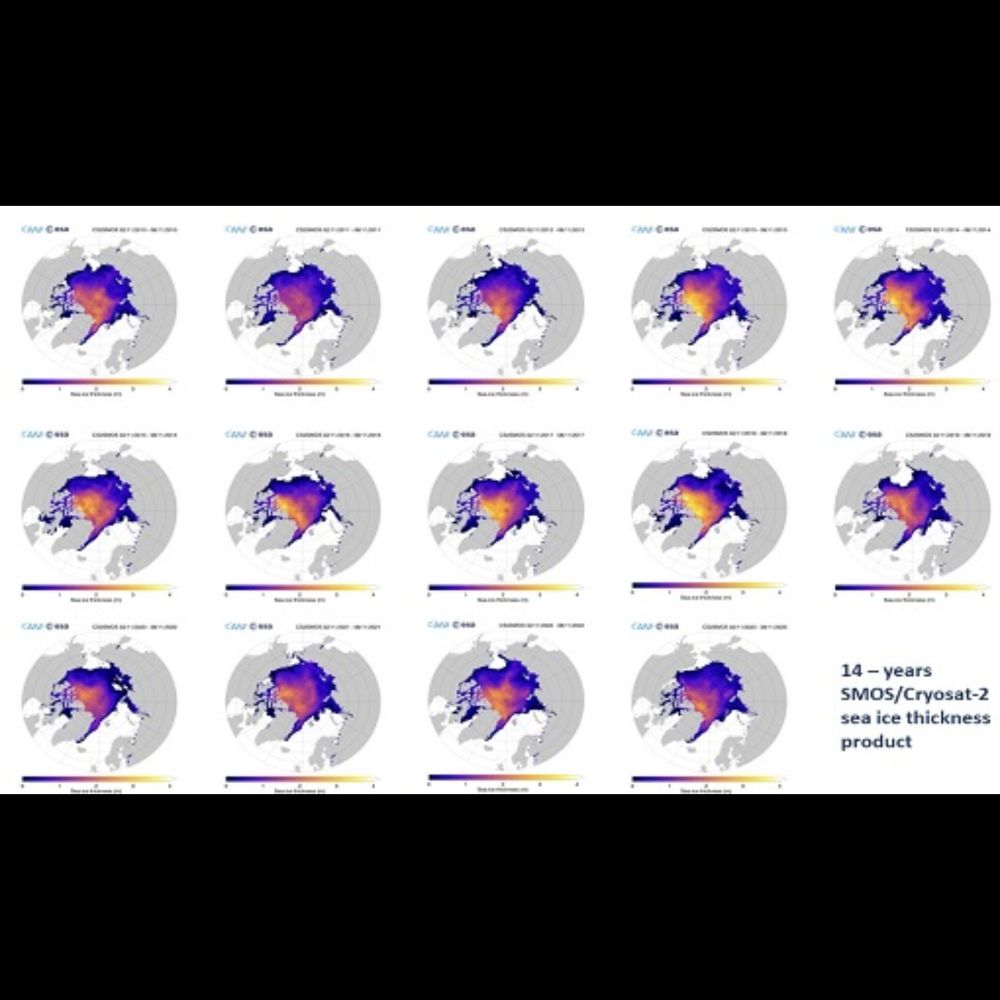
Sea ice thickness from CryoSat-2/Sentinel-3/SMOS in the northern hemisphere from October 15 to October 21, 2025 (near real-time processing)
Operational processing of the Level-4 (L4) CryoSat-2/Sentinel-3/SMOS (CS3SMOS) sea ice thickness product has been started for the Arctic 2025/26 winter season. The product version has seen a major upgrade from v206 to v300.
#Arctic #Climate @esaclimate.bsky.social
spaces.awi.de/spaces/CS2SM...
23.10.2025 16:16 — 👍 8 🔁 2 💬 0 📌 0
A new satellite approach tracks drifting Arctic sea ice, giving us clearer, more accurate maps of ice thickness. 🛰 A useful step for monitoring climate change in the polar regions. Read more: climate.esa.int/en/news-even...
16.09.2025 13:42 — 👍 16 🔁 9 💬 0 📌 0
It is truly the last look at the CryoSat-2/SMOS (CS2SMOS). In October we will continue with CryoSat-2/Sentinel-3/SMOS (CS3SMOS) in the #Arctic. CS3SMOS will also be generated for #Antarctic #seaice.
22.04.2025 12:24 — 👍 5 🔁 0 💬 1 📌 0
The @copernicusecmwf.bsky.social and @wmo-global.bsky.social European State of the Climate Report is launched today
🌐 more than 40 datasets
👩🔬 over 100 scientists
🗺️ > 130 charts and graphics
Check it out: climate.copernicus.eu/ESOTC
🌏🌡️🧪⚒️🌊🛰️
15.04.2025 05:19 — 👍 132 🔁 62 💬 2 📌 4
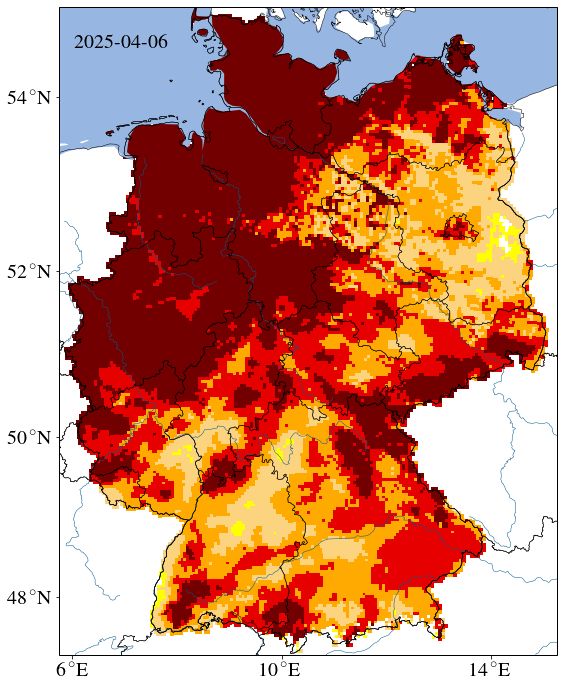
Map of German draught monitor showing "exceptional draught" in all over northern germany
Urgh, that looks unpleasant. I could well use some of this water here. Our garden is already in need of watering since March due to "exceptional draught"
map: UFZ Drought Monitor / Helmholtz Centre for Environmental Research.
08.04.2025 10:12 — 👍 2 🔁 0 💬 1 📌 0
Happy launch day anniversary 🥳
Btw, any chance that @esa_cryosat moves over here?
08.04.2025 10:02 — 👍 2 🔁 0 💬 0 📌 0
🎈🎈🎈🎈🎈🎈🎈🎈🎈🎈🎈🎈🎈🎈🎈
08.04.2025 09:56 — 👍 5 🔁 0 💬 0 📌 0
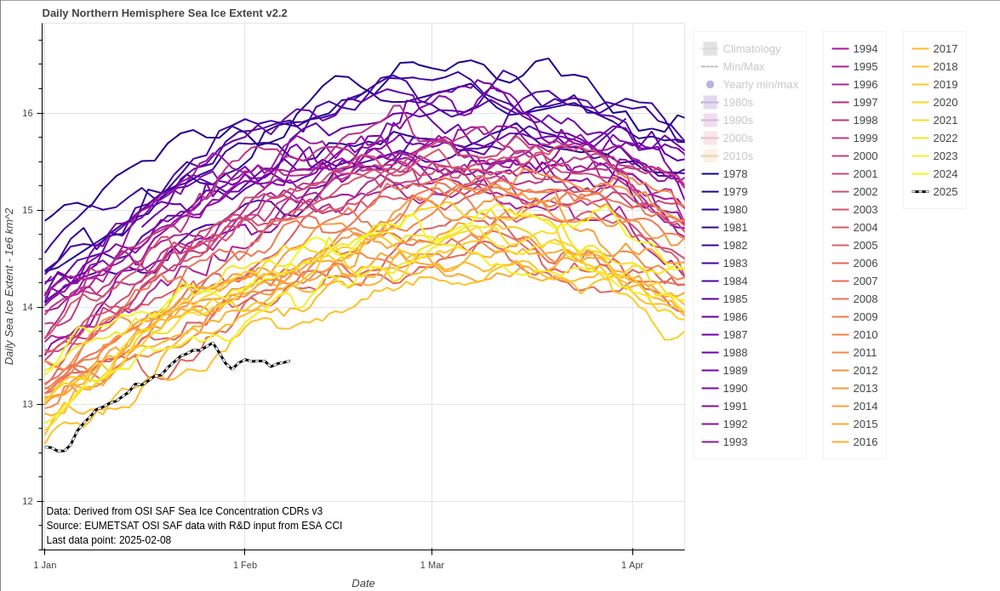
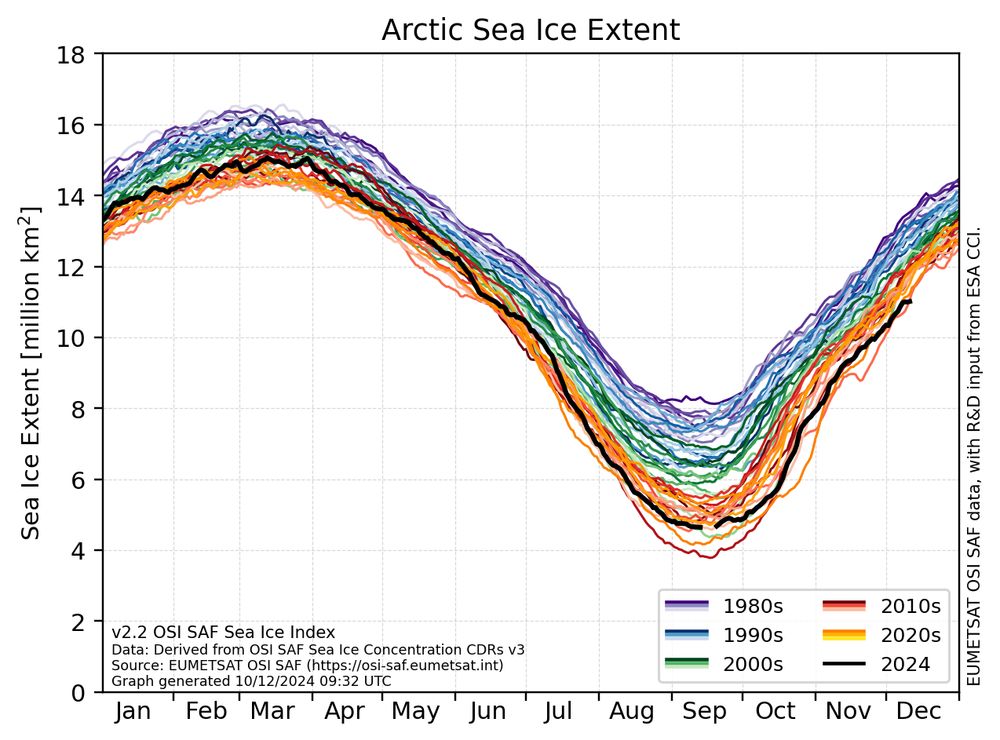
Line graph showing the daily sea-ice extent for the Arctic from 1978 to the present time in 2025. 2025 is shown in the thick black line to the left, while the previous years are presented in plasma colormap with the earliest years in purple and most recent years in yellow'ish. Since January 27th, the normal winter increase in sea-ice extent has completely stopped. Arctic ice extent is now record low and significantly lower than previous years.
Data source is the OSI SAF sea-ice index v2.2.
The full stop of the increasing winter sea-ice extent in the Arctic has now lasted for two weeks...
🌊⚒️🧪🥼❄️
10.02.2025 07:51 — 👍 119 🔁 71 💬 5 📌 10
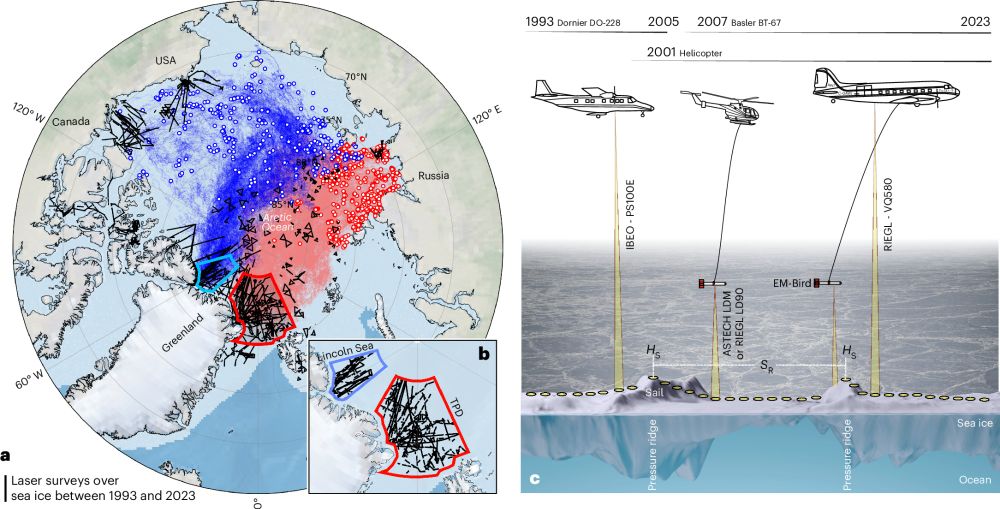
Smoother sea ice with fewer pressure ridges in a more dynamic Arctic
Nature Climate Change - Pressure ridges, a characteristic feature of Arctic sea ice, play an important role in the ecosystem but pose challenges to shipping. Here the authors use aircraft...
Sea ice paper alert, congratulations to my colleagues!
Krumpen, T., von Albedyll, L., Bünger, H.J. et al. Smoother sea ice with fewer pressure ridges in a more dynamic Arctic. Nat. Clim. Chang. (2025). doi.org/10.1038/s415...
#Arctic #climate 🌊 🥼❄️
rdcu.be/d5rtv
06.01.2025 18:51 — 👍 35 🔁 16 💬 0 📌 2
I could go on and on with this. There are so many logistical challenges that I don't think this project will ever be applied on the large scale in the central Arctic. I only see possibilities for to apply this locally, e.g. strengthen regions where sea ice is used for travelling.
13.12.2024 09:19 — 👍 2 🔁 0 💬 0 📌 0
The test on landfast sea ice is also wildy optimistic. Actual drift ice has a lot more topography, and the affected area will be smaller. They will also loose a lot of these pumps due to sea ice deformation.
13.12.2024 09:15 — 👍 1 🔁 0 💬 1 📌 0
This reseeding will also be needed mostly in the Russian exclusive economic zone. Anyone thinks it is likely that there will be a permission to visit this area with > 100000 autonomous vehicles every year?
13.12.2024 09:10 — 👍 1 🔁 0 💬 1 📌 0
The entire concept seems to be completely oblivous of the fact that sea ice does not stay in one place. A good portion of it ends up in the North Atlantic where it will melt no matter how thick it is. This means constant reseeding of 100`000s of square kilometers within months only.
13.12.2024 09:06 — 👍 1 🔁 0 💬 1 📌 0
Line graph showing the daily sea-ice extent for the Arctic for the period 1978 to 2024. 2024 is shown in black while the previous years are shown in decadal-grouped colors. Most recent observations from December 2024 show record-low ice extent for this time of the year.
Data source is the OSI SAF sea-ice index v2.2.
Sea-ice extent in the Arctic just took a sharp turn and is now located in "record-low for this date" region 📉
🌊🧪⚒️
11.12.2024 11:07 — 👍 116 🔁 33 💬 6 📌 5
Newly created starter pack for Polar Oceanography 🌊❄️
My follow list is far from complete, so let me know if I have missed you/someone else you think should be included!
go.bsky.app/851nQgx
09.11.2024 16:02 — 👍 38 🔁 19 💬 6 📌 1
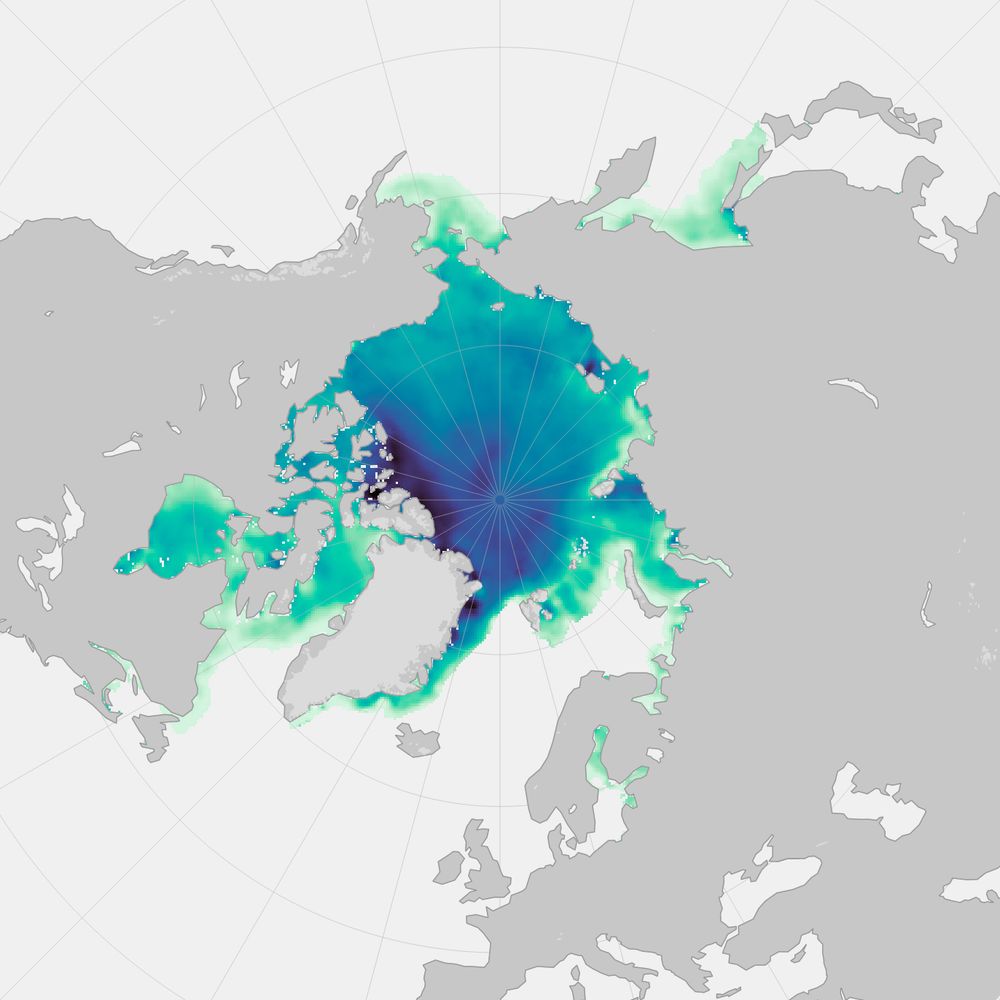
North pole view of Arctic sea ice thickness from March 8–15 2024, measured by SMOS & Cryosat-2. Thickness ranges from 0.04 (light green) to 4 meters thick (dark blue). The thickest ice is concentrated along the coast of Arctic Canada and Greenland.
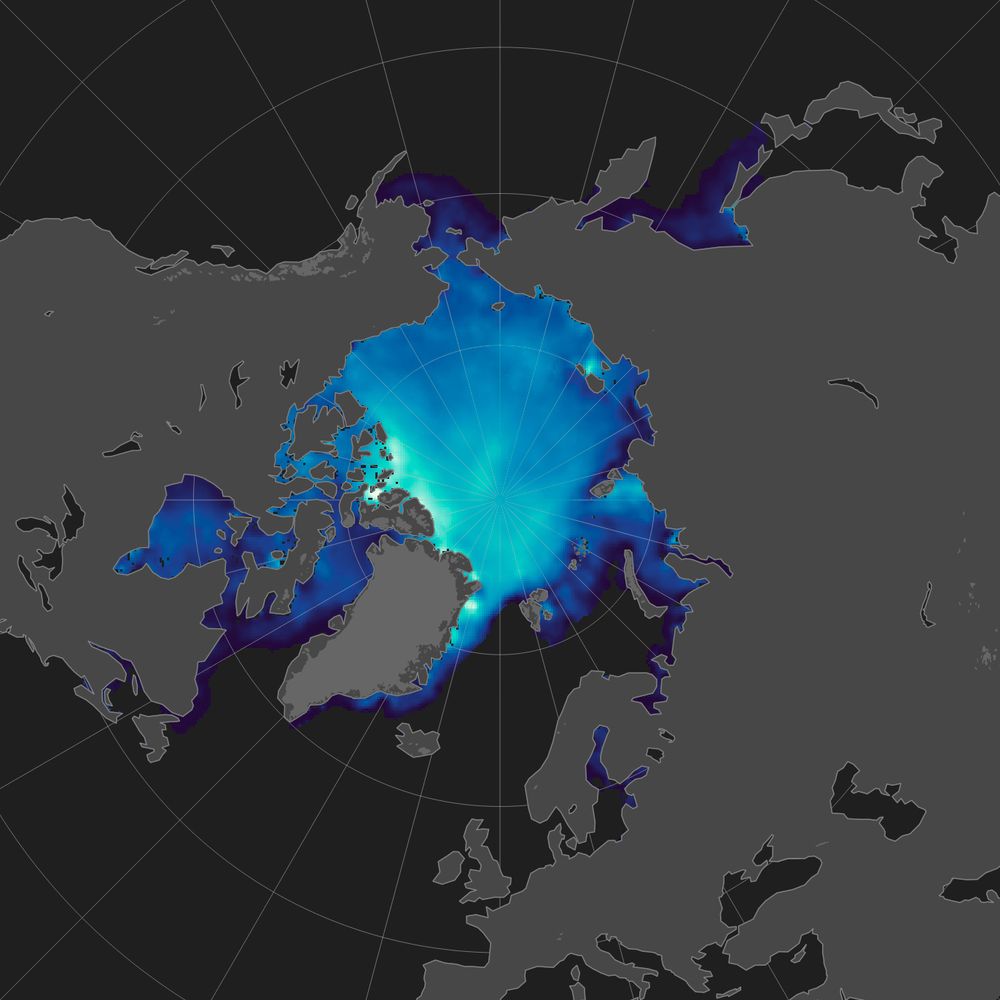
North pole view of Arctic sea ice thickness from March 8–15 2024, measured by SMOS & Cryosat-2. Thickness ranges from 0.04 (dark blue) to 4 meters thick (light green). The thickest ice is concentrated along the coast of Arctic Canada and Greenland.
Light or dark mode?
26.07.2024 00:09 — 👍 4 🔁 1 💬 4 📌 0
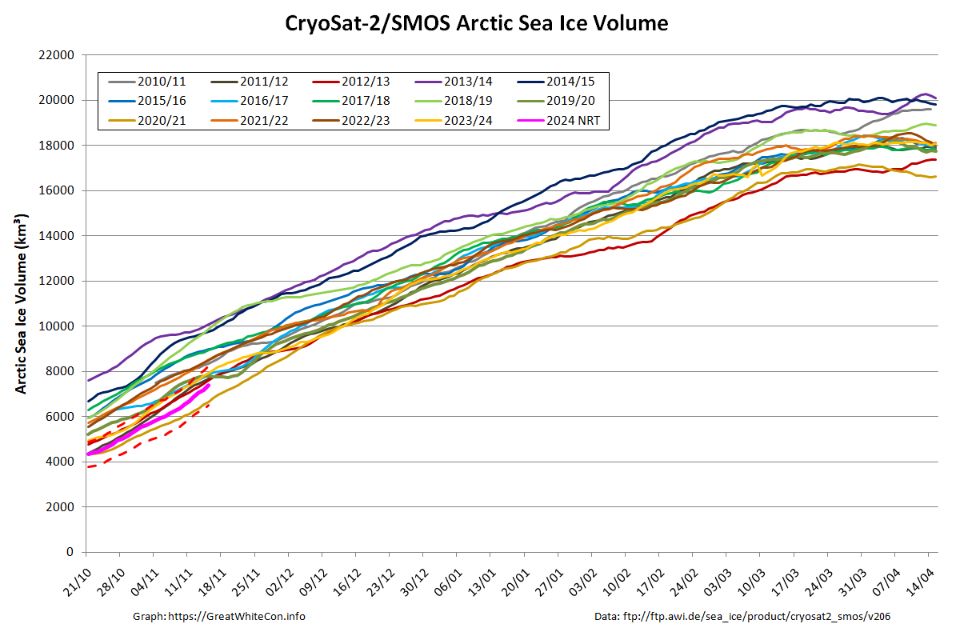
CryoSat-2/SMOS merged Arctic sea ice volume graph on November 15th 2024
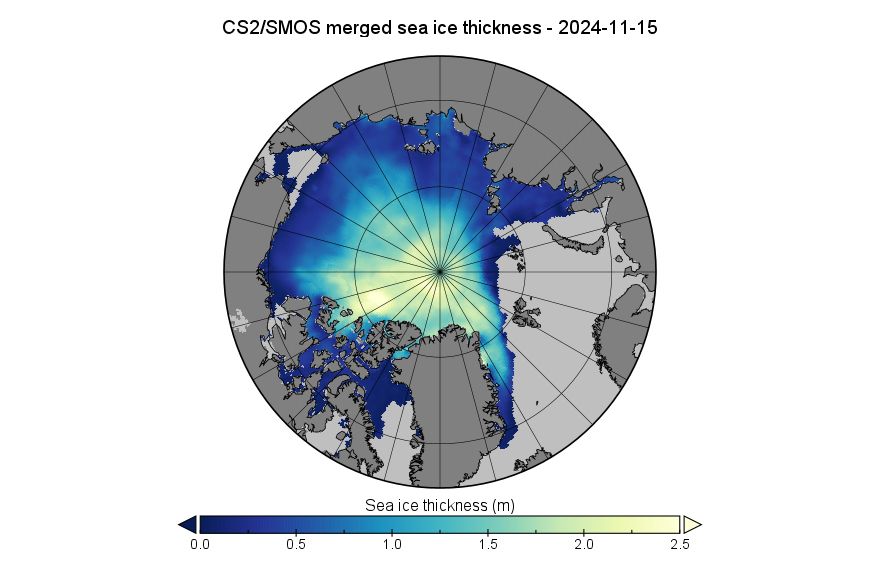
CryoSat-2/SMOS merged Arctic sea ice thickness map on November 15th 2024
Here's our mid month update on #CryoSat2/#SMOS merged #Arctic #SeaIce thickness and volume:
greatwhitecon.info/2024/11/fact...
18.11.2024 13:12 — 👍 8 🔁 3 💬 0 📌 0
They now exist.
Marine biogeochemistry
go.bsky.app/TK79r4w
Polar ocean
go.bsky.app/851nQgx
Physical oceanography
go.bsky.app/Eb6xX19
Sea level and coastal erosion
go.bsky.app/B6spBdu
09.11.2024 19:02 — 👍 114 🔁 66 💬 20 📌 11
Find your #remotesensing buddies here 💓
go.bsky.app/4PMRhNL
10.11.2024 22:10 — 👍 25 🔁 18 💬 2 📌 0
Some good news: The Advisory Committee for Earth Observation (ACEO) has recommended extending the SMOS mission until the end of 2028, alongside CryoSat-2 and SWARM. ❄️🧊🛰️
11.11.2024 08:19 — 👍 19 🔁 9 💬 0 📌 0
Just started a starter feed listing Arctic and Antarctic communicators already on Bluesky
...please let me know who else to add & apologies to all I've missed - just let me know and I'll sort it
go.bsky.app/7RL1i9C
08.11.2024 05:38 — 👍 44 🔁 24 💬 9 📌 4
Welcome
@berkeleylabemp.bsky.social
@miamirosenstiel.bsky.social
@miamiresilience.bsky.social
@climatereefs.bsky.social
@ficlima.bsky.social
to my starter pack of research organizations, centers and departments that bring folks together to tackle climate.
Click here to follow some or all:
07.11.2024 14:07 — 👍 296 🔁 97 💬 24 📌 9
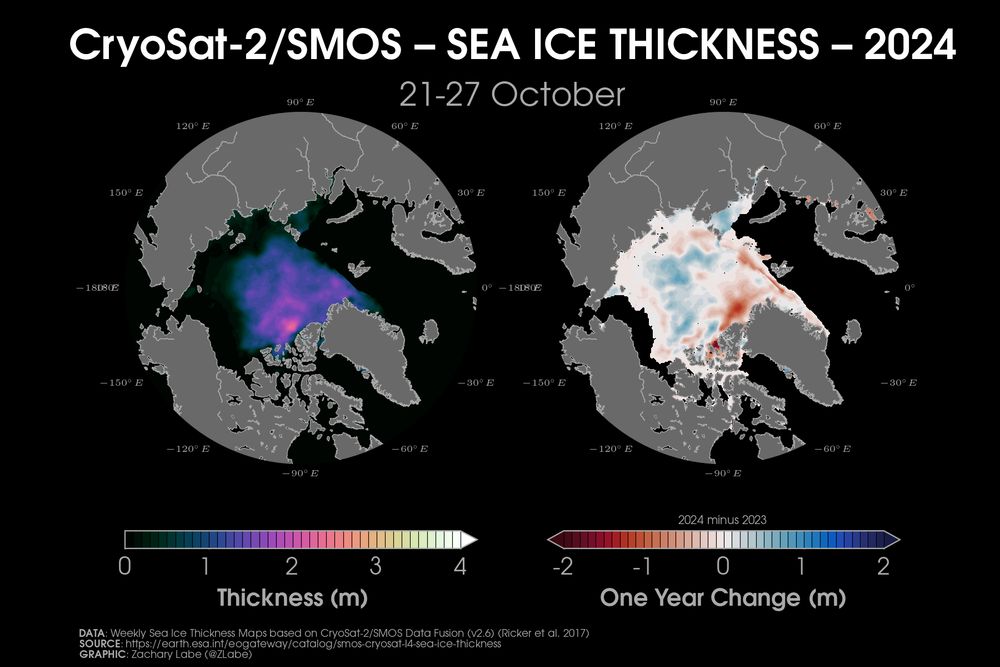
Two polar stereographic maps showing Arctic sea ice thickness from CryoSat-2/SMOS and the difference relative to the previous year (October 2023). Ice is thinner than last year toward Greenland.
A first look at the CryoSat-2/SMOS merged product for #Arctic sea ice thickness this fall. Now looking after the melt season, we see thinner ice north of Greenland relative to last year and thicker in the Central Arctic.
This graphic will now be updated weekly at zacklabe.com/arctic-sea-i... 🌊⚒️
29.10.2024 11:57 — 👍 34 🔁 16 💬 0 📌 0
I can see very localized benefit where sea ice is used for transportation etc. But "saving sea ice" requires deploying millions of these pumps every winter for decades mainly in the Russian exclusive economic zone. Nothing but a pipe dream.
25.09.2024 09:09 — 👍 3 🔁 1 💬 1 📌 0
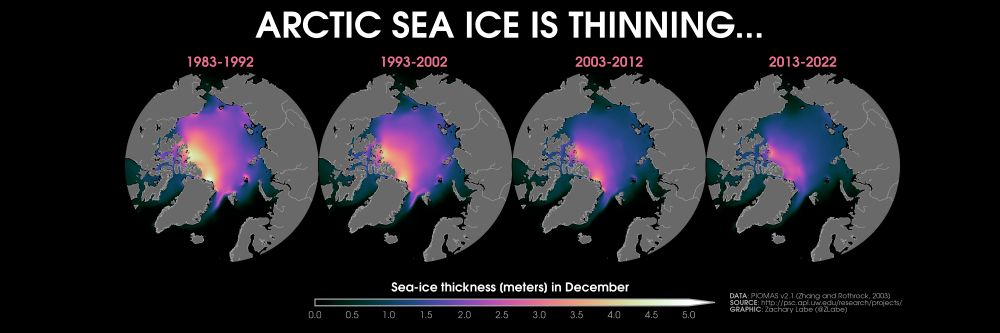
Four polar stereographic maps showing Arctic sea ice thickness for the month of December in 1983-1992, 1993-2002, 2003-2012, and 2013-2022. Thickness is shown with colors from black at 0 meters to purple at 2.5 meters to white at 5.0 meters. Sea ice in thinning in all regions over time.
The disappearance of thicker Arctic sea ice by decade in December... 🧊📉
More info on data: climatedataguide.ucar.edu/climate-data...
11.12.2023 19:19 — 👍 20 🔁 10 💬 0 📌 0
Life beyond the leak for ESA’s CryoSat
And with this good news for CryoSat-2 (and the SMOS mission extension) to many more years!
www.esa.int/Enabling_Sup...
05.12.2023 08:43 — 👍 0 🔁 0 💬 0 📌 0
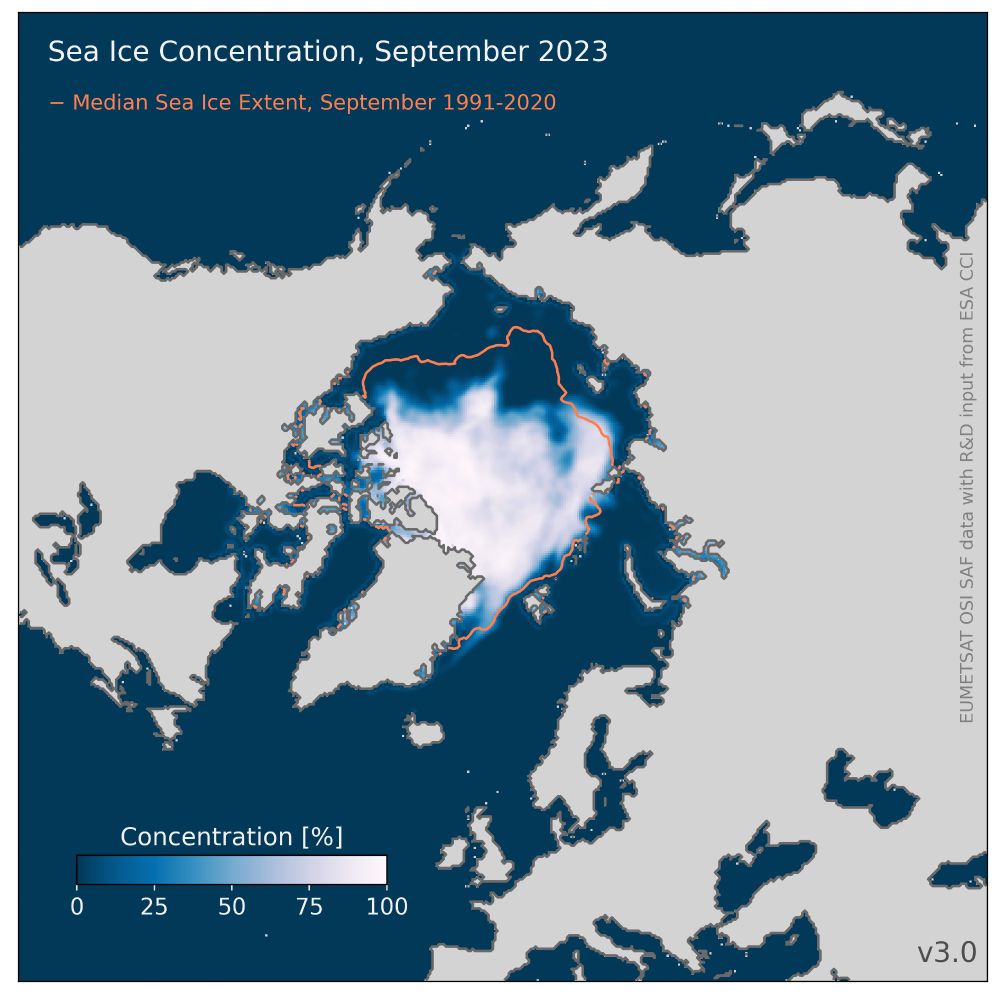
Map showing the Arctic sea-ice concentration averaged over November 2023. For comparison, the mean November sea-ice extent for the period 1981-2010 is represented by an orange contour.
Source data is OSI SAF sea-ice concentration CDR v3.0
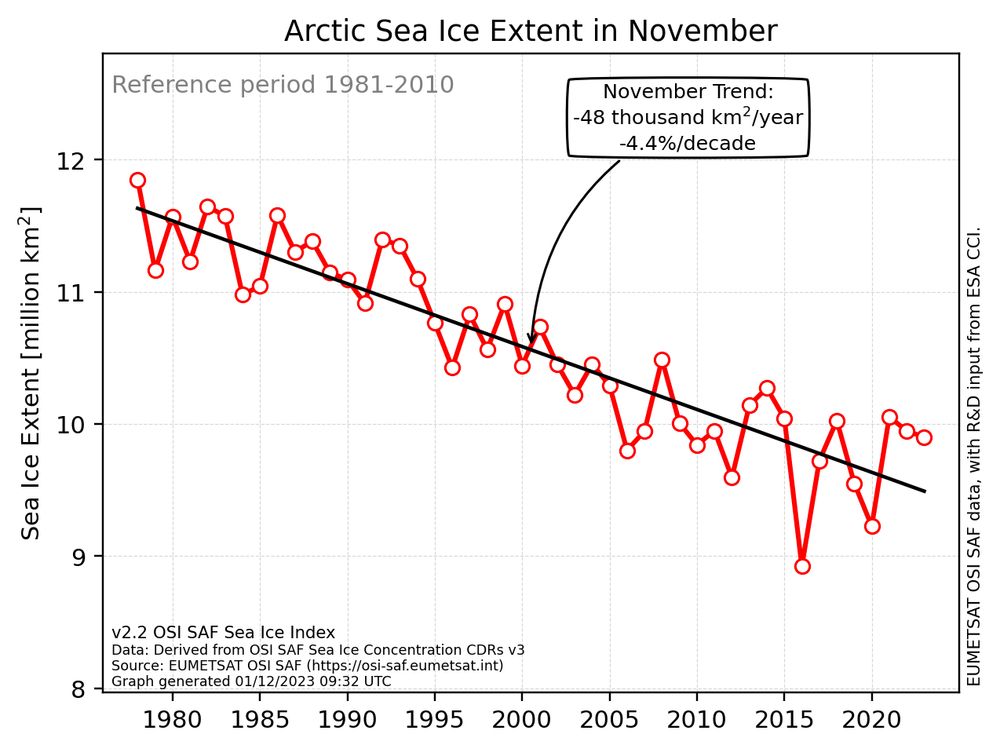
The line graph displays the sea-ice extent in the Arctic for the month of November from 1978 to 2023. In 2023, the extent was below average, ranking as the eighth lowest.
Data source is the OSI SAF sea-ice index v2.2.
Arctic sea ice in November 2023:
- The extent of Arctic ice for this month is the 8th lowest on record.
- The ice has shifted north in most areas, except in the Greenland Sea where there is an above-average amount of ice for November.
🧪⚒️
01.12.2023 10:37 — 👍 9 🔁 4 💬 1 📌 2
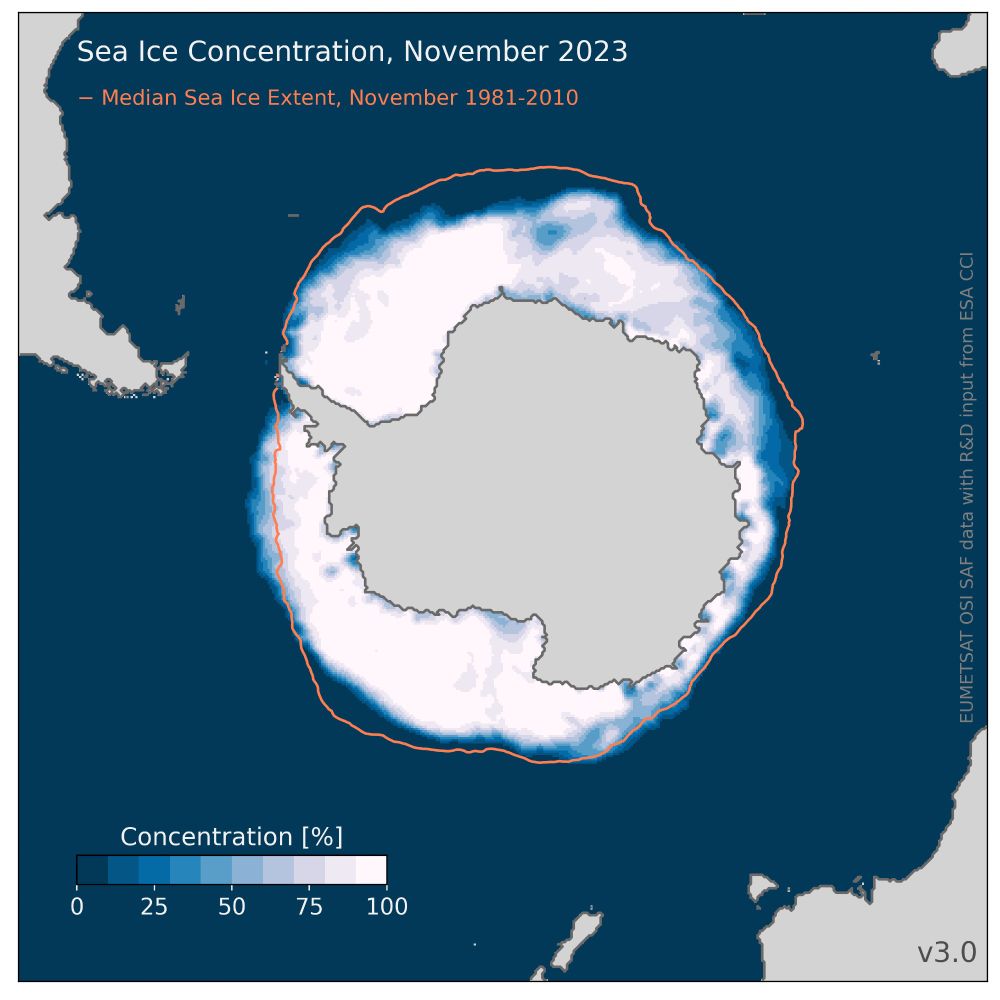
Map showing the Antarctic sea-ice concentration averaged over November 2023. For comparison, the mean November sea-ice extent for the period 1981-2010 is represented by an orange contour.
Source data is OSI SAF sea-ice concentration CDR v3.0
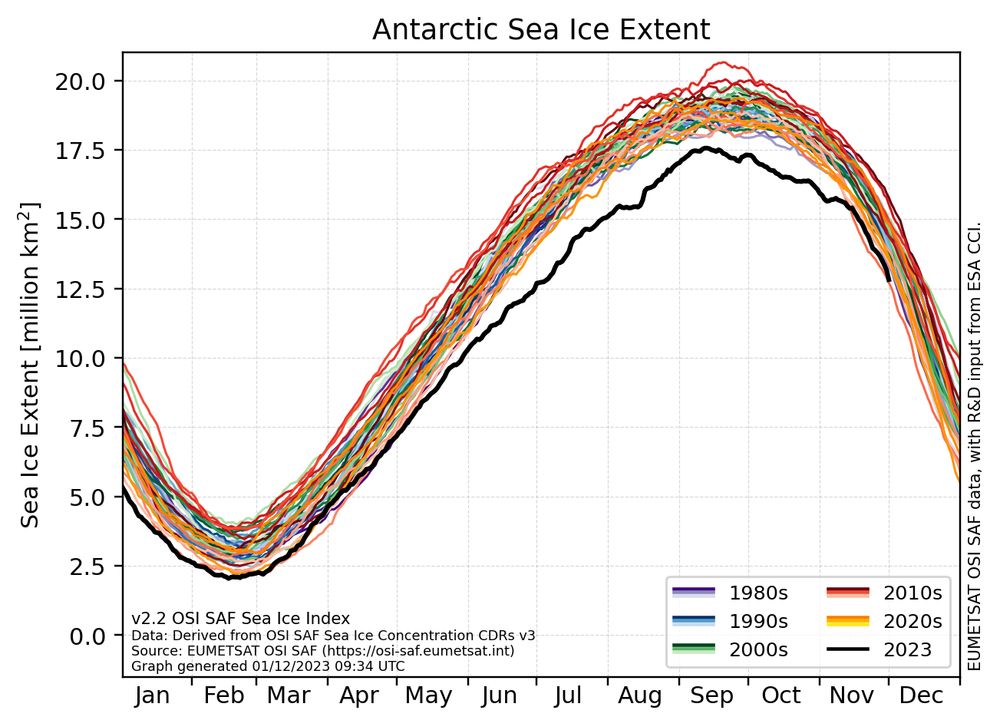
Line graph showing the daily sea-ice extent for the Antarctic for the period 1978 to 2023. 2023 is shown in black while the previous years are shown in decadal-grouped colors.
Data source is the OSI SAF sea-ice index v2.2.
What a winter season in the Antarctic!
For November 2023, the ice extent was "only" second-lowest on record.
Ice is missing especially in the Ross and Weddell Sea.
⚒️🧪
01.12.2023 10:52 — 👍 13 🔁 4 💬 0 📌 1
Director of Science, @esa.int; Head of the European Space Astronomy Centre, Madrid. Astrophysicist, science diplomat, ex-Science Council President; ex-Chief Scientist Adviser & International Science Envoy, UK FCDO. She/her. My views.
Maintained by ESA's Space Weather Coordination Centre providing information on the ESA Space Weather Network. No services provided via this account.
Spatial Data Science, Earth Observation, Machine Learning 🌍🛰️⚙️ Animal-Environment Interactions Modelling, Sat./UAV Remote Sensing for Ecology.
Researcher & Lecturer @earth-observation.org, @uni-wuerzburg.de, #AniMove.
https://jakob.schwalb-willmann.de
Engineer & Researcher in Satellite Sensing |
Exploring Multispectral and Hyperspectral Imaging, Applied Deep Learning and Ocean Remote Sensing | HCI hobbyist
Keeping Europeans up to date, all over the continent.
Join us by signing up for our daily newsletter: https://t.co/NHyIqg602P
Geophysics at University of Tübingen | ice and geophysical research by friendly people ❄️ https://uni-tuebingen.de/de/147603
Politik, Medien & Sonstiges | Kein ORF-Account | Blog: arminwolf.at | Foto: Peter Rigaud
On a mission to make software development a more productive and enjoyable experience. Make it happen. With Code.
The only Python IDE you need. Built by @jetbrains.com, part of @jetbrains4data.com
Die einzige nur von Björn Höcke anerkannte Terrororganisation. Werde jetzt Kompliz:in! Wir machen für Dich Stress und radikalen Humanismus: https://werde-komplizin.de
SOCCOM’s mission is to drive a transformative shift in the scientific and public understanding of the role of the vast Southern Ocean in climate change and biogeochemistry.
https://soccom.princeton.edu/
An extension of the Argo program to include biogeochemical observations
https://biogeochemical-argo.org/
Ocean scientist building a global biogeochemical sensor array to observe ocean health and changes in chemical cycling. http://soccom.org, https://go-bgc.org
Bundeszentrale für politische Bildung/bpb. Unser Auftrag seit 1952: Demokratie stärken - Zivilgesellschaft fördern. Ihr habt Fragen zu Politik & Gesellschaft? Wir antworten: hier oder info@bpb.de // bpb.de
Climate scientist, director ICARUS Climate Research Centre, Maynooth University, Ireland, author IPCC AR6, member Ireland's climate change advisory council, Chair GCOS AOPC. www.peter-thorne.net
PolarRES (2021–2025) was a Horizon 2020 project exploring the future climates of the polar regions.
Discover all the resources we produced at: https://polarres.eu/
Developing Ocean-Atmosphere Coupled Data Assimilation at #ECMWF to make your weather forecasts better.
Expect some sharing of good dogs here too
[bridged from https://fediscience.org/@phil_browne on the fediverse by https://fed.brid.gy/ ]
Signal is a nonprofit end-to-end encrypted communications app. Privacy isn’t an optional mode, it’s the way Signal works. Every message, every call, every time.
President of Signal, Chief Advisor to AI Now Institute