Even more upsetting was when they said they'd love to share the data but they'd lost it because it wasn't archived or retained.
23.06.2025 08:15 — 👍 1 🔁 0 💬 0 📌 0
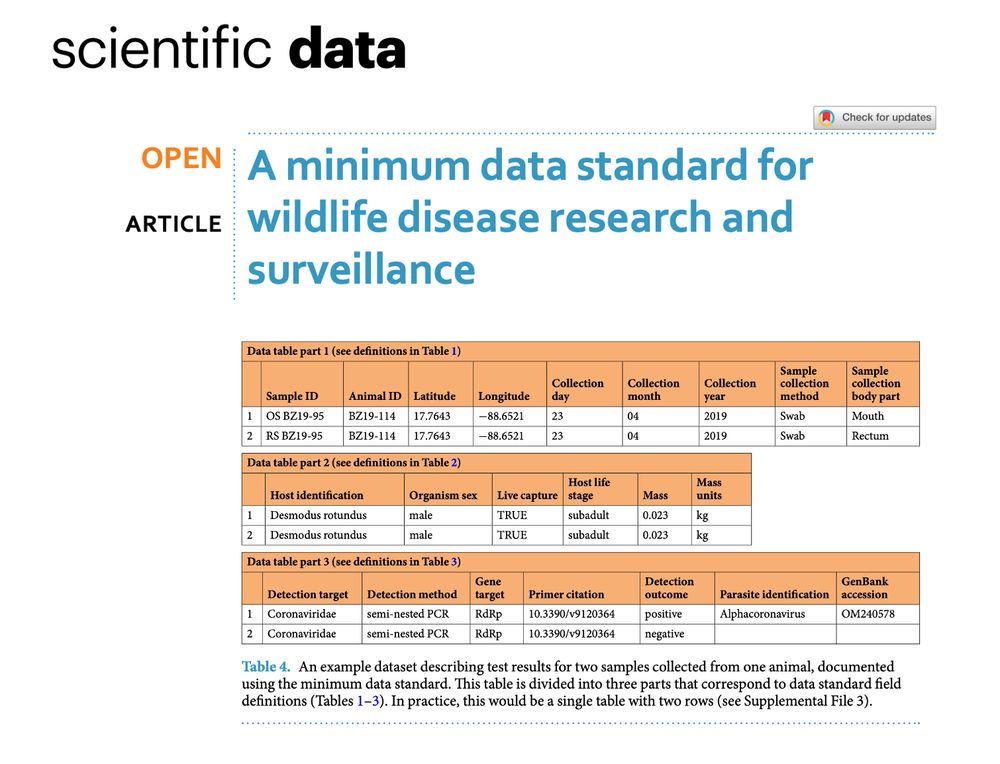
The title of the paper: "A minimum data standard for wildlife disease research and surveillance" - and an example data table
NEW! 🎉 We need wildlife disease surveillance to predict epidemics, but data sharing is rare - we found that only 2-3% of studies share raw data. So, we spent three years developing a data standard and R package to help get wildlife disease data into FAIR repositories. www.nature.com/articles/s41...
21.06.2025 15:17 — 👍 129 🔁 49 💬 3 📌 4
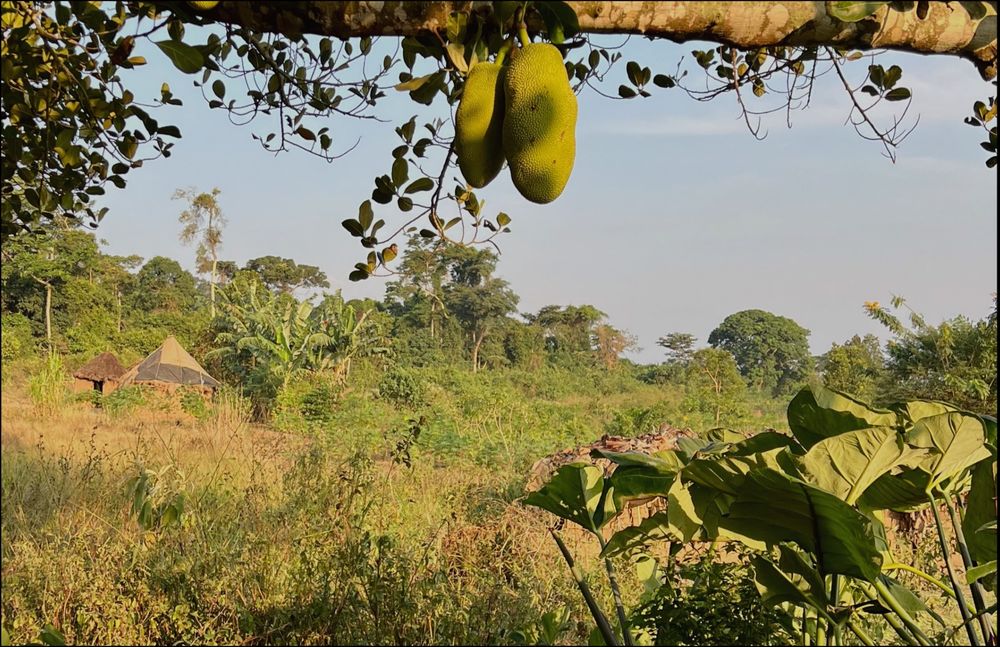
📣 We’re hiring! 2-yr postdoc at Smithsonian’s NZCBI on an NSF-funded project with partners incl. Glasgow, RVC, Uganda MOH, Cary Institute. Focus: land use change, rodent movement, human-rodent contact, modeling disease risk, w/ plenty of fieldwork in Uganda. Details: tinyurl.com/SINSFR
26.04.2025 10:05 — 👍 3 🔁 3 💬 0 📌 1
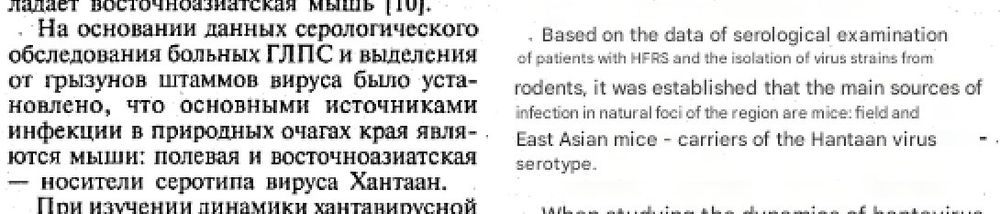
Machine translation from original russian text.
Are any #Russian speakers are able to assist with this. Translation is from Google Translate does the original Russian state the species name or are they describing them similarly?
30.01.2025 14:31 — 👍 1 🔁 0 💬 0 📌 0
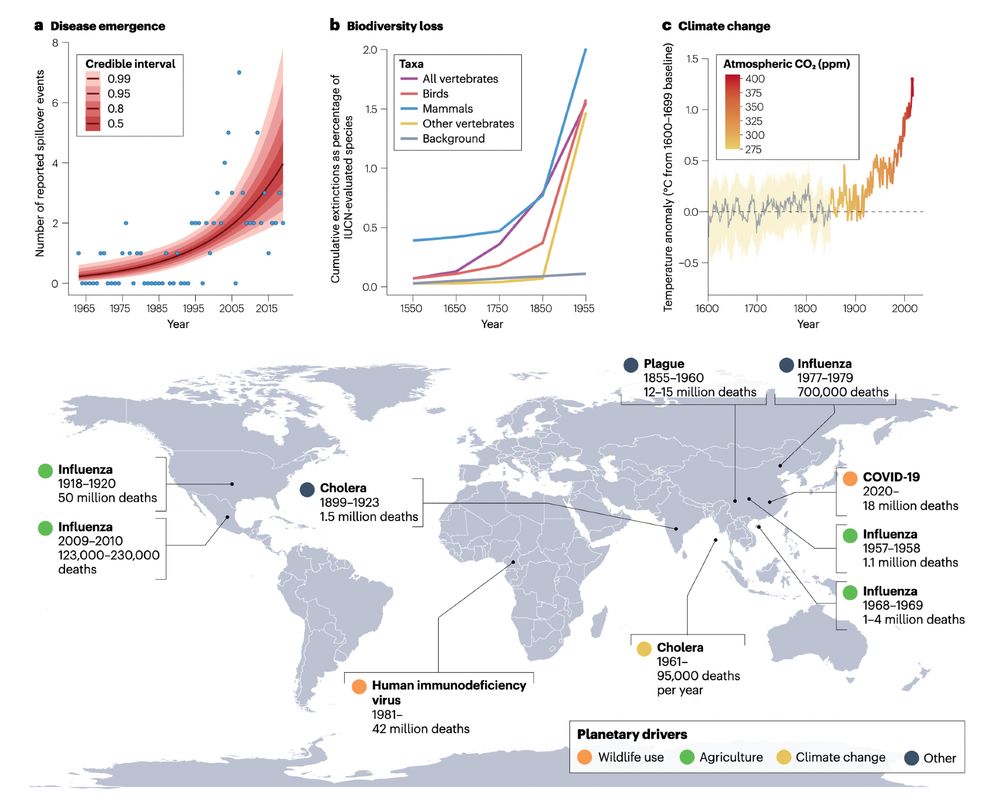
Top panels: graphs showing increases in spillover events, extinction rates, and temperature anomalies over the last few centuries. Bottom panel: a map of 10 pandemics since the year 1900. Four were linked to agriculture, two to wildlife use, and one to climate change.
🚨😷🧪 NEW: A growing body of evidence shows that pandemics, biodiversity loss, and climate change are part of a broader polycrisis - but there are no simple solutions. A sweeping overview of "Pathogens and planetary change" for the first issue of @natrevbiodiv.bsky.social, out now 🔓 rdcu.be/d6lHl
15.01.2025 14:16 — 👍 544 🔁 229 💬 17 📌 19
We work on planetary problems. Currently: counting climate change-related deaths; pandemic risk assessment in a changing biosphere; data, science, and vaccine access during public health emergencies. 👉 carlsonlab.bio
MS Geography | University of Florida |Medical Geographer
PhD in Environmental Health Sciences 🌿 Infectious Disease Eco-Epidemiology 🌿One Health 🌿 Environmental Justice
🦠 Yale-based, NSF-funded Institute for pandemic prediction.
💻 How we do it: data, biology, AI, and team science.
⚖️ Why we do it: scientific discoveries and global health security.
➡️ See more at viralemergence.org.
Disease Ecology | Epidemiology | OneZoo PhD Student | LSHTM and NHM
Evolutionary and comparative physiology, parasitic and vector-borne diseases, advocate and ally for DEI, BLM, LGBTQIA+, health and healthcare are human rights, FFRF member, proud to be 💙 💙💙#fuckcancer #indivisible
Vector-borne disease modelling in humans, animals and plants at UKCEH (https://bsky.app/profile/ukceh.bsky.social). Currently working on mosquitoes 🦟, ticks 🕷️ and Xylella fastidiosa 🦠.
Applied mathematical modeller at Biomathematics and Statistics Scotland working on a variety of parasites (mainly gastrointestinal nematodes), vectors (mainly mosquitoes) and sometimes I dabble in Bayesian inference (currently avian influenza in seabirds).
landscape disease ecologist @uofgsbohvm.bsky.social
science journalist. author. molecular biologist. curious.
interested in #microbes, #misinformation and all things #blue
contributing correspondent at @science.org
co-host of @pandemia.bsky.social
2024 KSJ fellow at MIT
Signal: kakape.93
Virologist, into emerging viral infections, one health, climate and health. Head viroscience department ErasmusMC, Rotterdam NL. Backup for the ex-bird platform. ORCHID 0000-0002-5204-2312; https://pure.eur.nl/en/persons/marion-koopmans .
Infectious diseases & genomics. Immunologist in (voluntary) exile. Minimal sarcasm. Fierce HOA (Hater of Acronyms). Personal account - opinions expressed are my own and not those of my employer.
Almost certainly one of the ecologists of all time.
AI/ML, biodiversity monitoring, viral emergence, open science, methodological anarchism
he/they
🧪 https://poisotlab.io/
📰 https://buttondown.email/ctrl-alt-tim
Disease ecologist, Cary Institute of Ecosystem Studies. Zoonotic disease, predictive analytics, machine learning, AI. www.hanlab.science.
Infectious disease epidemiologist, mathematical modeling ... and Lucy's person.
Director, Center for Infectious Disease Dynamics (@ciddpsu.bsky.social) at Penn State
theferrarilab.net
Disease ecologist and wildlife pathologist studying impacts of anthropogenic environmental change on infectious diseases. Music, nature, and art lover. She_her_hers
Scientist. Director of AI + Life Sciences and Professor of Public Health Sciences at Northeastern University. External Faculty at the Santa Fe Institute and Vermont Complex Systems Institute. scarpino.github.io
UW biology prof.
I study how information flows in biology, science, and society.
Book: *Calling Bullshit*, http://tinyurl.com/fdcuvd7b
LLM course: https://thebullshitmachines.com
Corvids: https://tinyurl.com/mr2n5ymk
I don't like fascists.
he/him