@mikehoney.bsky.social might have thoughts?
11.04.2025 06:08 — 👍 2 🔁 0 💬 1 📌 0
Yes, watching with interest and hoping no new variant takes off. Aged care metrics were creeping up last few weeks but dropped down a bit today. Certainly a relief to be hovering at low levels but with low vax rates this "break" might be short-lived. I find it hard to make a call on broad immunity!
11.04.2025 06:08 — 👍 1 🔁 0 💬 1 📌 0
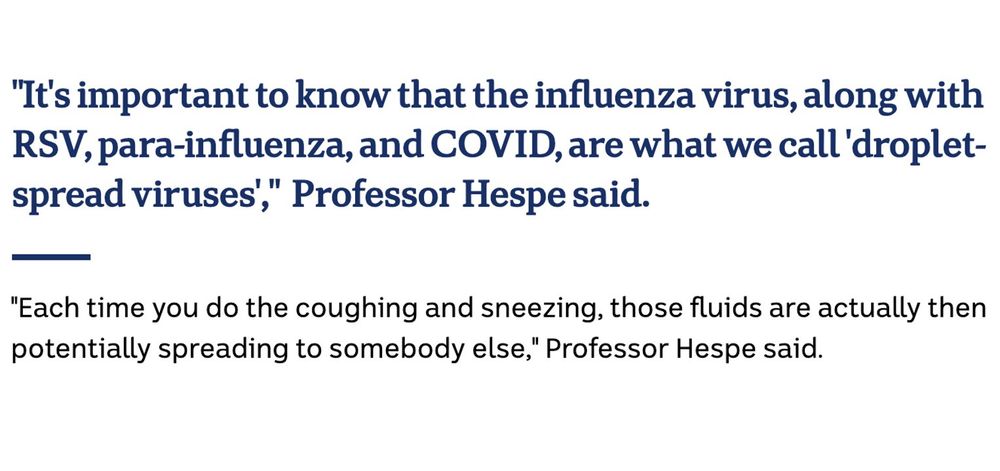
"It's important to know that the influenza virus, along with RSV, para-influenza, and COVID, are what we call 'droplet-spread viruses'," Professor Hespe said.
"Each time you do the coughing and sneezing, those fluids are actually then potentially spreading to somebody else," Professor Hespe said.
Oh come on @samjnichols.bsky.social ABC News. When reporting on important health topics, you need to get the basic facts right.
The person you quote on droplet spread of covid and flu etc is dead wrong.
abc.net.au/news/2025-04...
🧵
03.04.2025 01:22 — 👍 36 🔁 11 💬 4 📌 1
That would make sense. Thanks Mike.
25.03.2025 11:52 — 👍 2 🔁 0 💬 0 📌 0
Cases are always around, that's for sure. Some people do question the wastewater data but I've not seen any real evidence that it's unreliable.
25.03.2025 07:53 — 👍 2 🔁 0 💬 0 📌 0
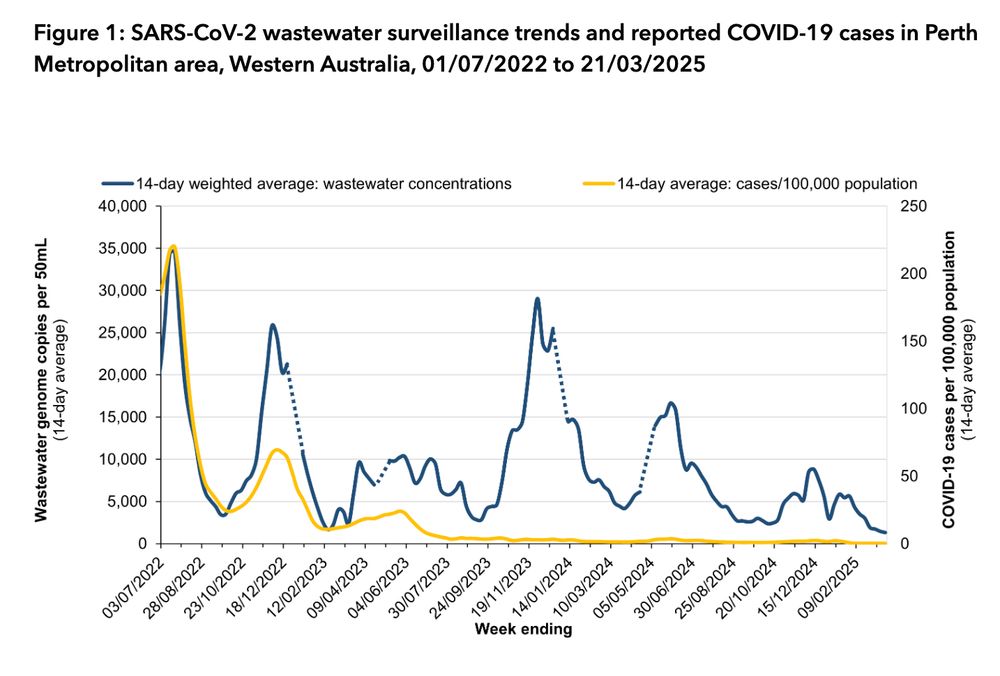
Line graph of SARS-CoV-2 wastewater surveillance trends in Perth Metropolitan area, Western Australia, 01/07/2022 to 21/03/2025
Interesting @mikehoney.bsky.social, especially since new C19 wastewater graph for Perth (up to 21 March), shows last wave has continued to fall, with the level still very low (relatively). LP.8.1 not mentioned in variant charts.
@thecovidinfoguy.bsky.social
www.health.wa.gov.au/Articles/A_E...
25.03.2025 06:51 — 👍 17 🔁 1 💬 2 📌 0
Thank you Mike - I appreciate your interpretation 🙏
18.03.2025 08:49 — 👍 0 🔁 0 💬 0 📌 0
Sad but true.
18.03.2025 07:45 — 👍 0 🔁 0 💬 0 📌 0
😩
18.03.2025 05:48 — 👍 1 🔁 0 💬 0 📌 0
Yes, certainly still hearing of it anecdotally.
18.03.2025 03:43 — 👍 3 🔁 0 💬 0 📌 0
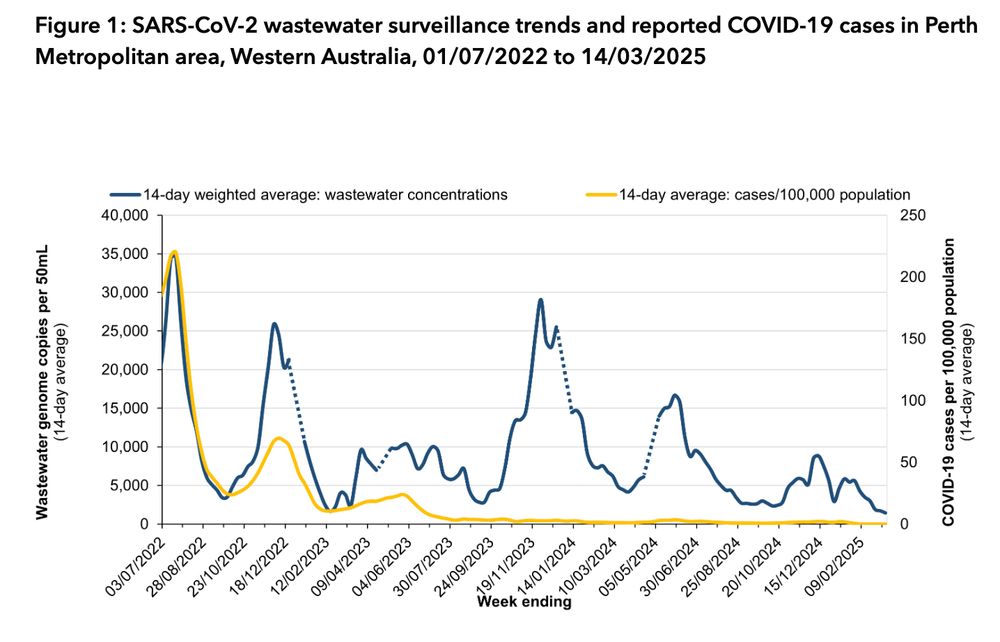
Line graph of SARS-CoV-2 wastewater surveillance trends in Perth Metropolitan area, Western Australia, 01/07/2022 to 14/03/2025
Latest C19 wastewater graph for Perth, Western Australia (up to 14 March). We have not seen levels this low for a long time.
What do you make of it @mikehoney.bsky.social?
@thecovidinfoguy.bsky.social
www.health.wa.gov.au/Articles/A_E...
18.03.2025 02:29 — 👍 38 🔁 9 💬 6 📌 0
📌
15.03.2025 07:59 — 👍 1 🔁 0 💬 0 📌 0
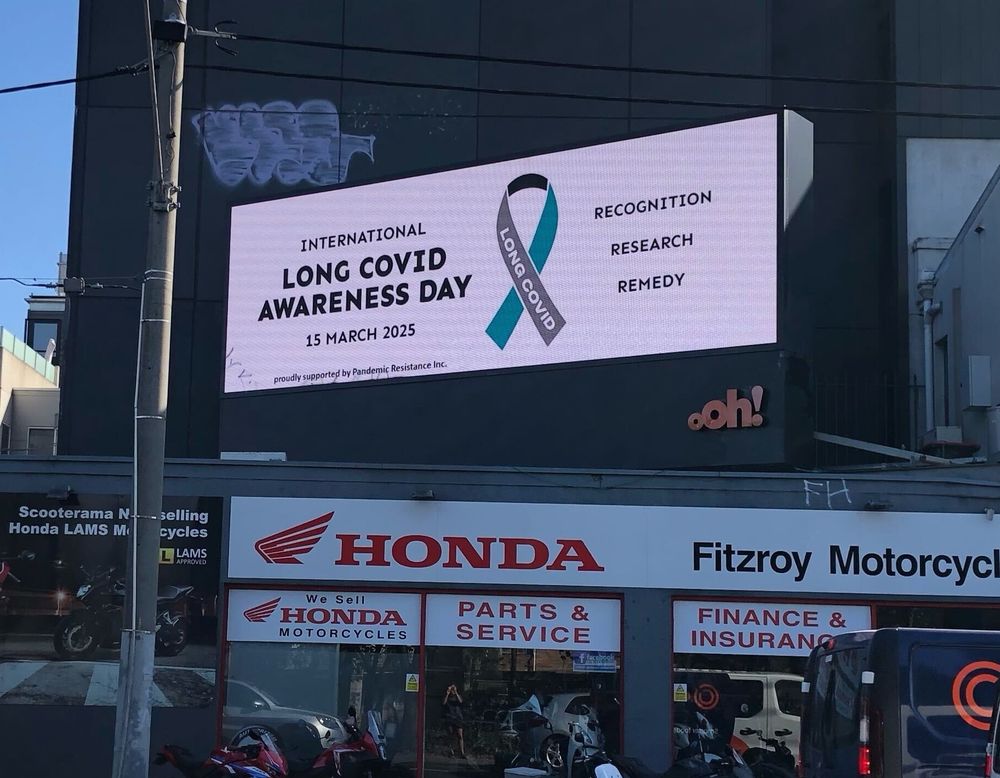
Long Covid Awareness Day Billboard.
Text: International Long COVID Awareness Day
15th March 2025
Recognition, research, remedy.
White background, black text with image of Long COVID Awareness Day ribbon.
Today is Long COVID Awareness Day.
We recognise those living with LC and those caring for people with LC.
We must all provide support and join the call for research and a remedy for LC.
This Billboard was captured in Melbourne, Australia.
#LongCovidAwarenessDay
14.03.2025 19:50 — 👍 126 🔁 52 💬 2 📌 3
IMPORTANT CAUSE ⤵️
#LongCovidAwarenessDay
#CovidIsNotOver
14.03.2025 03:41 — 👍 10 🔁 9 💬 0 📌 1
YouTube video by The Safer Air Project
Invisible inclusion
www.youtube.com/watch?v=3nrp...
01.03.2025 00:44 — 👍 1 🔁 0 💬 0 📌 0
Thanks Mike. The 'interesting' times roll on.
16.02.2025 01:44 — 👍 2 🔁 0 💬 0 📌 0
Yes. Thanks Mike.
12.02.2025 01:36 — 👍 1 🔁 0 💬 0 📌 0
I agree with Andrew - there wasn’t a PCR system collapse in Perth at that time.
11.02.2025 23:43 — 👍 3 🔁 0 💬 1 📌 0
Thanks Mike. Always appreciate your extra analysis. And Andrew 🙏
11.02.2025 10:29 — 👍 2 🔁 0 💬 0 📌 0
🙏
11.02.2025 10:20 — 👍 1 🔁 0 💬 0 📌 0
Thanks so much, Mike 🙏. Do you mean you're calculating this taking into account the missed tests now as well? Because barely anyone is testing now ofc.
11.02.2025 09:16 — 👍 3 🔁 0 💬 1 📌 0
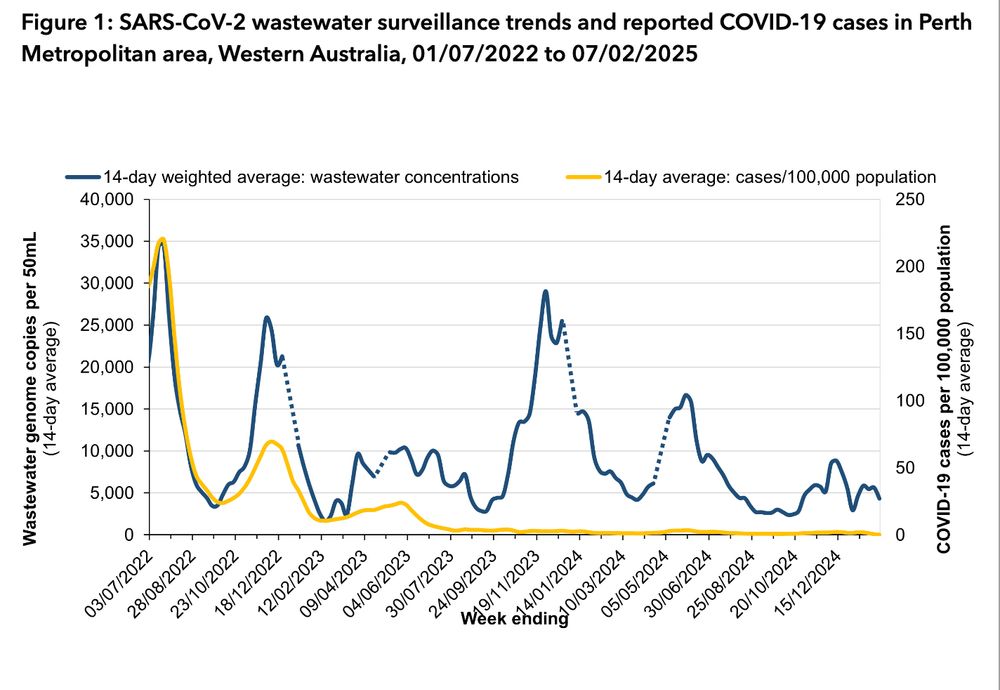
Line graph of SARS-CoV-2 wastewater surveillance trends in Perth Metropolitan area, Western Australia, 01/07/2022 to 07/02/2025
Latest C19 wastewater graph for Perth, Western Australia (up to 7 Feb) shows downward trending line.
Remains to be seen if it will reach the low points of previous waves 👀
@thecovidinfoguy.bsky.social @mikehoney.bsky.social @oncewasarnold.bsky.social
www.health.wa.gov.au/Articles/A_E...
11.02.2025 04:53 — 👍 28 🔁 8 💬 2 📌 0
And on it goes 😰
05.02.2025 09:37 — 👍 3 🔁 0 💬 0 📌 0
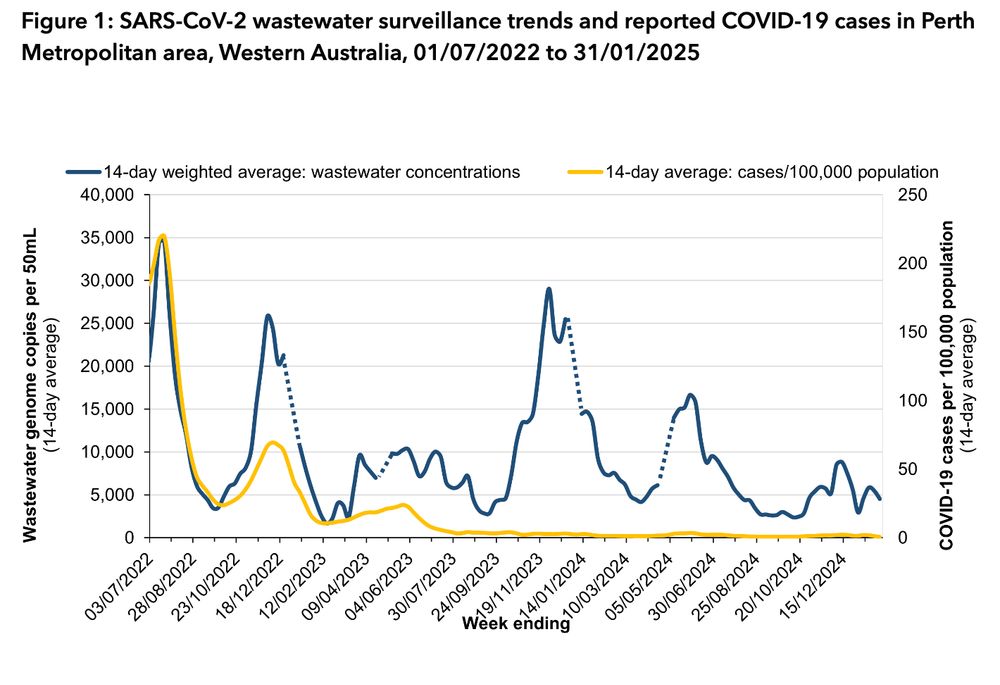
Line graph of SARS-CoV-2 wastewater surveillance trends in Perth Metropolitan area, Western Australia, 01/07/2022 to 31/01/2025
Latest report shows the downward trend in #Covid19 wastewater for Perth, Western Australia has continued (up to 31 Jan).
School return effect may show next week.
@thecovidinfoguy.bsky.social @mikehoney.bsky.social @oncewasarnold.bsky.social
www.health.wa.gov.au/Articles/A_E...
05.02.2025 05:32 — 👍 39 🔁 12 💬 1 📌 2
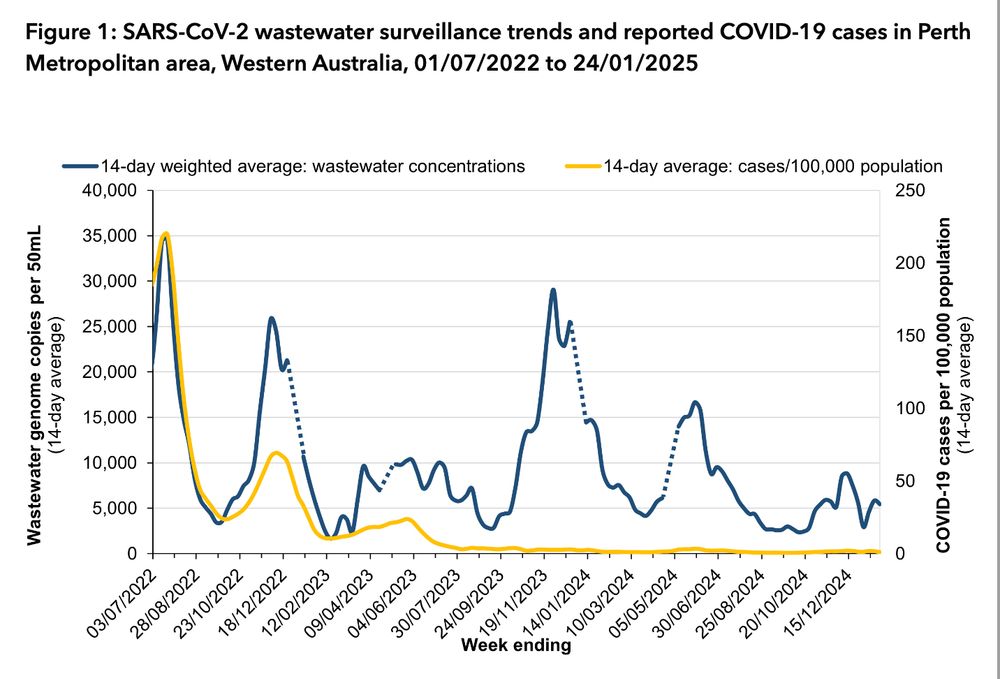
Line graph of SARS-CoV-2 wastewater surveillance trends in Perth Metropolitan area, Western Australia, 01/07/2022 to 24/01/2025
Latest #Covid-19 wastewater for Perth, Western Australia (up to 24 Jan) shows a small downturn. The rollercoaster rattles on without a controller.
@thecovidinfoguy.bsky.social @mikehoney.bsky.social @oncewasarnold.bsky.social
www.health.wa.gov.au/Articles/A_E...
29.01.2025 07:07 — 👍 42 🔁 6 💬 0 📌 0
Fyi @oncewasarnold.bsky.social
20.01.2025 06:16 — 👍 1 🔁 0 💬 0 📌 0
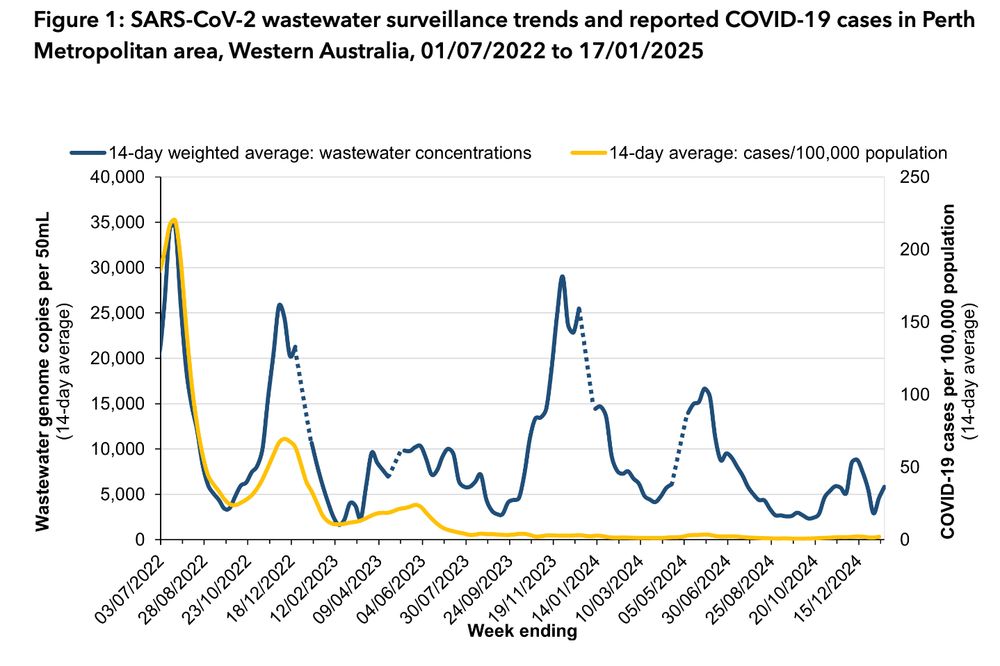
Line graph of SARS-CoV-2 wastewater surveillance trends in Perth Metropolitan area, Western Australia, 01/07/2022 to 17/01/2025
Latest #Covid wastewater graph for Perth, Western Australia, up to 17 January.
Last report's upward trajectory continues 😒
(No updated variant analysis since 5 Jan)
@thecovidinfoguy.bsky.social @mikehoney.bsky.social
www.health.wa.gov.au/Articles/A_E...
20.01.2025 06:09 — 👍 24 🔁 4 💬 2 📌 0
I expect the timing of updates will remain a bit unpredictable - Mondays used to be the norm 🤷♀️
14.01.2025 08:21 — 👍 0 🔁 0 💬 0 📌 0
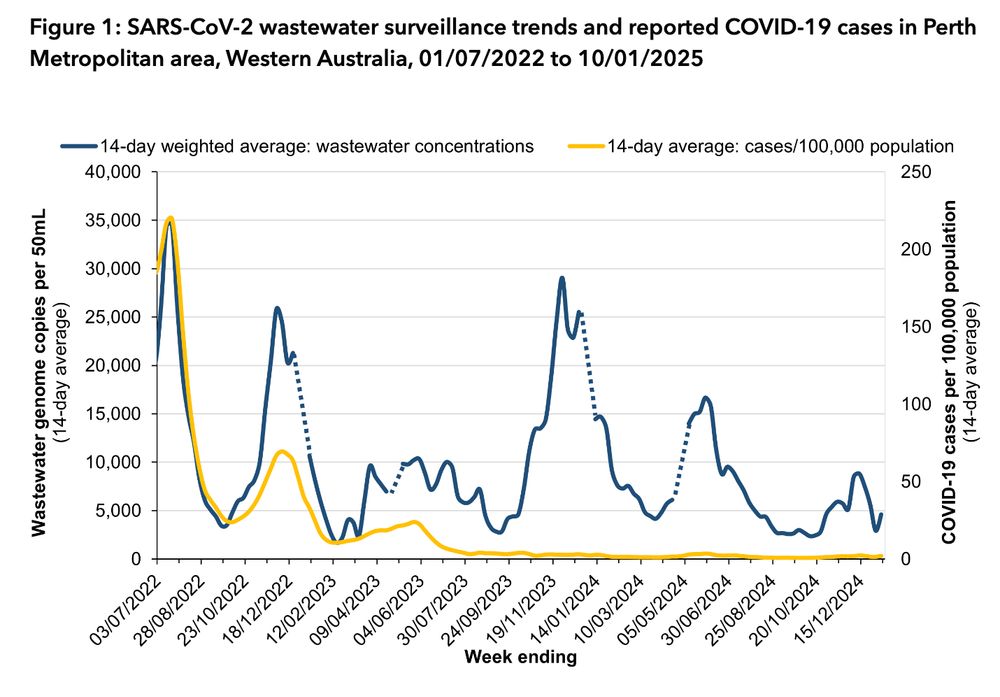
Line graph of SARS-CoV-2 wastewater surveillance trends in Perth Metropolitan area, Western Australia, 01/07/2022 to 10/01/2025
Latest C19 wastewater graph for Perth, Western Australia, up to 10 January.
Unsurprisingly, an upward turn following Xmas/NY period.
#Covid
@mikehoney.bsky.social @thecovidinfoguy.bsky.social @oncewasarnold.bsky.social
www.health.wa.gov.au/Articles/A_E...
14.01.2025 07:08 — 👍 6 🔁 0 💬 1 📌 1
Counter Disinformation Project, Former NEU and ATL union executive
Freelance journalist & researcher @bylinetimes @whowhatwhy
Educator
Counterdisinformationproject.substack.com
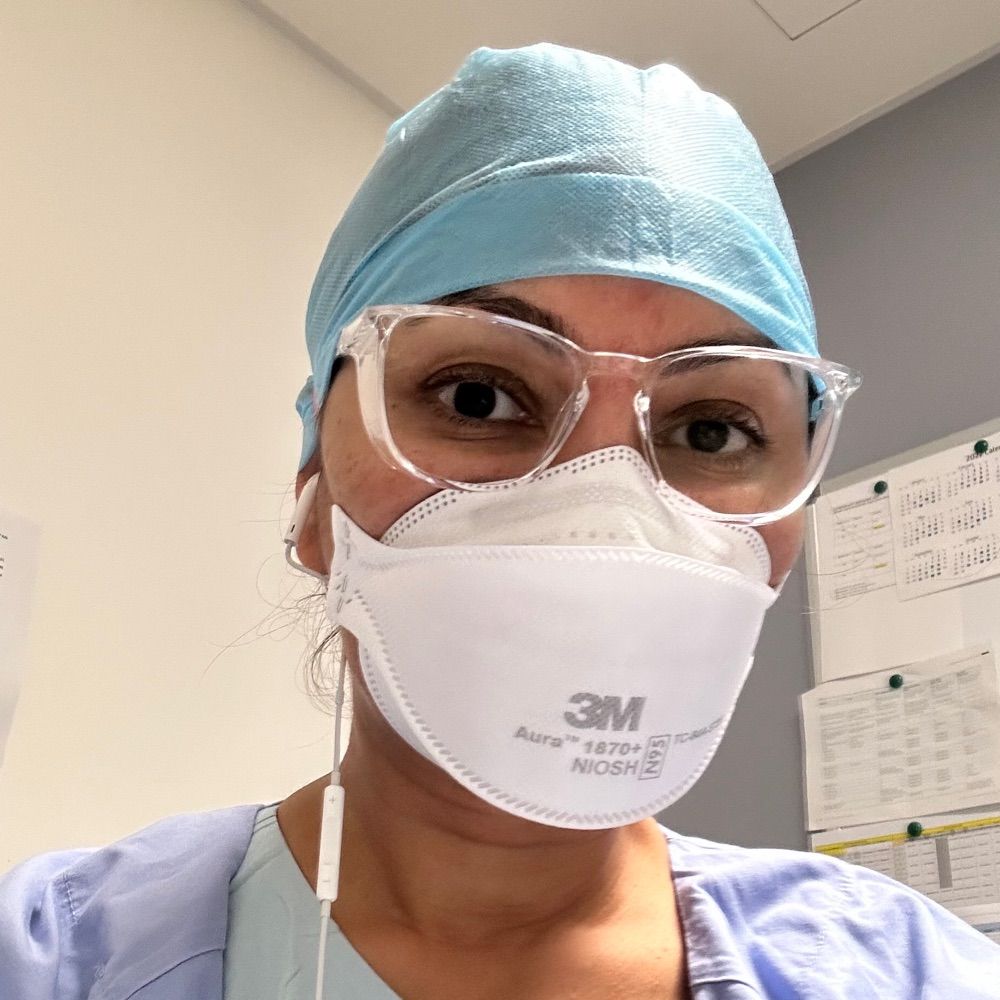
Anaesthetist in Sydney. Advocates for N95s and clean indoor air. Waiting for Novavax. Believes that doctors have a duty of care to learn about covid.
Adjusting to chronic illness caused by a virus being ignored by society. Wanting to connect with others to learn and find community.
#LC #POTS #Keepmasksinhealthcare #AirborneAware #Covidisn’tover
We're all normal to ourselves. I write. I hate hustle. I love shiny objects. Can't even influence an ant. Anthropology & sociology graduate. Author of books. Spoonie. And much more.
www.normalness.com
Creating a more equitable world through better health.
Burnt out critical care nurse. Dreaming of fairness & integrity in politics. Woke af.
Living in lutruwita/Tasmania.
She/her
I’m an ICU nurse with interests in end of life care, technology and medication safety. Out of work food, Pilates, coffee and swimming probably not in that order. PwLC since November ‘22 She/her
Zoomers of the Sunshine Coast BC
Independent, moderated, timely, deep, gentle, evidence-based, clinical & community information regarding COVID-19 since Feb 2020.
@SCZoomers on mstdn.ca, twitter & tiktok
https://www.facebook.com/groups/163204518044728
Lapsed optimist.
Lapsed Catholic.
Drained and defeated environmentalist.
Climate change believer with deep concerns for our children’s future.
Progressive political leanings believing in equality for all people.
Retired in Western Australia 🇦🇺
Get your popcorn and enjoy the ride. Scrutiny, exposure, truths, juxtapositions, and scepticism.
Tracking extremists, South East Asian terrorism and insurgency threats.
Was on X as petedavo_au and petedavo_world
Survivor. Proud mother. Teacher. Activist. Trying to make a difference.
#PatientAdvocate #longcovidawareness #LCDC #March15 #ValueCognition #WHN
Interview with @theWHN :
https://youtu.be/YUgcqJ-m7C0
Anthropology / archaeology, mechanical material culture, graf n tags.
#ThRiteHandSideOfThTrain
Yartapuulti / the Wairarapa
Health academic trying to navigate these interesting times 😬
she/her/i/ise
#CovidIsAirborne #MaskUp 😷
Voted Yes . Lifelong unionist and fighter for social justice.❤️💛🖤
Betty C. Jung MPH RN MCHES® PHENOM Director; Webmaster #PublicHealth #Health #Science #Technology #Culture #COVID19 #H5N1
https://www.bettycjung.net