Merci beaucoup Denis! J'espère que tout va bien avec toi :)
19.11.2025 14:03 — 👍 1 🔁 0 💬 1 📌 0

source: https://pulse.climate.copernicus.eu/

source: https://pulse.climate.copernicus.eu/
La Nina is here and the global cool-down is well underway (global mean sea surface temps are lowest since March 2023).
Remember it's not the individual ups & downs that matter, it's the steady warming trend, which will continue until we reach zero carbon emissions.
#Urgency #StayFocused #COP30
15.11.2025 15:31 — 👍 230 🔁 85 💬 9 📌 6
🇮🇹 To all Italian-speaking contacts & friends 🇮🇹
On Thursday Nov 13th I'll give a talk (in Italian) on 'Dataviz for climate and weather forecast" for the Italian national meteorological service #ItaliaMeteo
Register here if you are interested:
🔗 events.teams.microsoft.com/event/5c333a... #dataviz
10.11.2025 09:51 — 👍 3 🔁 0 💬 0 📌 0
🌡️ 2025 on track to be among top three warmest years. The #C3S Climate Bulletin reports that October was 1.55°C above pre-industrial levels, making it the third-warmest October on record and the first monthly average above 1.5°C since April.
Explore the insights👉 climate.copernicus.eu/surface-air-...
07.11.2025 08:09 — 👍 31 🔁 23 💬 1 📌 4
Amazing to see @copernicusecmwf.bsky.social Climate Pulse in action, telling important stories around the world.
In case you missed it, we recently released a new version of the app with additional features 🌟
pulse.climate.copernicus.eu
Take a look, find your story, spread the word 🌍🥵🌡️📈 #dataviz
24.10.2025 13:24 — 👍 8 🔁 1 💬 0 📌 0

🚨 Launched: State of Wildfires Report 2024-25
The Americas felt the harsh reality of what it means to live on a more fire-prone planet, with extreme #wildfire episodes made 2-3 times more likely by #climate change.
🔥 Full details via our brand new website: stateofwildfires.com/latest-report/
16.10.2025 06:36 — 👍 63 🔁 38 💬 1 📌 1
🌟 Climate Pulse, our #C3S app to explore climate data, has a new look & a list of additional features 🌟
🧭 improved navigation
🖥️ fullscreen view
📈 more customisable charts
🗺️ new map projections (including Europe and Poles)
Explore it and share your feedback with us!
pulse.climate.copernicus.eu
08.10.2025 12:11 — 👍 5 🔁 2 💬 0 📌 0

Meet the team behind a decade of global climate updates, from scientists to analysts and technical experts. These are the people transforming climate data into actionable insight in the monthly #C3S Climate Bulletin.
Read the article climate.copernicus.eu/ten-years-c3...
15.09.2025 12:23 — 👍 17 🔁 10 💬 0 📌 2
🎙️ I had the immense privilege to talk to @visualisingdata.com about the @copernicusecmwf.bsky.social European State of Climate Report 2024: the role of #dataviz, my sources of inspiration, the link between science & art..
We talked for over an hour, it felt like 10 minutes 🧡
➡️ shorturl.at/8zLn6
14.09.2025 16:53 — 👍 13 🔁 4 💬 0 📌 0
The new Thermal Trace app from #C3S and #ECMWF is here! 80+ years of thermal stress data based on “feels-like” temperatures for any location worldwide, now at your fingertips. Fast, intuitive, interactive – and free! Read our article for the full details and head to the app. 🔗
bit.ly/46ZMllL
20.08.2025 08:10 — 👍 49 🔁 26 💬 2 📌 3

Global map of the peak heat stress experienced in June 2025, a screenshot from the new Thermal Trace app from C3S and ECMWF.
Excited to share our new app Thermal Trace!
🔗 thermaltrace.climate.copernicus.eu
Thermal stress = health impacts of exposure to extreme thermal conditions (heatwaves, cold spells)
Use Thermal Trace to monitor heat & cold stress globally (five days behind real time) & explore changes over time 🥵🥶
20.08.2025 09:20 — 👍 22 🔁 4 💬 2 📌 1
🎙️ Really looking forward to this chat with Andy next week!
Stay tuned for insights and anecdotes about #dataviz & climate science 🌍📈
In the meantime go browse through all 5 past seasons of his podcast: a real treasure of content & inspirational conversations ➡️ visualisingdata.com/podcast/
17.07.2025 15:13 — 👍 7 🔁 3 💬 0 📌 0
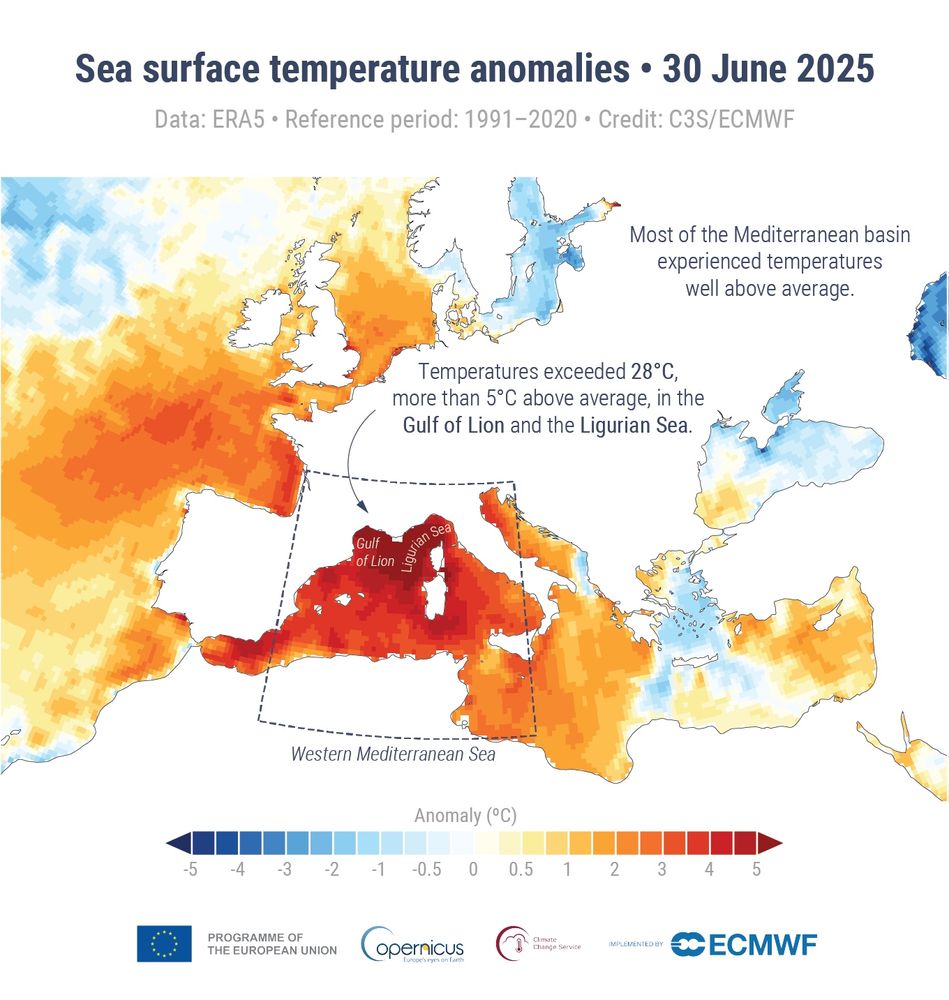
A map of Europe with the sea coloured based on the sea surface temperature anomalies on 30 June 2025. Annotations mention that most of the Mediterranean basin experienced temperatures well above average, and temperatures exceeded 28°C, more than 5°C above average, in the Gulf of Lion and Ligurian Sea.
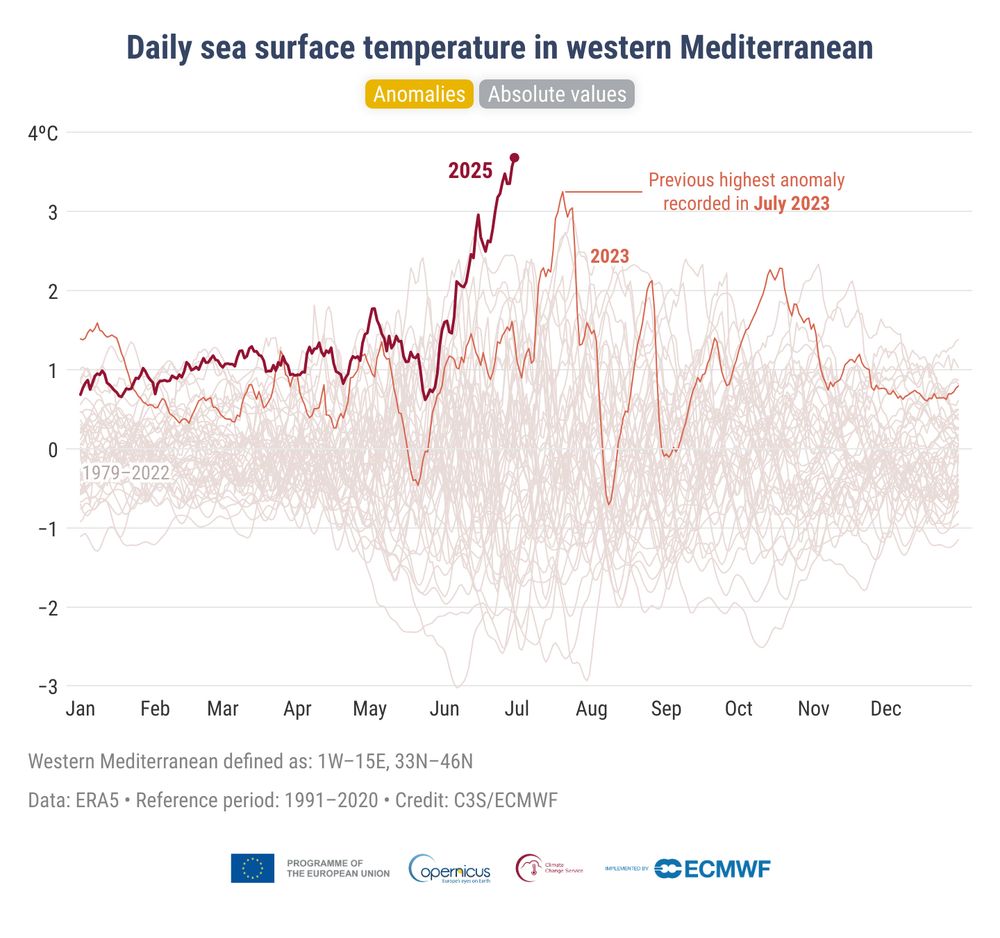
A line chart of daily sea surface temperature anomalies in ERA5 from 1979 to 2025 in the western Mediterranean, showing the record-breaking anomalies in June 2025 and highlighting the previous highest anomaly in July 2023.
Exceptional Mediterranean water temperatures in June reduced nighttime air cooling along the coasts & increased humidity, worsening heat stress impacts - some coastal areas saw 10-15 tropical nights (when the temperature doesn’t drop below 20°C) last month, when they’d typically see none in June 🥵☀️🌙
10.07.2025 08:30 — 👍 12 🔁 6 💬 1 📌 0
This is one of the most moving #dataviz I've come across in a while.. heartbreaking and so important 💔
10.07.2025 12:34 — 👍 4 🔁 0 💬 0 📌 0

Yes, precision is important, but transparency is where the trust is going to come back.

One of the first questions we ask when crafting a data story is how to make the data meaningful for those most impacted by it, especially when it involves the local communities we serve.

There's no such thing as an ugly sketch. There are only sketches that help you think, sketches that help you communicate, and sketches that you do for fun.
On day 2 of #Outlier2025, we explored what it means to build trust in visualizations, challenge assumptions, and widen our lens on what counts as data, who it's for, and how it's shared.
Let’s keep the momentum going. See you on day 3!
13.06.2025 02:23 — 👍 3 🔁 1 💬 0 📌 0
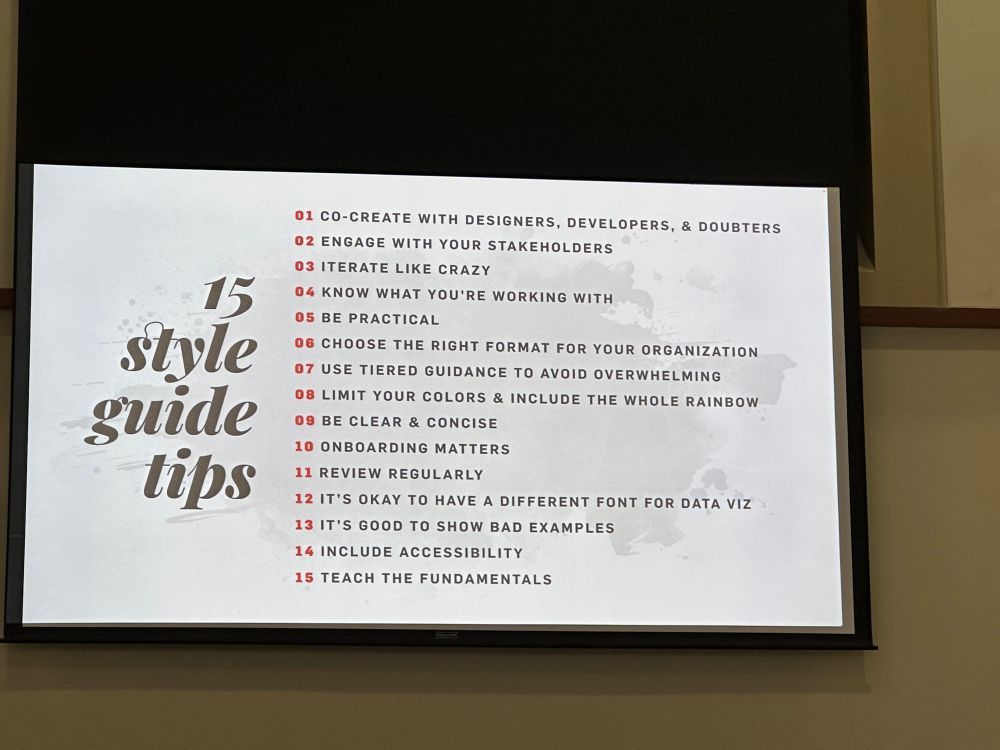
Thankfully @amycesal.com, Max Graze, Alan Wilson and @policyviz.bsky.social managed to get their fifteen style guide tips into one summary slide at #outlier2025 so I didn’t have to pick one!
11.06.2025 18:01 — 👍 21 🔁 5 💬 1 📌 0
🌡 Out now: the May 2025 #C3S Climate Bulletin reports the second-warmest May globally, 1.4°C above the pre-industrial level. SST reached 20.79°C, marking also the second-highest on record.
Get more temperature insights 🔗 climate.copernicus.eu/surface-air-...
11.06.2025 07:07 — 👍 30 🔁 12 💬 1 📌 1
European State of the Climate 2024
Explore the full report, a joint effort by @copernicusecmwf.bsky.social and @wmo-global.bsky.social: climate.copernicus.eu/esotc/2024
12.05.2025 13:02 — 👍 0 🔁 0 💬 0 📌 0
✍️ My two cents on the role of #dataviz in the #ESOTC2024 report.
The #climatecrisis is the most important story of our times and we need to exploit ALL the tools we have to tell it in the most compelling way and make it resonate with people.
climate.copernicus.eu/role-data-vi...
12.05.2025 13:02 — 👍 9 🔁 2 💬 1 📌 1
🙈
28.04.2025 20:31 — 👍 0 🔁 0 💬 0 📌 0

1
Over 130 charts and graphics bring climate data to life in the #ESOTC2024. Data visualisations communicate complex findings in a clear way and are the hallmark of the partnership between #C3S and WMO along with scientists and data providers.
https://bit.ly/4czvQNX
22.04.2025 12:00 — 👍 22 🔁 9 💬 1 📌 0
6. Snow and glaciers
Interactive version also available in the online report: climate.copernicus.eu/esotc/2024/s...
@copernicusecmwf.bsky.social @wmo-global.bsky.social #ESOTC24
17.04.2025 13:42 — 👍 0 🔁 0 💬 0 📌 0

For #ESOTC24 we worked on bespoke infographics to highlight key messages of the report. I especially enjoyed working on this one, in collaboration with scientists and glacier experts at the University of Zurich/WGMS. It shows how glaciers in the Alps have receded over the years 😢
#dataviz #climate
17.04.2025 13:41 — 👍 10 🔁 1 💬 1 📌 3
The #ESOTC2024 cover aims to grab people's attention & spark curiosity, while offering a visual snapshot of climate conditions in Europe in 2024 🌡️
Started from the same dataset used last year (with one extra datapoint), but I'd say the result is quite different 🏔️
Pick your favourite 😉 #dataviz
15.04.2025 08:32 — 👍 19 🔁 4 💬 0 📌 0
The @copernicusecmwf.bsky.social and @wmo-global.bsky.social European State of the Climate Report is launched today
🌐 more than 40 datasets
👩🔬 over 100 scientists
🗺️ > 130 charts and graphics
Check it out: climate.copernicus.eu/ESOTC
🌏🌡️🧪⚒️🌊🛰️
15.04.2025 05:19 — 👍 132 🔁 62 💬 2 📌 4


The European State of the Climate 2024 report is OUT!
A joint effort by @copernicusecmwf.bsky.social & @wmo-global.bsky.social
Read it & explore all additional resources which include a Graphics gallery, infographics, animations! Enjoy 😊 climate.copernicus.eu/esotc/2024
#dataviz #climate #ESOTC2024
15.04.2025 06:50 — 👍 73 🔁 22 💬 2 📌 3
Get ready for the European State of the Climate 2024 release on April 15, covering a great range of climate variables for Europe and the Arctic—temperature, flooding, wildfires, glaciers, renewable energy, and more!
Stay tuned!
#ESOTC2024 #C3S
01.04.2025 08:31 — 👍 61 🔁 21 💬 0 📌 0
#CCNow is a collab of 500+ media outlets creating an all newsroom approach to covering climate. The climate news & resources you need NOW: tinyurl.com/CCNowNL
Donate to support our work: https://bit.ly/3SMIvUW
dataviz and information graphics at ELTE MMI
portfolio: https://attilabatorfy.com/
head of visual journalism project: https://atlo.team/
book order: https://eltebook.hu/batorfy-attila-adatvizualizacio
blog: https://attilabatorfy.substack.com/
Journalist, author, musician, sonifier. I make things with data. Half of Loud Numbers.
➡️ ameliaantzee.com
ℹ️ Old name Trud Antzée
🌸 Pronounced an-TSEE
📈 Creative information designer
🎼 Former musician & teacher
🎧 Dancer & DJ of Argentine social tango
✏️ English & Norwegian nynorsk
🇳🇴 Oslo, Norway
💃🏻 She/her
⛔️ No AI
#️⃣ #AmeliasInspiration
Data journalist for @economist.com. Interim special-projects editor.
Subscribe to The Economist's data newsletter:
https://theeconomistoffthecharts.substack.com/
I turn research into memorable visuals: Atlas of Finance; Atlas of the Invisible; Where the Animals Go; @publictypewritr and more 📚 formerly @natgeo 🥁 @floordays
We are the Young Statisticians Section of the Royal Statistical Society👶🔢. The views expressed are our own and do not necessarily represent those of the RSS.
We're a membership body for statisticians and data professionals, promoting a world with data at the heart of understanding and decision-making.
Climate journalist, teacher, professor of practice @uvaenvironment.bsky.social. Former WaPo climate writer. Views are my own. For my latest work: https://reportearth.substack.com/
housing + environmental health.
Asst. Professor of urban planning @gsd.harvard.edu
Formerly OECD, Paris planning, Ad’A ~
i write i teach i build i deconstruct
www.magdamaaoui.com
currently working on hospitals x housing, any lead/personal story welcome
Working for climate action in Edinburgh
https://data-4-climate-action-edinburgh.github.io/home/
Carbon Cycle, Fire, Emissions, Climate 🌎🔥
NERC Research Fellow, University of East Anglia (UEA) / Tyndall Centre.
Co-lead: State of Wildfires Project.
Editor-in-Chief: Journal of Pyrogeography.
Member: Global Carbon Project.
mattwjones.co.uk
Advanced Researcher at Forensic Architecture (@forensicarchi.bsky.social)
✳︎ Researcher and Computational Designer @forensicarchitecture
https://luciarebolino.com/
Home page: http://DoctorZen.net. Biologist. Author of Better Posters book and blog. Collector of academic hoaxes.
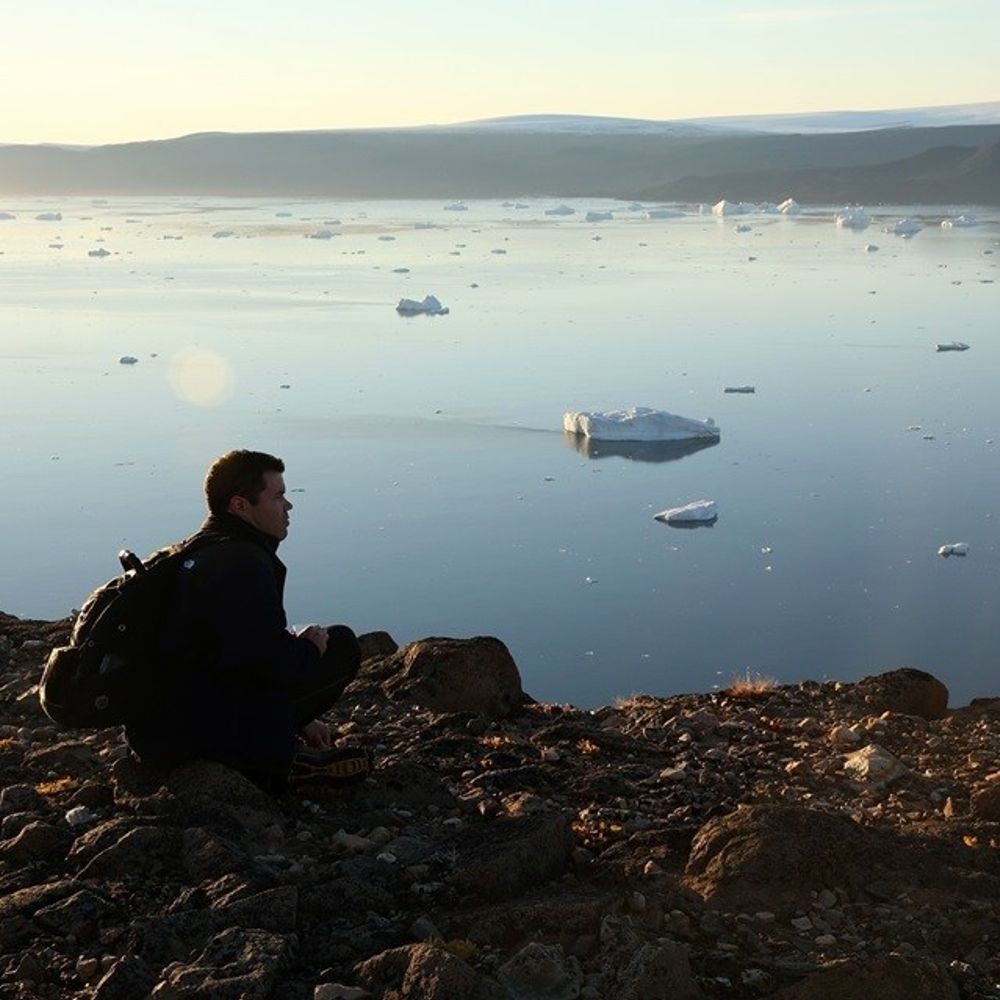
Scientific Officer at the Copernicus Climate Change Service 🇪🇺 | Satellite Observations 🛰️ | Ocean and Cryosphere 🌊❄️🧊
Graphic/data journalist 📈 📉 Aspiring street photographer 📸 Currently @vancouversun 📰 Formerly @AP and @nytimes 🗞️🗞️🗞️
Climate, environment, biodiversity, health, strategy, systems change, collaboration, imagination, cohousing, surfing, art
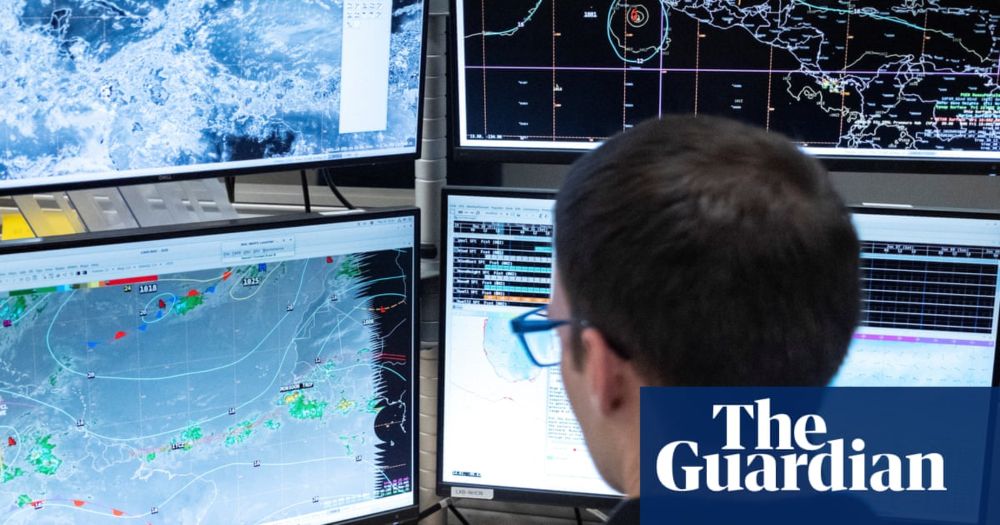
European operational #satellite agency for monitoring weather, #climate and the environment from #space 🛰
eumetsat.int