I got my set of
@infowetrust.com 's Maps for Kids today. I thought for my grandkids, but I may end up keeping them myself.
This one, on Food Energy is particularly brilliant. The loveliest trilinear plot ever seen.
Get yours at visionarypress.com/pages/maps-f...
06.12.2025 00:28 — 👍 15 🔁 3 💬 1 📌 0
My time and cost version from years ago (car)
05.12.2025 17:33 — 👍 3 🔁 1 💬 0 📌 0
Here is the entire collection of Larkin's charts www.fellowshipbiblechurchorlando.org/blank
05.12.2025 17:02 — 👍 1 🔁 0 💬 0 📌 0
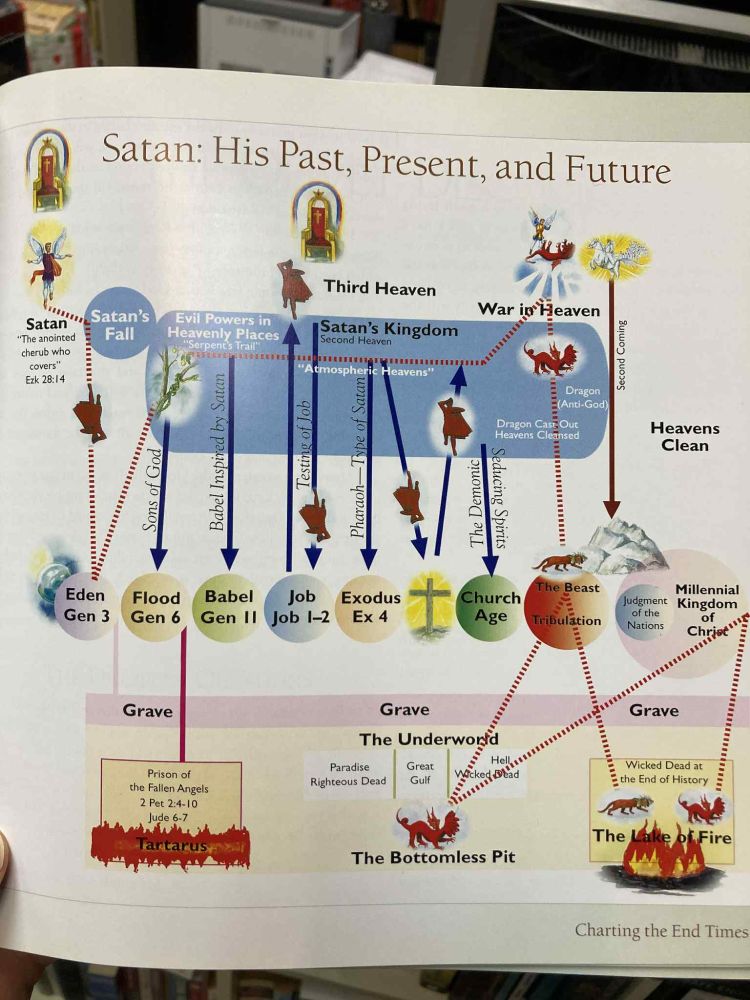
Misi Minkó sent me this diagram about Satan's past, present and future, and while searching the internet, I came across the Biblical charts of creationist Clarence Larkin. Every joke is new to a newborn!
05.12.2025 16:56 — 👍 1 🔁 1 💬 0 📌 1

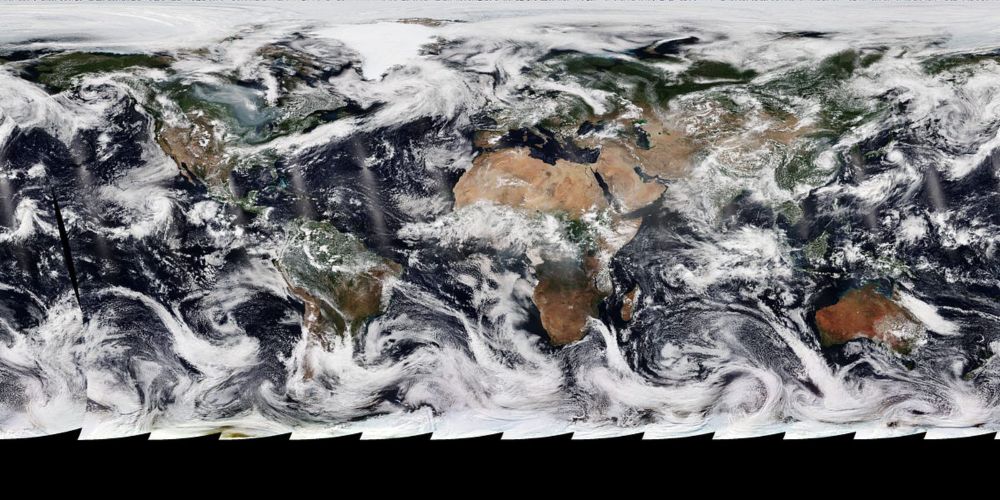
This image of North and South America at night is a composite assembled from data acquired by the Suomi NPP satellite in April and October 2012. The new data was mapped over existing Blue Marble imagery of Earth to provide a realistic view of the planet.
Most of the Earth appears as it would after dark, with city lights glowing underneath clouds. There’s a thin arc of atmosphere, simulating how daybreak would look from far above the Earth.
One from the archives. The first 6 months of VIIRS Day Night Band data, an instrument sensitive enough to see snow by starlight. Rendered in Cinema4D with a physically based atmosphere shader. I put *a lot* of work into the clouds, and how they would appear from space at night.
#dataviz #NASA #NOAA
04.12.2025 21:36 — 👍 22 🔁 5 💬 1 📌 0
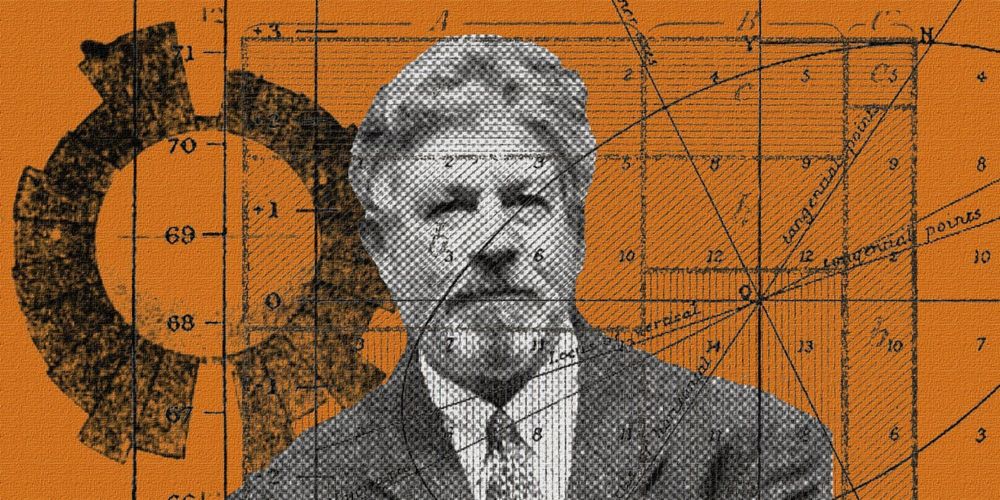
Not just pretty pictures: interview with Michael Friendly
The Curious Cabinet #2
"the inspiration to do our best today, to think and try to visualize data better, even if it means using novel graphic forms"— @datavisfriendly.bsky.social with @attilabatorfy.bsky.social attilabatorfy.substack.com/p/not-just-p...
04.12.2025 22:06 — 👍 7 🔁 3 💬 1 📌 0

let's get infografit book with Santa Claus hat
going to overeat at Christmas? Work it off with my new book as your guide! letsgetinfografit.com
04.12.2025 20:17 — 👍 6 🔁 5 💬 0 📌 1

A grid of thumbnails showing monthly highlights. Maps, illustrations, 3D models and sketches from 2025
Every year, as December approaches, I like to look back on the year. This was my 2025, told through stories with maps, illustrations, 3D models, and more: tinyurl.com/4wmzfawu Happy holidays! 🎄
04.12.2025 15:01 — 👍 12 🔁 1 💬 0 📌 0

Not just pretty pictures: interview with Michael Friendly
The Curious Cabinet #2
Here it is! Thank you, Michael! @datavisfriendly.bsky.social
04.12.2025 14:07 — 👍 3 🔁 1 💬 0 📌 0

Photo of Twin Peaks VHS collection arranched in a way, so that it now says
"AHPEKS TWIN".
🔥
03.12.2025 18:32 — 👍 41 🔁 1 💬 3 📌 0

The interview with Michael Friendly is coming tomorrow! @datavisfriendly.bsky.social
03.12.2025 19:31 — 👍 6 🔁 1 💬 0 📌 0

This is my type of essay by Stefan Helmreich from MIT Anthropology. With lots of graphics! anthropology.mit.edu/files/anthro...
03.12.2025 18:23 — 👍 0 🔁 0 💬 0 📌 0

this proposal is too complex to me, while I'm struggling to find a good taxonomy for my collection. Sometimes I just want to filter for "circular", or "polar" diagrams. Here: www.arxiv.org/abs/2505.01724
03.12.2025 18:20 — 👍 2 🔁 0 💬 0 📌 0
Nobody asked me, but my favs
03.12.2025 18:03 — 👍 4 🔁 0 💬 0 📌 0
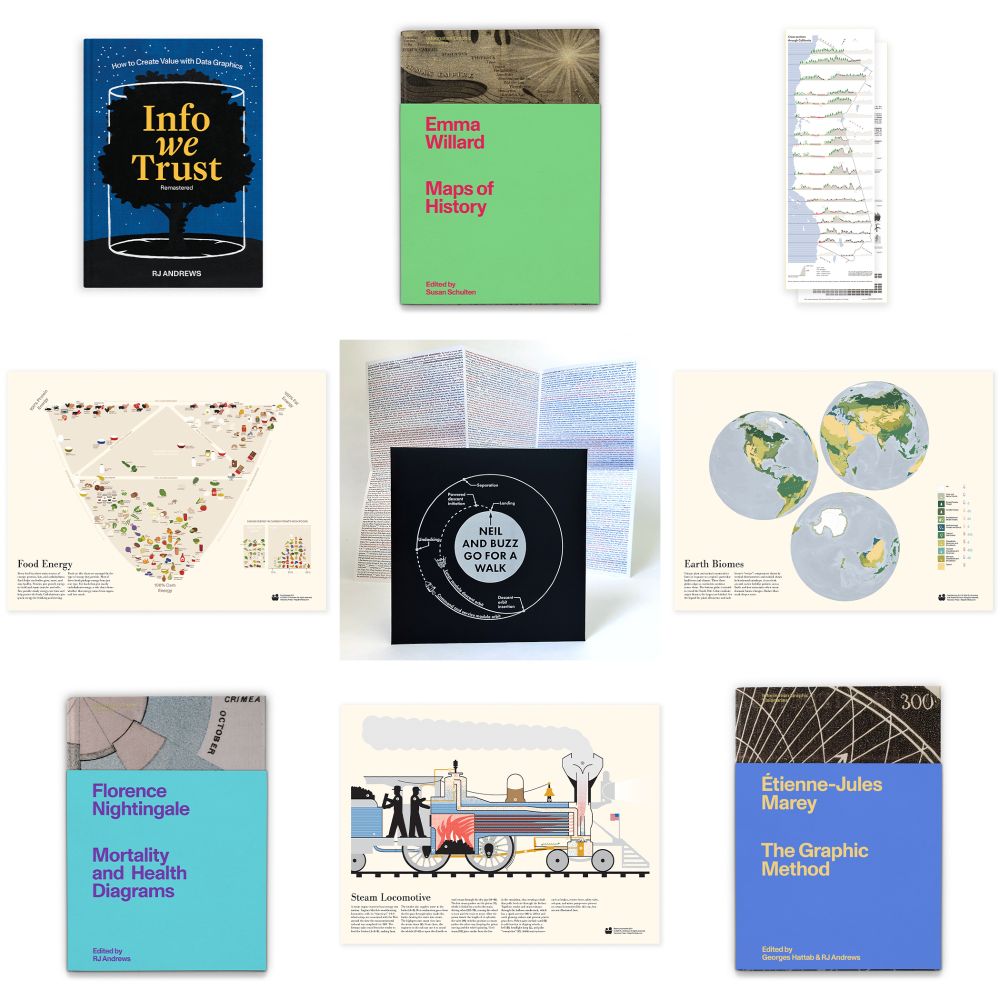
This is my favorite time of year: I get to send beautiful information graphics all over the world (over 60 countries and counting!).
Visionary Press is offering unique bundles, the biggest discounts yet on books and prints, + free domestic🇺🇸 shipping.
visionarypress.com/collections/...
01.12.2025 21:52 — 👍 16 🔁 6 💬 1 📌 1
I don't understand why the Guardian publishes every idiotic article it receives. "liberal arts institutions should embrace a market-oriented mindset."
01.12.2025 18:14 — 👍 3 🔁 1 💬 0 📌 0

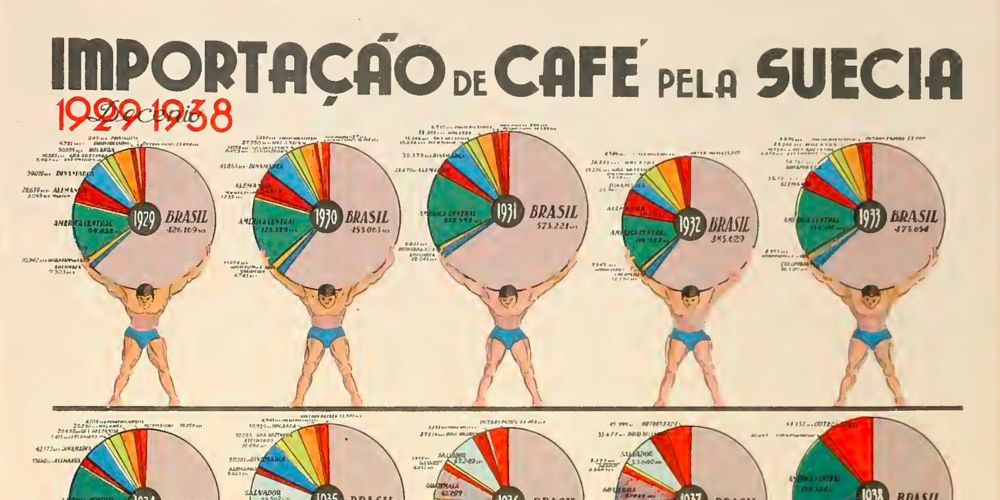
Breaking monotony with patterns
The solution of the "Atlas of Philippine Statistics" from 1939.
A solution from the Philippines. New on Cabinet of Infographic Curiosities
01.12.2025 14:36 — 👍 2 🔁 0 💬 0 📌 1

According to the propaganda of the Hungarian government, anyone not belonging to the ruling party Fidesz is a warmongering puppet of "Brussels"
However, when PM Orbán repeats the Russian talking points about the war in Ukraine and serves Russian interests, he's displaying HU's proud sovereignty :)
01.12.2025 11:47 — 👍 4 🔁 2 💬 0 📌 0

One of Booth's large scale map showing levels of poverty in London by color shading

Zoomed in detail of one of Booth's poverty maps

Legend showing color coding in Booth's map, ranging from yellow (wealthy) through red (well-to-do), down to dark blue & black (very poor & criminal)

#TodayinHistory #dataviz #OTD 📊
💀Nov 23, 1916 Charles Booth died in Thringstone, Leicestershire, England 🏴
1889: Social mapping. Street maps of London, showing poverty and wealth by color coding--> transforming existing methods of social survey and poverty mapping towards the end of the 19th C
25.11.2025 02:44 — 👍 15 🔁 1 💬 1 📌 0

Moving past superficial histories: interview with RJ Andrews
The Curious Cabinet #1.
We are putting together the next interview with Michael Friendly @datavisfriendly.bsky.social I can tell you, that it will be a tour de force about the history of dataviz. Coming soon! Until then you can read the first in the series with RJ Andrews @infowetrust.com.
24.11.2025 19:04 — 👍 5 🔁 1 💬 0 📌 0
Aww
20.11.2025 14:34 — 👍 1 🔁 0 💬 0 📌 0
I will try to figure out something
19.11.2025 20:42 — 👍 0 🔁 0 💬 0 📌 0
We are a data visualization and cartography studio with over 20 years of experience helping people find and tell more beautiful stories with data. Learn more at stamen.com
Mastodon: vis.social/@stamen
Technical Artist from the Netherlands. Blender, realtime stuff, open-source, etc.
tenochtitlan.thomaskole.nl
Community geographer, cartographer, pedestrian, cyclist. Author of "The New American Small Town: Lessons for sustainable urban futures" (West Virginia University Press, June 2025). https://communitygeography.kent.edu/
🌐Studies influence, propaganda, platform design@Georgetown
✍🏼Lawfare,The Atlantic
📕Invisible Rulers: The People Who Turn Lies Into Reality (invisiblerulers.com) —how influencers, algorithms, &online crowds shape public opinion
🦹🏻♀️Twitter Files supervillain
Assistant Professor, DataX/Computational Comm, University of California Los Angeles
Engineer, scholar, author, educator, and speaker specializing in data analysis and visualization, particularly in the areas of science and technology studies (https://scimaps.org) and biomedical applications (https://humanatlas.io).
Developmental geneticist by training, science-blogger by choice. Interested in all things #zebrafish, #devbio and #scicomm.
Lab webpage: http://danio.elte.hu/index.html
designer
luizadecarli.com.br
Hungarian. Green-minded local councillor. Fmr. ⚽️ interpreter. #Wikipedia, libraries, Fun facts. Vasas, F95, YB.
The official BlueSky account for Carole King. Singer/Songwriter/Pianist/Author
& Environmentalist
caroleking.komi.io
Mostly a data viz lurker, with an offline life as a researcher and data visualisation practitioner. Mixing it up with my current project: https://www.mymatrescence.datais.blue/
I like map projections and programming: I'm a curious geek.
I like #rstats, #python (but not its pkg system), #smalltalk, #lisp and #observablehq
The European Data & Computational Journalism Conference aims to bring together industry, practitioners and academics in the fields of journalism and news production.
September 8-10, Athens, Greece
https://www.datajconf.com/
Hármas számmal a sportág nagy és színes egyénisége.
Data analyst and data viz geek
Data Visualization researcher and Professor of Computer Science at the University of San Francisco. Research interests - Visualization Literacy, Mobile Data Visualization. Anti-Racist. Immigrant.
web: https://www.cs.usfca.edu/~apjoshi
Jornalista infografista
🌐 infograffi.com.br
📊 be.net/marcus-freitas
they/them • i'm into old things and faraway things and big things and painful things and cities and waves and loud noises • will post horror stuff occasionally
Tebeoarquitecto y museografista. Autor de "Cómic, arquitectura narrativa", comisario de "Beatos, mecachis y percebes" en la Biblioteca Nacional y “Contar un monte de Oro” en RAE Roma, coautor de la cartografía “Madrid Bombardeado” junto a Luis d Sobrón