Still, the city built the Dunsmuir & Georgia viaducts, demolishing the historic Black Hogan’s Alley neighborhood, expecting the freeway would eventually connect to the viaducts.
To this day, Vancouver is the only major North American city without an inner-city freeway.
3/3
15.09.2025 04:07 — 👍 2 🔁 0 💬 0 📌 0

The community in Chinatown pushed back, and activists tirelessly organized and worked with sympathetic municipal officials on the inside to make the plan unappealing for the federal government to fund. It worked.
2/3
15.09.2025 04:07 — 👍 1 🔁 0 💬 1 📌 0

Map of freeway plan through downtown Vancouver
I think about this image a lot.
Like other cities in North America, Vancouver had a massive freeway project planned that would have wrapped around the waterfront & decimated inner-city neighborhoods.
The difference is that in Vancouver, it never came to full fruition.
1/3🧵
15.09.2025 04:07 — 👍 3 🔁 2 💬 1 📌 0
"Environmentalism without class struggle is just gardening."
— Chico Mendes
09.07.2025 20:48 — 👍 1 🔁 0 💬 0 📌 0
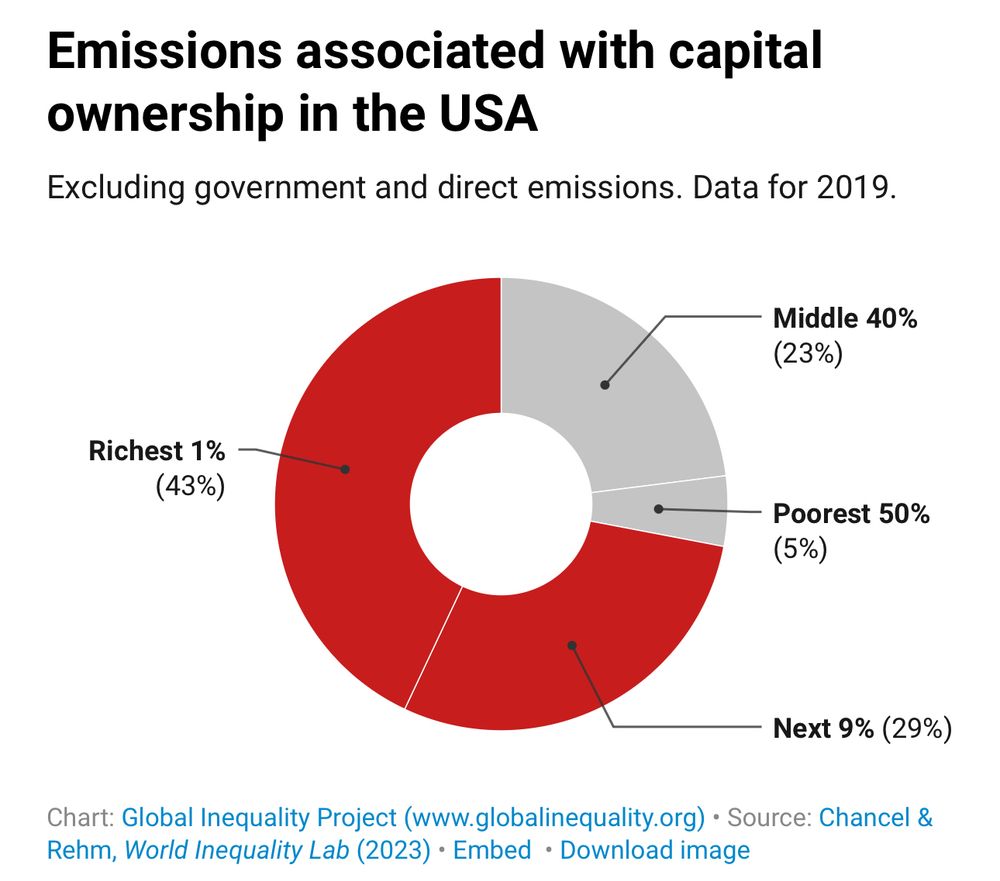
A donut chart shows the share of U.S. emissions linked to capital ownership by income group, excluding government and direct emissions (2019 data). The breakdown is as follows:
• Richest 1%: 43% of emissions (highlighted in dark red)
• Next 9%: 29%
• Middle 40%: 23%
• Poorest 50%: 5%
Source: Global Inequality Project (www.globalinequality.org), based on data from Chancel & Rehm, World Inequality Lab (2023).
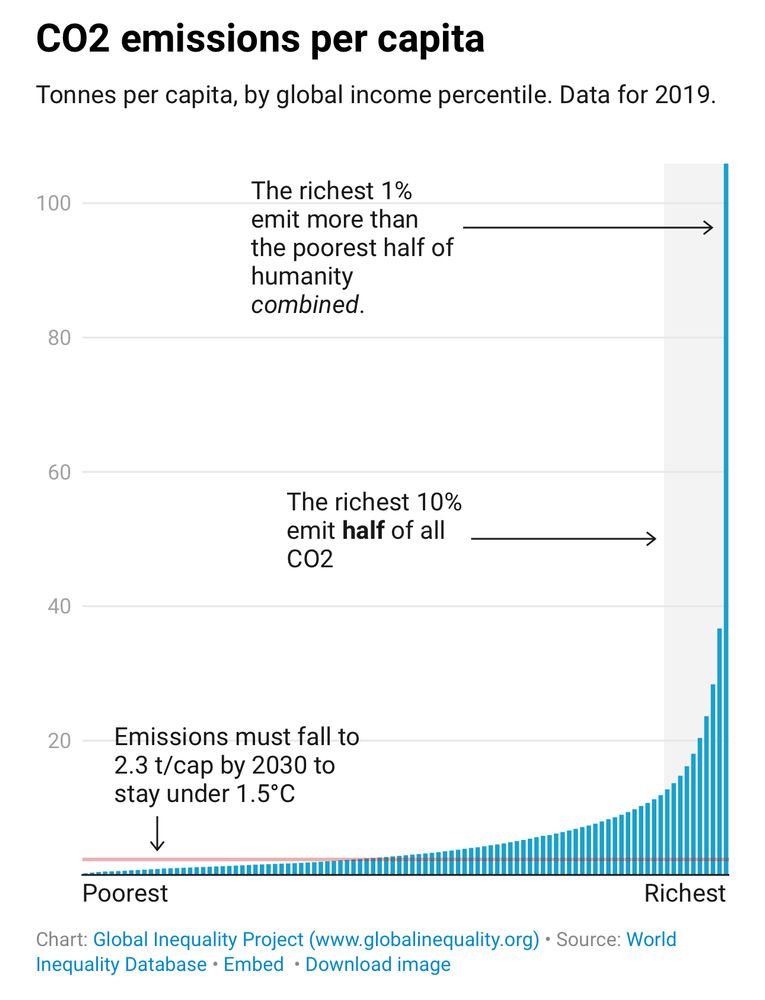
It’s not your fault climate change is happening.
No amount of recycling, biking to work, or eating vegan meals will stop what’s happening.
The 1% treat Earth like their playground, to exploit & amass wealth. This can only be fixed by restructuring & democratizing our economy.
09.07.2025 20:48 — 👍 1 🔁 0 💬 2 📌 0
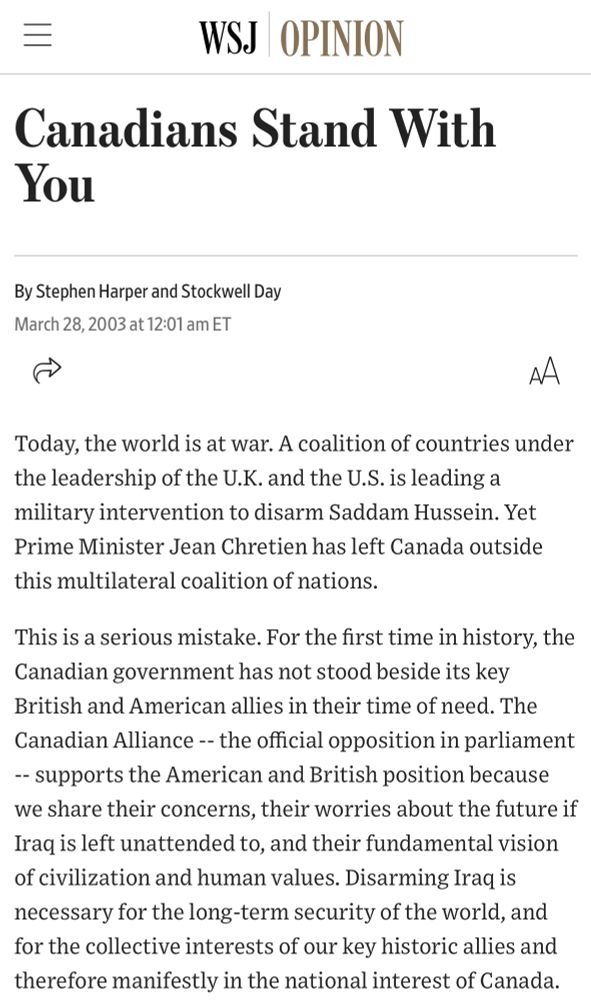
An article by Stephan Harper and Stockwell Day titled “Canadians Stand With You”
The first sections read:
“Today, the world is at war. A coalition of countries under the leadership of the U.K. and the U.S. is leading a military intervention to disarm Saddam Hussein. Yet Prime Minister Jean Chretien has left Canada outside this multilateral coalition of nations.
This is a serious mistake. For the first time in history, the Canadian government has not stood beside its key British and American allies in their time of need. The Canadian Alliance -- the official opposition in parliament - supports the American and British position because we share their concerns, their worries about the future if Iraq is left unattended to, and their fundamental vision of civilization and human values. Disarming Iraq is necessary for the long-term security of the world, and for the collective interests of our key historic allies and therefore manifestly in the national interest of Canada.”
As Canada cheers on Israel’s war, remember that this is what Stephen Harper wrote after Jean Chrétien refused to join the Iraq war.
As usual, Conservatives were on the wrong side of history, and unfortunately Mark Carney seems to be taking more notes from Harper than Chrétien.
18.06.2025 19:17 — 👍 3 🔁 0 💬 1 📌 0

Tweet that states: “We should be helping the Iranian people overthrow their government. The majority of Iranians want to be with the West.”
After Iraq and Afghanistan, you’d think that Americans would learn that regime change doesn’t work.
If strikes on Iran continue, what will inevitably happen is a rally around the flag effect where hatred of the west and the influence of hardliners and radicals will flourish.
17.06.2025 16:24 — 👍 0 🔁 0 💬 0 📌 0
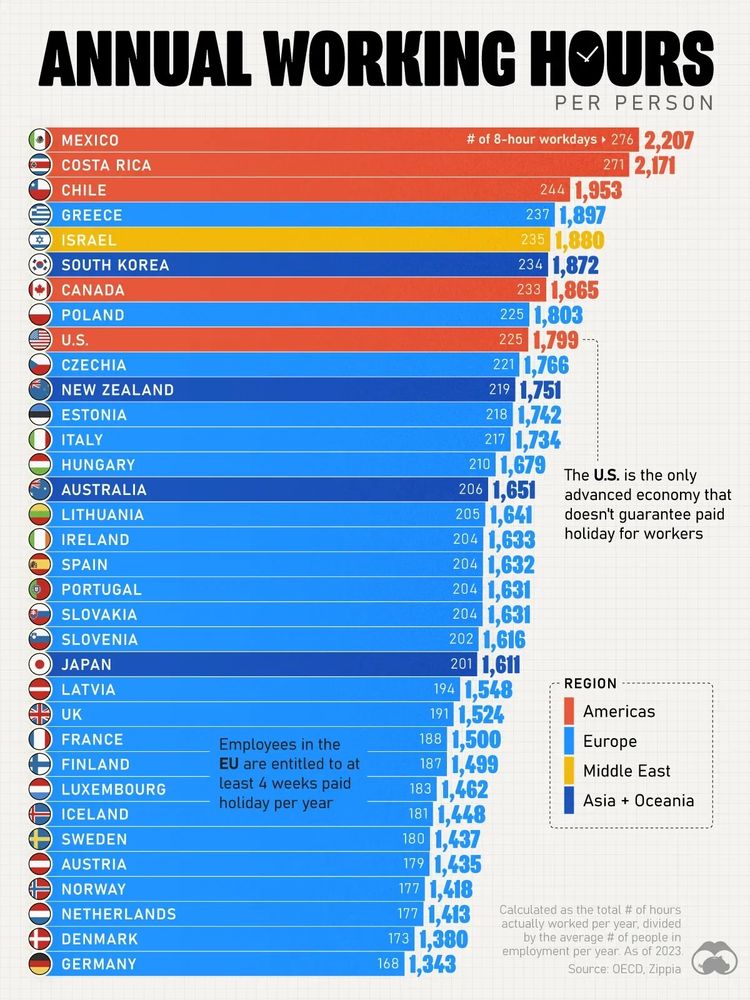
Chart showing working hours per country, with the USA higher than most of Europe. The chart also notes that the USA is the only advanced economy that doesn’t guarantee paid holiday for workers.
Also, wealth in this sense isn't even a good metric for quality of life - Americans work way more hours for less benefits than Europeans and are thus "richer" in one sense, but are more miserable.
4/4
10.06.2025 22:51 — 👍 1 🔁 0 💬 0 📌 0
GDP, which includes money that the average person never sees via manufacturing and industry, doesn't reflect the wealth of the average person. On top of that, being a tax haven causes an influx of corporations who are based somewhere only on paper, which skews statistics.
3/4
10.06.2025 22:51 — 👍 0 🔁 0 💬 1 📌 0
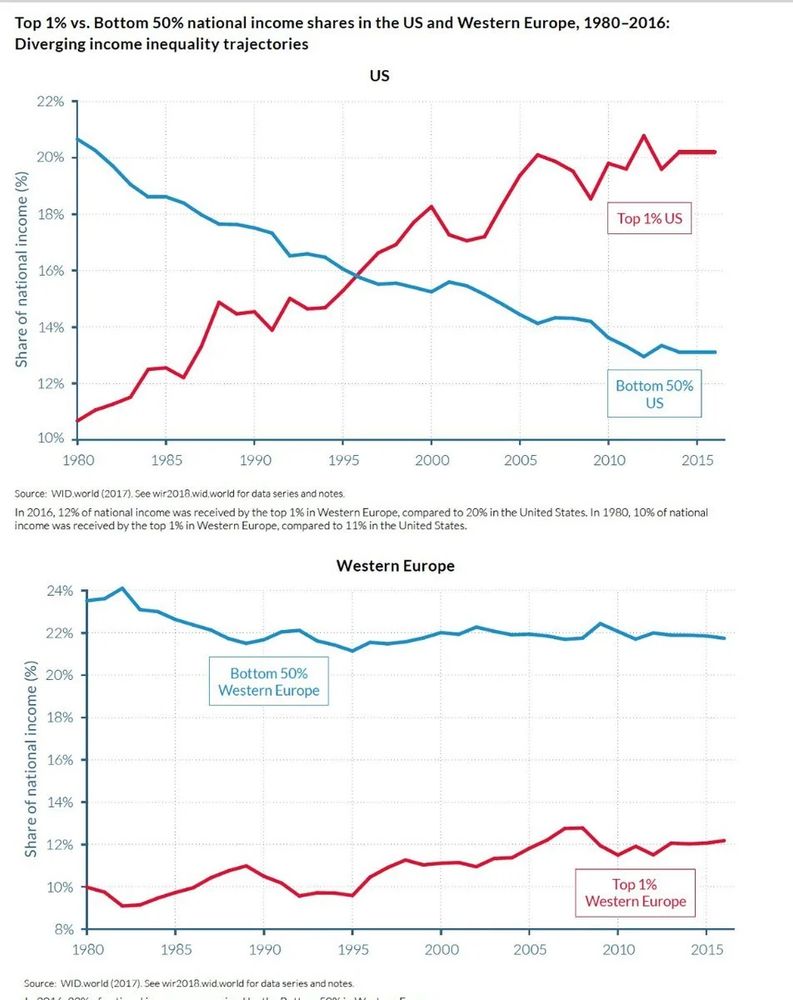
Two line graphs compare the share of national income held by the top 1% and the bottom 50% in the United States and Western Europe from 1980 to 2016.
Top Graph (United States):
• Title: “US”
• Y-axis: “Share of national income (%)”, ranging from 10% to 22%
• Two lines:
• Top 1% US (red line): Starts near 10% in 1980 and steadily rises to about 20% by 2016.
• Bottom 50% US (blue line): Starts above 20% in 1980 and declines to about 12% by 2016.
• The two lines cross around 1995, indicating a shift where the top 1% began earning more than the bottom 50%.
Bottom Graph (Western Europe):
• Title: “Western Europe”
• Y-axis: “Share of national income (%)”, ranging from 8% to 24%
• Two lines:
• Bottom 50% Western Europe (blue line): Stays relatively stable, around 22% from 1980 to 2016.
• Top 1% Western Europe (red line): Starts around 10% and increases slightly to about 12% by 2016.
Overall Message:
• The US has experienced a sharp divergence in income distribution, with the top 1% overtaking the bottom 50%.
• In contrast, Western Europe has maintained a relatively stable and more equitable distribution over the same period.
Most obviously, when you don't take into account inequality in wealthy distribution, while AVERAGE (mean) wealth may be higher in one place, because of a more unequal distribution, MEDIAN wealth could be way lower, as is the case with the U.S.'s insane wealth inequality.
2/4
10.06.2025 22:51 — 👍 0 🔁 0 💬 1 📌 0
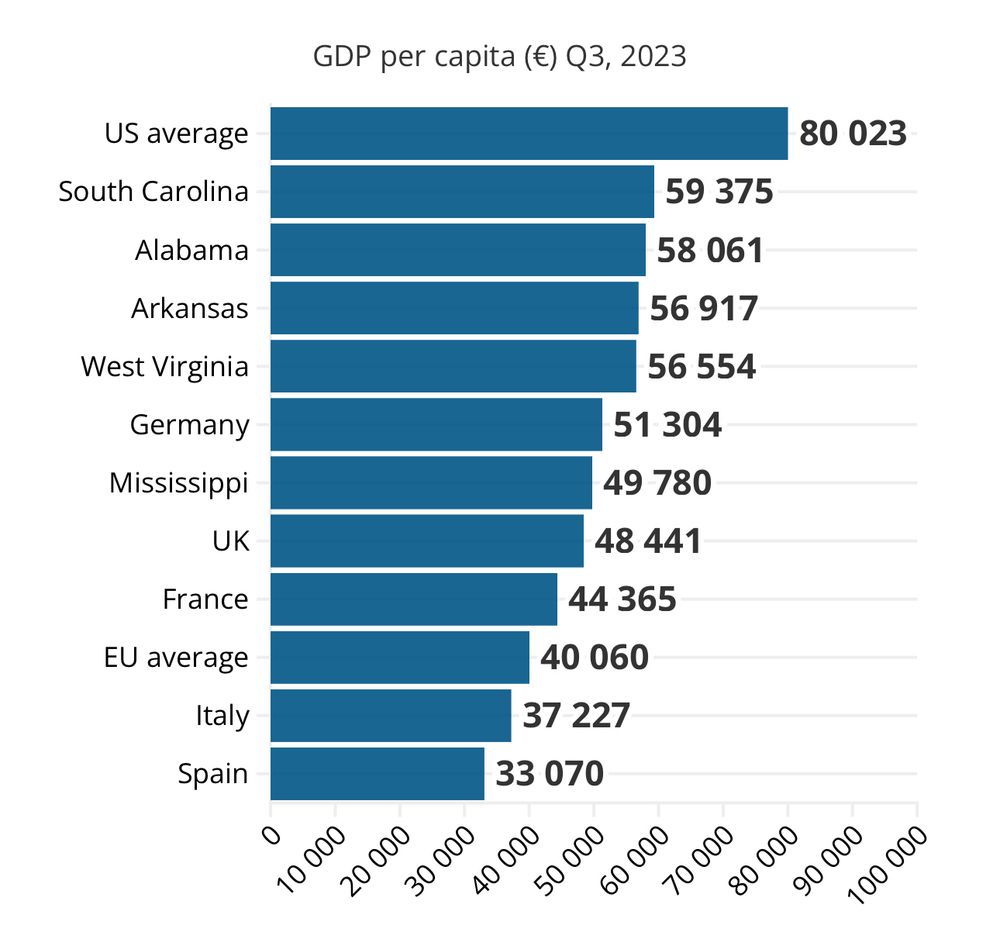
Chart showing GDP per capita comparing Western European countries to Southern US states
I keep hearing the claim: "Europe/Canada is poorer than Mississippi - the poorest U.S. state"
This is untrue. GDP per capita is a terrible metric for prosperity that doesn’t take inequality, tax havens, manufacturing/industry, labour regulations, and more into account.
1/4🧵
10.06.2025 22:51 — 👍 1 🔁 0 💬 1 📌 0
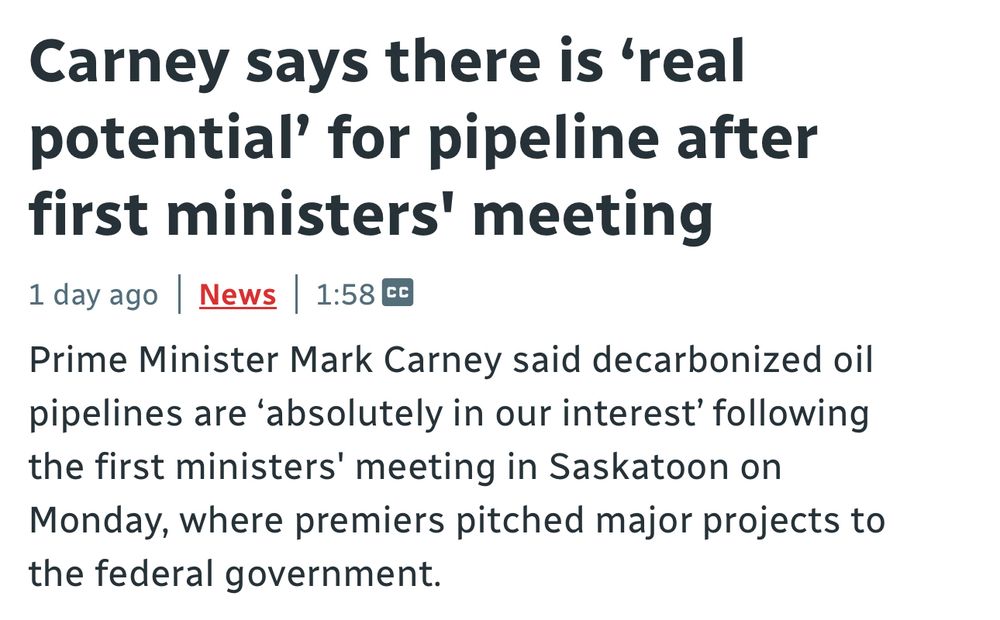
CBC title: “Carney says there is 'real potential' for pipeline after first ministers' meeting”
Sub-heading: “Prime Minister Mark Carney said decarbonized oil pipelines are 'absolutely in our interest' following the first ministers' meeting in Saskatoon on Monday, where premiers pitched major projects to the federal government.”
As the prairies burn, it’s unfortunate to see our PM greenwash & promote “decarbonized” oil pipelines.
You can make production/transport cleaner, but the combustion of oil, the source of 70-80% of emissions, will always emit CO2.
“Decarbonized oil” is about as ridiculous as “deoxygenated water”.
06.06.2025 20:10 — 👍 1 🔁 2 💬 0 📌 1
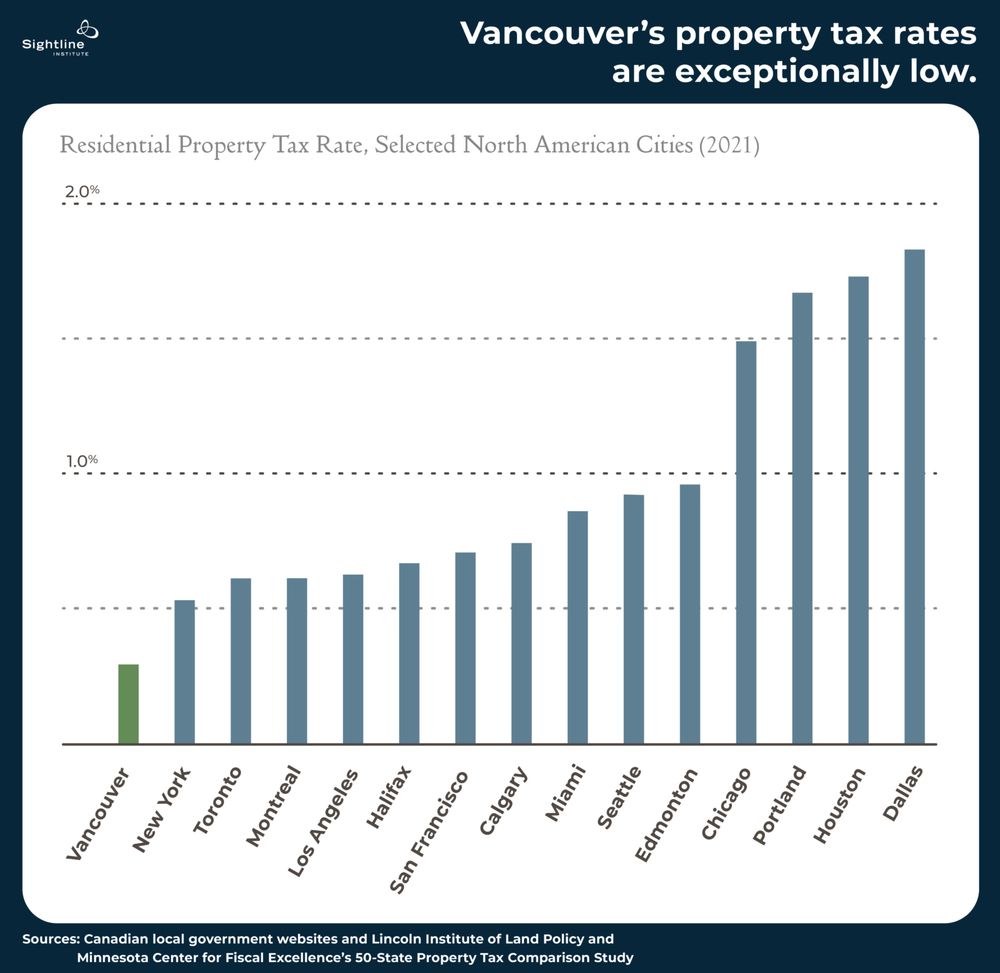
When examining high development charges, underfunded municipal services, housing speculation, & other shortfalls cities face, it becomes apparent that raising property taxes (which here in Vancouver are the lowest in NA) would solve many of our problems.
Graph credit: Sightline Institute
27.05.2025 03:44 — 👍 1 🔁 0 💬 0 📌 0
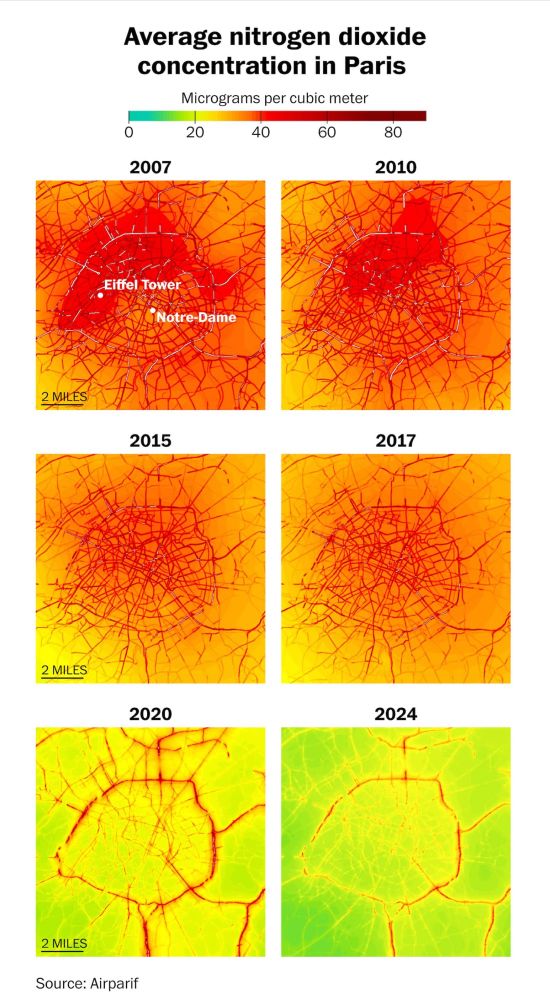
A series of six heat maps from the article “Paris said au revoir to cars. Air pollution maps reveal a dramatic change” shows the average nitrogen dioxide concentration in Paris from 2007 to 2024. Each map uses a color scale from green (low concentration, 0 micrograms/m³) to dark red (high concentration, 80+ micrograms/m³).
• 2007 & 2010 maps show mostly dark red and orange zones, indicating high pollution, especially in the city center.
• 2015 & 2017 maps still show high concentrations but slightly more yellow, suggesting a modest improvement.
• 2020 map shows a dramatic shift toward yellow, with red concentrated only along major roads.
• 2024 map is predominantly green and yellow, with red only along the most trafficked routes, indicating much cleaner air overall.
Notable landmarks like the Eiffel Tower and Notre-Dame are labeled on the 2007 map for reference. A 2-mile scale is provided on each map. Source: Airparif.
Cities aren’t smoggy - Cars cause smog
Cities aren’t loud - Cars are loud
Busy streets aren’t dangerous - Cars are dangerous
When you plan for less cars, you get cleaner, quieter, safer cities.
23.05.2025 23:15 — 👍 2 🔁 0 💬 0 📌 0
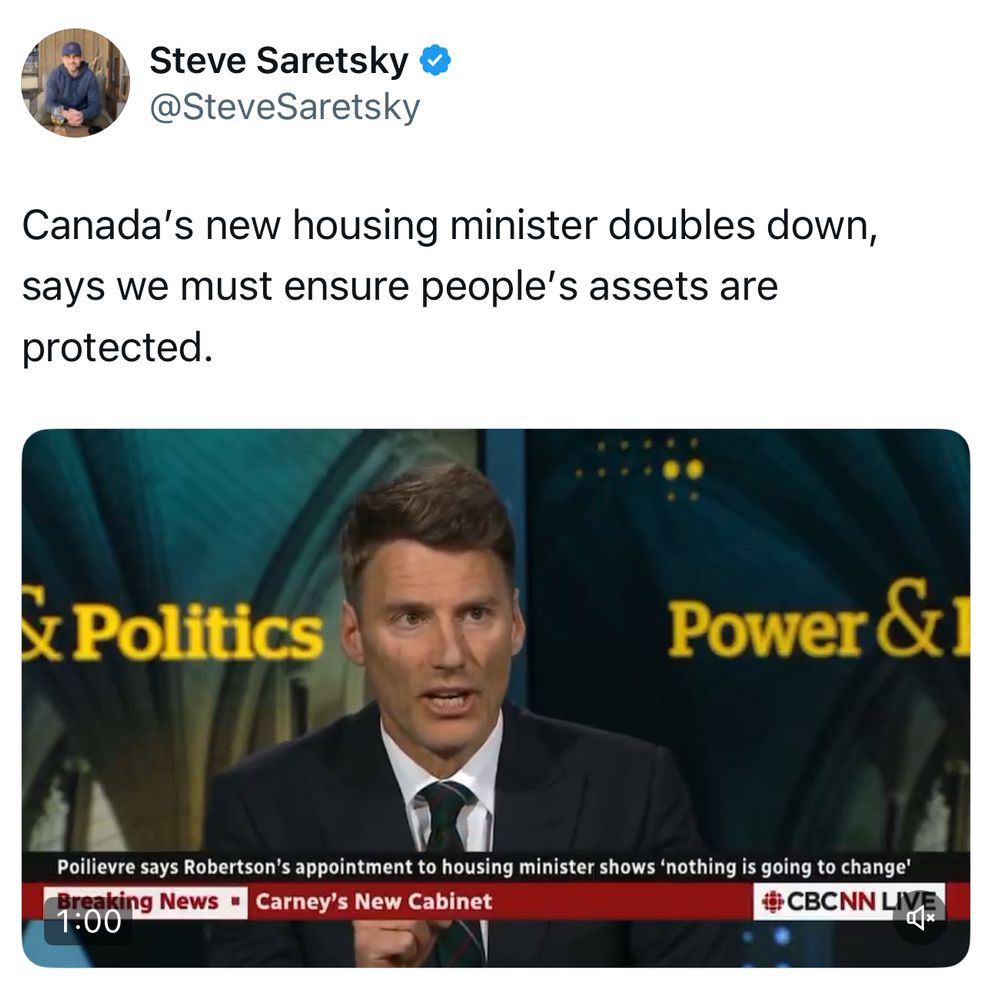
Tweet showing CBC clip with the text reading “Canada’s new housing minister doubles down, says we must ensure people’s assets are protected.”
This is the reason young people will never own a home.
It may be politically inconvenient, but it’s true: Society has no obligation to protect your overvalued investments.
If you disagree, you can’t honestly say you want housing to be affordable.
Costs need to come down.
23.05.2025 23:08 — 👍 0 🔁 0 💬 0 📌 0
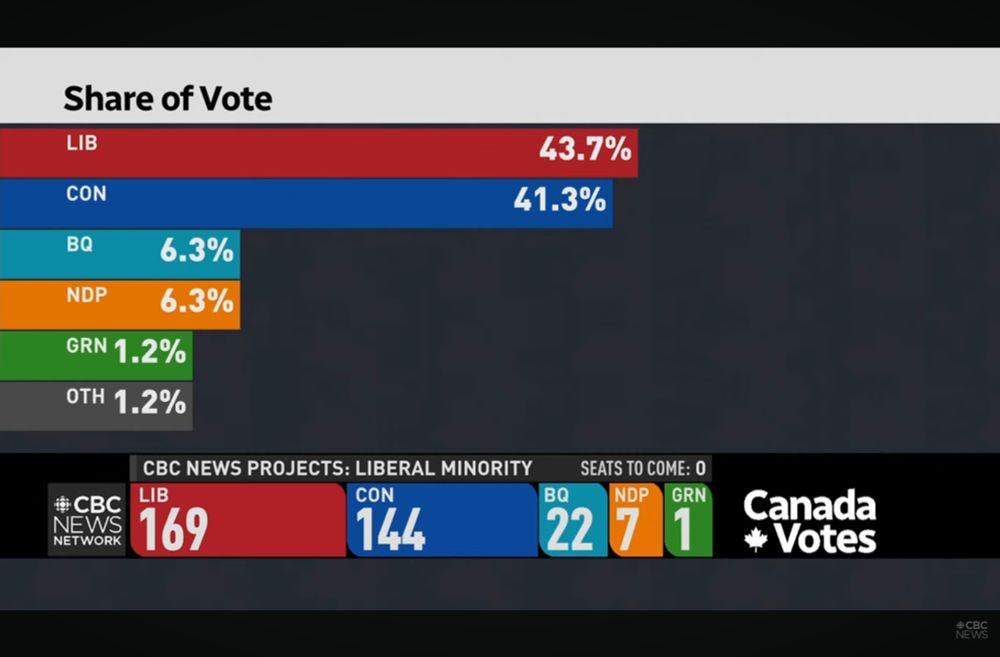
First Past the Post in action.
The NDP and the Bloc have the same vote share (which is admittedly abysmal) but the Bloc get over TRIPLE the number of seats of the NDP.
We need Proportional Representation.
29.04.2025 21:01 — 👍 2 🔁 1 💬 0 📌 0

Ridings: Edmonton Griesbach, Elmwood-Transcona, Skeena-Bulkley Valley, North Island-Powell River, Cowichan-Malahat-Langford
These are some of the most disappointing results from the election.
These are all NDP-incumbent seats where enough traditional NDP voters voted Liberal to elect Conservatives due to vote-splitting.
“Strategic voting” wasn’t so strategic after all.
29.04.2025 20:49 — 👍 3 🔁 1 💬 0 📌 1
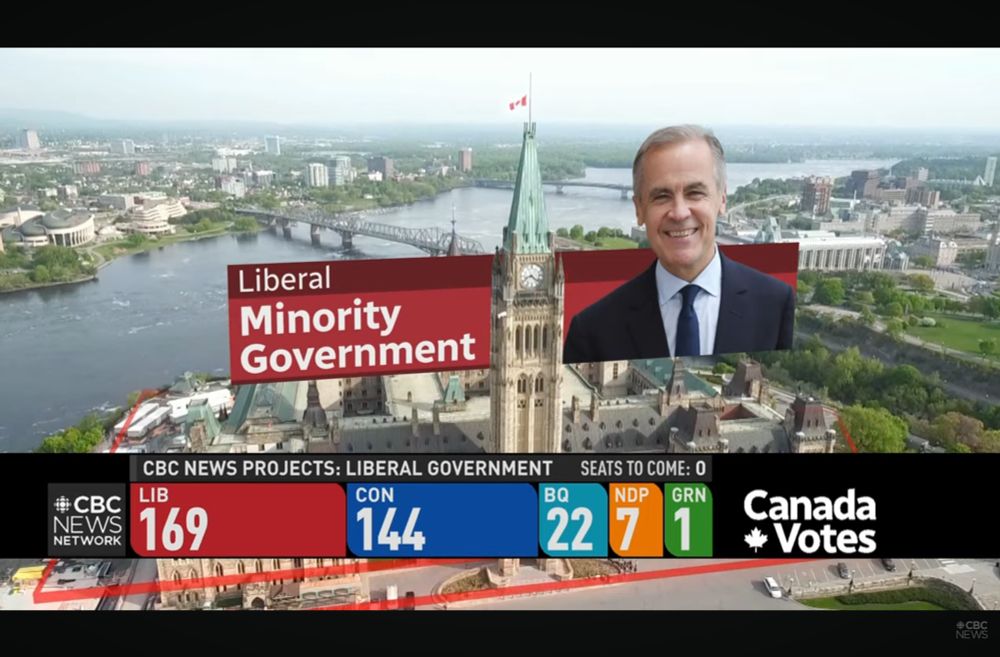
The NDP will be able to have pretty outsized influence and hold the balance of power as ~169+7=Majority of seats.
We also won't be thrown into an election anytime soon: The NDP doesn't have a leader, and Pierre Poilievre is (at least for now) no longer Leader of the Opposition.
29.04.2025 20:39 — 👍 1 🔁 0 💬 0 📌 0
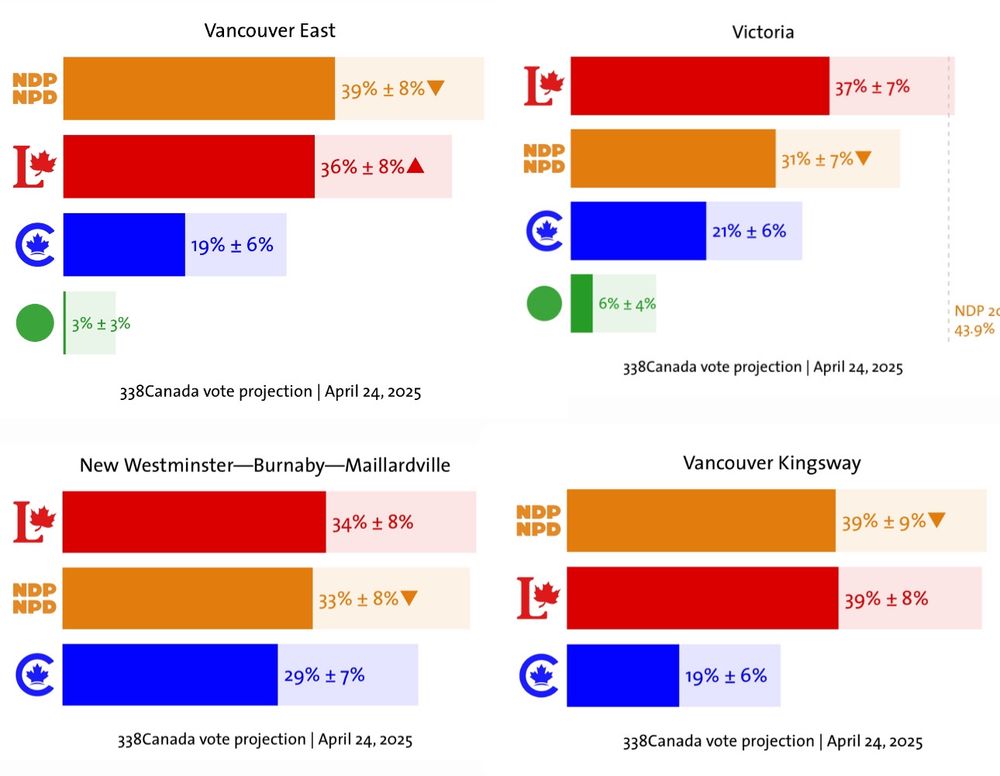
338Canada projections showing various ridings (Vancouver East, Victoria, New Westminster-Burnaby-Maillardville, and Vancouver-Kingsway) where the Conservatives are in third place, indicating races between the NDP and the Liberals.
Also, if you live in an urban riding (below are examples in BC) & are thinking of voting strategically, there’s a good chance the Conservatives aren’t even a threat.
These races are really NDP vs Liberal, in which case, there's no reason to not vote NDP if you're a progressive.
25.04.2025 01:35 — 👍 3 🔁 1 💬 0 📌 0

338Canada projections showing various ridings on Vancouver Island (Cowichan-Malahat-Langford, Courtenay-Alberni, North Island-Powell River, and Esquimalt-Saanich-Sooke) where the Conservative’s are in the lead, followed by the NDP, then the Liberals.
For my friends on Vancouver Island:
Vote NDP to stop the Conservatives.
These are all seats with NDP incumbents, yet what’s happening is that NDP voters are voting Liberal to try and stop the Conservatives, not know that they are actually helping them by splitting the vote.
25.04.2025 01:35 — 👍 2 🔁 0 💬 2 📌 0
OpenAl/Meta use so much more hardware, have 100x more financial and human resources, and still manage to create a worse final product.
www.ftc.gov/system/files...
2/2
28.01.2025 00:34 — 👍 1 🔁 0 💬 0 📌 0
How did U.S. tech giants get outflanked by a small Chinese side-project that made an Al model better than ChatGPT?
As Lina Khan argued, monopolies stifle innovation by focusing on consolidation of political power and end up creating vulnerabilities and inefficiencies.
1/2
28.01.2025 00:34 — 👍 3 🔁 0 💬 1 📌 0
Trudeau obviously isn't the first PM to prorogue Parliament for self-serving reasons, and also won't be the last, but I see the fact that the PM has the power to bring the entire legislative branch of government to a halt (as long as the GG agrees) as a massive flaw of the Canadian political system.
07.01.2025 02:35 — 👍 3 🔁 0 💬 0 📌 0
…
The solution is to crack down on corporations that abuse the program and enact more labour protections for immigrant workers.
(And fellow Canadians, this applies to Canada’s Temporary Foreign Workers Program too.)
(3/3)
05.01.2025 06:20 — 👍 3 🔁 0 💬 0 📌 0
…of more easily exploitable workers who may overwork to avoid the risk of deportation. This also leads to suppressed wages in certain industries, while corporations pay out less benefits, increasing their bottom line.
…
(2/3)
05.01.2025 06:20 — 👍 2 🔁 0 💬 1 📌 0
To add to the H-1B discourse, I think two things can be true at once:
1. America thrives by welcoming talented people from all over the world, and there should be a non-exploitative, fair process for immigrants workers.
2. Many corporations abuse the H-1B program to create a underclass…
(1/3)
05.01.2025 06:20 — 👍 4 🔁 1 💬 1 📌 0
OneCity fights for affordable housing, climate action, public safety and family services.
Follow City Councillor Lucy Maloney & VSB trustee Jennifer Reddy.
www.onecityvancouver.ca
Vancouver journalist. Currently decompressing after going to 52 countries in 52 weeks. Strives to tell unique stories.
http://moremcbarges.ca
http://instagram.com/justindmcelroy
Award-winning author of The Antunite Chronicles (Antifascist Allegorical Fiction), Satirist, Professor, Humanist, Democracy Defender, Resister to Authoritarian Rule, Writing for freedom, Check out my humorous Orwellian stories. Terrybirdgenaw.wordpress.com
urbanist, transport prof at UBC, doodler, political junkie, explorer/navigator, cat-lover, USPS fan, and cook
Future Community Planner | Community Advocate |
Comox Valley, BC, Canada. Opinions and posts are my own ~ #boycottUSAproducts
TV news producer. Music lover. Sun and sea worshipper. Dad. Partner. Fan of lists…Etc…
Atty, mediator, teacher. Lawrence, KS Advocate, MBA, former uni admin. Spouse:🧑🤝🧑@bsbadger INTJ/ENTJ 🚫DMs 🚫 Porn 🚫 Crypto 🚫 OnlyFans 🚫GoFundMe YES to int. news, sci, law, art, philos, Left pol, philanth, nature
Rental housing, evictions & anti-displacement policy.
Postdoc @curaumn.bsky.social & affiliate at @minnpop.bsky.social & @buoncities.bsky.social
https://www.kentoncard.com/
News and research from Sage Journals at Sage. #SageJournals
journals.sagepub.com
Faculty member at UNBC’s Department of Geography, Earth, and Environmental Sciences. Passionate about education, research, and community impact. Hydrology, fluvial geomorphology, and water resources.
Nature loving, tree hugging, cat mom.
Cheerful Labourer for Nature: advocating for protected areas and supporting access to nature for people of all backgrounds & abilities. Director of Land Management @ Nature Conservancy of Canada (views my own) Quintessential nature nerd. 🇨🇦
- From Lab Science into Science Communication;
- Cork 🇮🇪-> Vancouver 🇨🇦
- Learning Photography 📸
- Researching Mental Health De-Stigmatisation through Video Games 🎮
- Making my way through DUNE ( starting book 5 )
🇵🇷 l Geographer l Community Autogestión l Disasters l Tranformations l Sustainability #Caribbean #LatinAmerica
Assistant Prof in Environmental Governance & Business
University of British Columbia, Forestry & SPPGA
Co-Host @beltandroadpod.bsky.social
Political Ecology, China in Southeast Asia, Sustainable Supply Chains, Rubber, Land Grabs
julietlu.com
researcher, writer, project manager | Dr. of Urban Studies | AuDHD | posts mainly about books, neurodivergence, sustainable transport, writing, and the ocassional kdrama | guardian of a chaotic dog | she/they |📍 Barcelona 🇺🇸🏴🇪🇦
Feminist urban and cultural geographer with interests in urban consumption. Tweeting mostly work and dog. https://scholar.xjtlu.edu.cn/en/persons/liu-cao