Can you share the video?
11.09.2025 12:23 — 👍 3 🔁 0 💬 1 📌 0
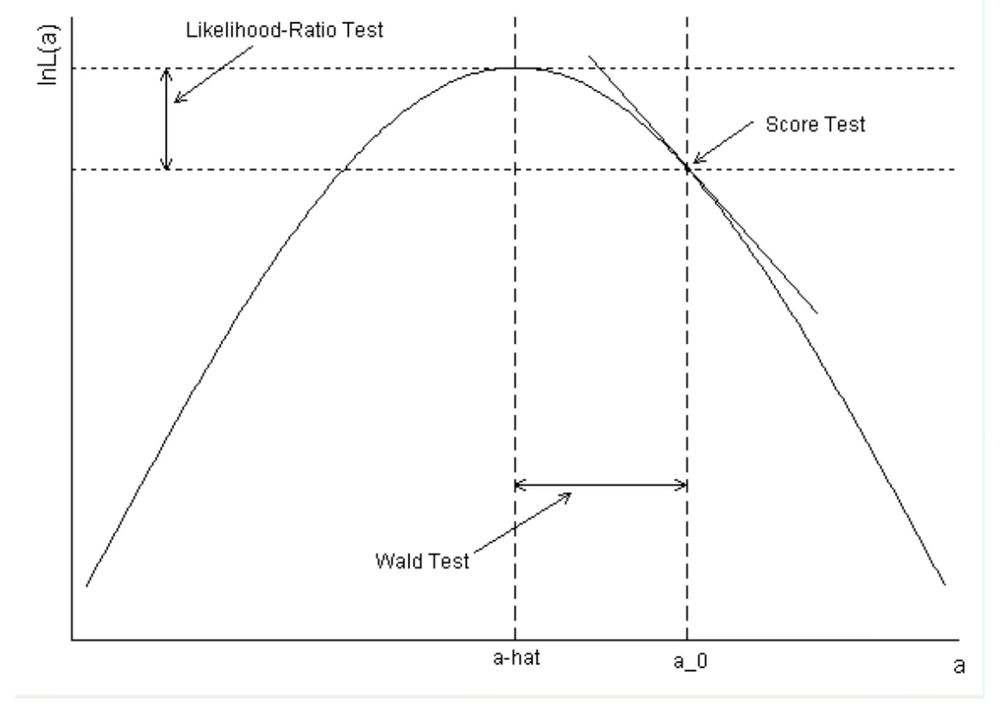
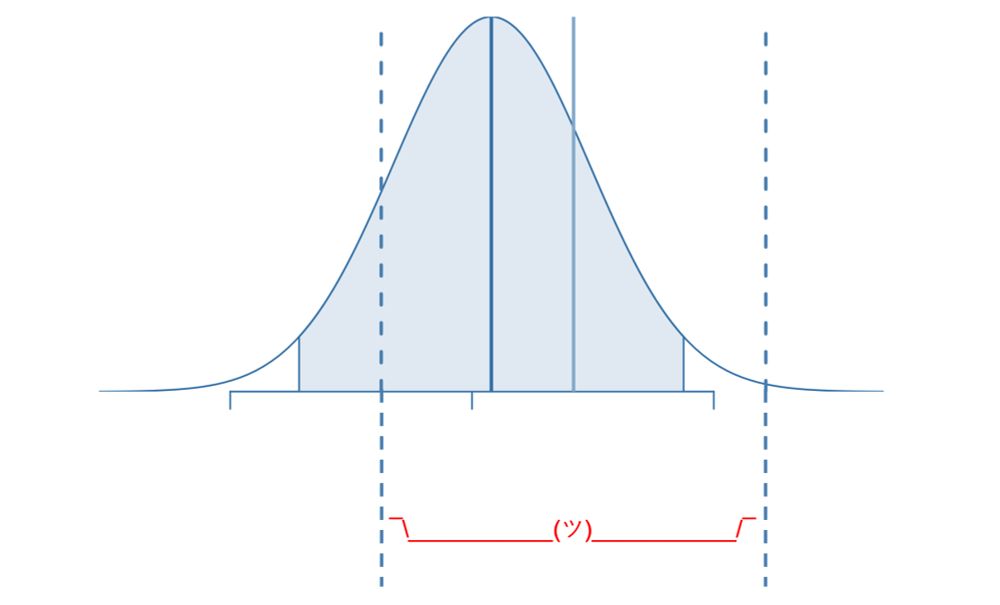
A log likelihood is shown. The quantities for the score, wald, and likelihood tests are illustrated with respect to the log likelihood.
You will be visited by three ghosts
25.12.2024 15:00 — 👍 258 🔁 31 💬 6 📌 3
Folks who are doing survey analysis (e.g., poststratification, etc.) in R using {survey}, how are you doing fancy multilevel stuff? there is no svylmer
11.12.2024 07:29 — 👍 17 🔁 5 💬 6 📌 0
Hot damn if this is as useful as it sounds 💘
11.12.2024 14:19 — 👍 13 🔁 2 💬 1 📌 0
I would suggest finding some starter packs and following them!
09.12.2024 18:36 — 👍 1 🔁 0 💬 1 📌 0
Still figuring it out myself
09.12.2024 18:28 — 👍 1 🔁 0 💬 1 📌 0
APA PsycNet
📊New study published in Emotion sheds light on affect dynamics in depression. Analysis of 842 adults over 56 days shows negative affect becomes more 'sticky' rather than unstable. This suggests emotional predictability, not instability, may be key. psycnet.apa.org/record/2025-...
06.12.2024 02:15 — 👍 40 🔁 7 💬 2 📌 1
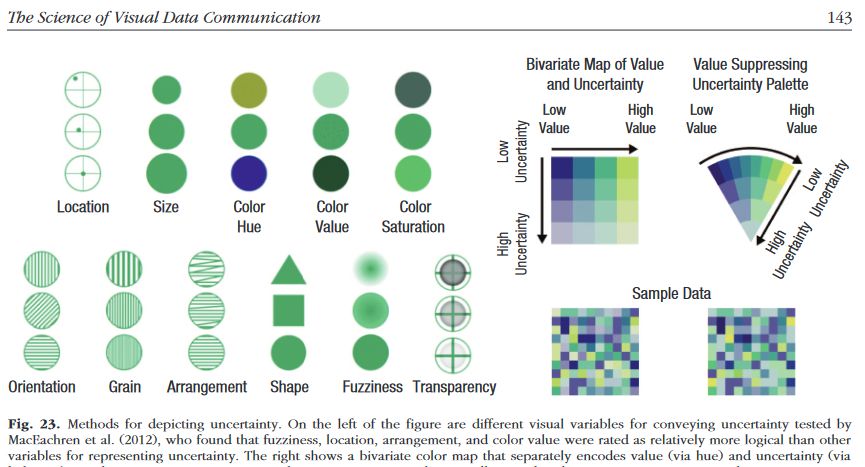
📊 #dataviz A couple of years old, but still worth reading--
The Science of Visual Data Communication: What Works
A very thorough review of ideas and evidence
by @SteveFranconeri, @LacePadill and others.
journals.sagepub.com/doi/epub/10....
06.12.2024 01:10 — 👍 64 🔁 15 💬 2 📌 0

Doing a deeper dive into reflective vs. formative modeling, thanks to some wonderful reviewers.
#StatsSky #AcademicSky
pdfs.semanticscholar.org/d156/8a44bb3...
05.12.2024 21:19 — 👍 6 🔁 2 💬 0 📌 0
OSF
🚨 New preprint alert! 🚨
Our latest study focuses on identifying adolescents at heightened risk of developing depression by examining how emotion regulation dynamics during this critical developmental period predict future symptoms. osf.io/preprints/ps...
29.11.2024 19:47 — 👍 20 🔁 9 💬 1 📌 2
What would a “validity movement” look like in your area? In mine, I’d list these top 4:
- chase down the meaning of established signals with many different methods
- better description
- explore why diff methods converge or diverge on same questions
- question narratives for current signal
You?
28.11.2024 16:12 — 👍 12 🔁 3 💬 4 📌 1
📌
27.11.2024 22:15 — 👍 0 🔁 0 💬 0 📌 0
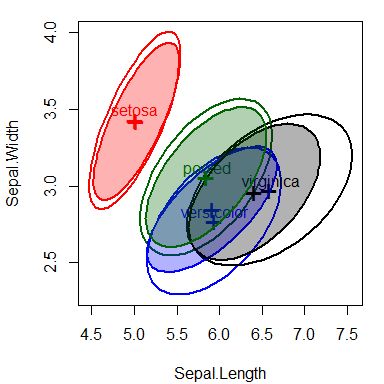
Data ellipses (both classical and robust) for Sepal.Length and Sepal.Width in the iris data, by species.
The grey ellipses show the pooled, with-group covariance matrix.
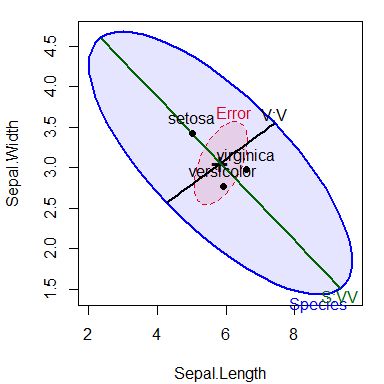
HE plot for the multivariate effect of Species, Sepal.Length and Sepal.Width in the iris data, together with hypothesis tests for two contrasts (which plot as lines)
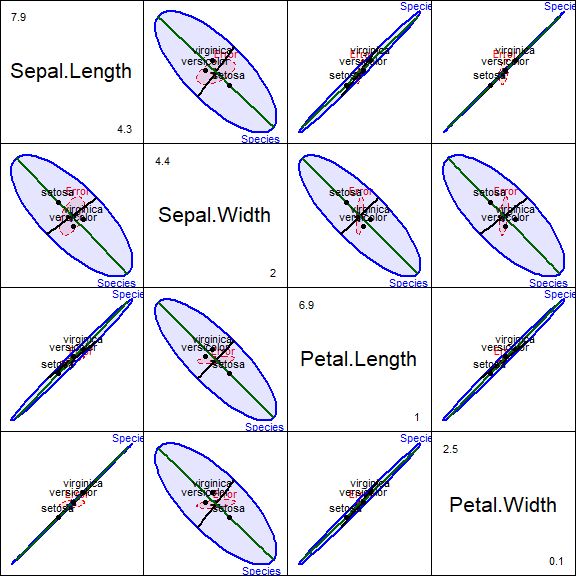
All pairwise HE plots for the variables in the iris data
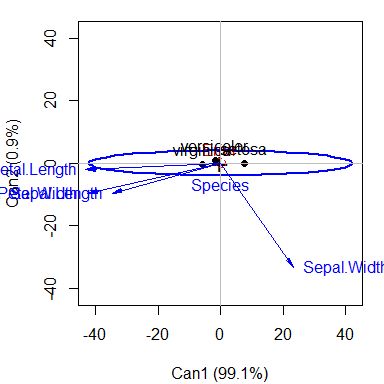
HE plot for iris data in canonical space. Differences among species nearly entirely confined to one dimension.
#rstats #StatSky Want to understand/explain the results of multivariate tests for linear models?
The {heplots} 📦 visualizes these as ellipsoids for hypothesis end error matrices for an lm(). V 1.7.1 now on #CRAN
{candisc} 📦 shows these in simpler canonical space
🔗See: friendly.github.io/heplots/
24.11.2024 19:32 — 👍 32 🔁 11 💬 1 📌 0
At first, I thought you meant you pick a side every night randomly and that sent me into a panic
25.11.2024 01:00 — 👍 1 🔁 0 💬 1 📌 0
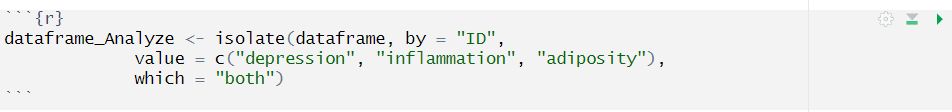
On today's edition of "Sh*t I wish I knew 8 years ago"
Simple "isolate" function from blml package to get within- and between-person centered versions of a list of variables.
H/t to kzee.github.io/Centering_De...
#Rstats #AcademicSky
23.11.2024 17:47 — 👍 25 🔁 6 💬 1 📌 0
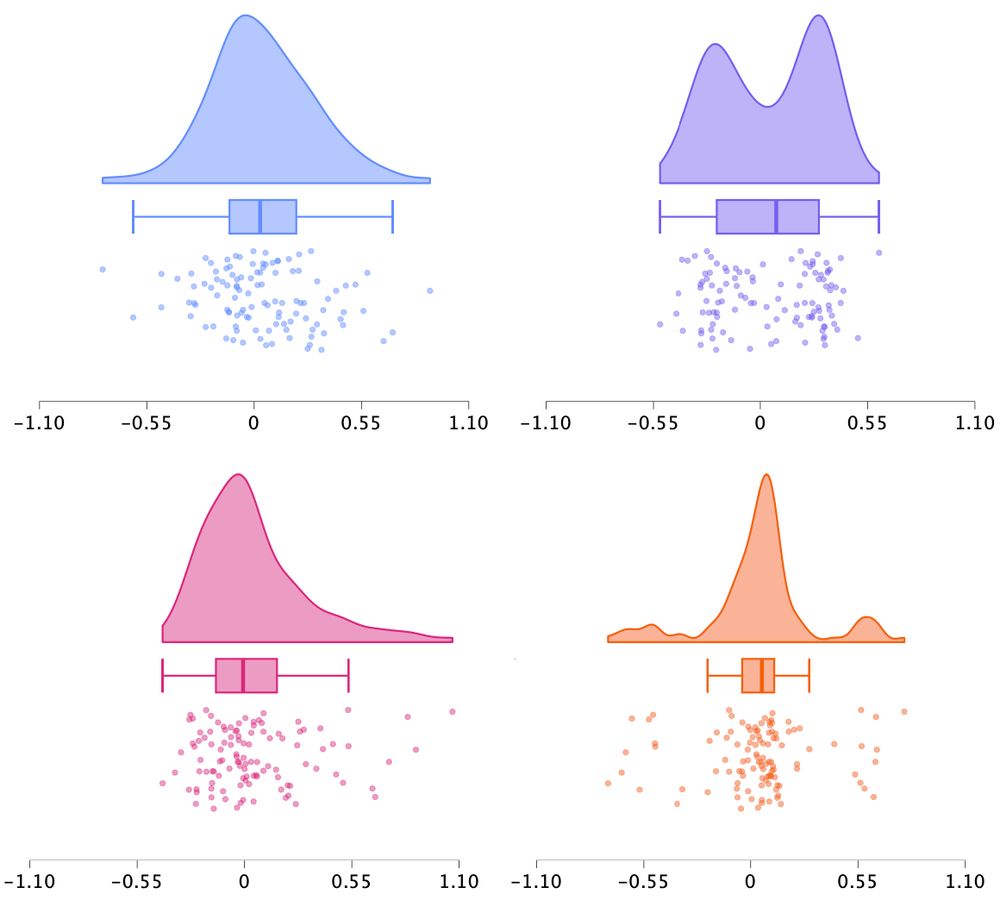
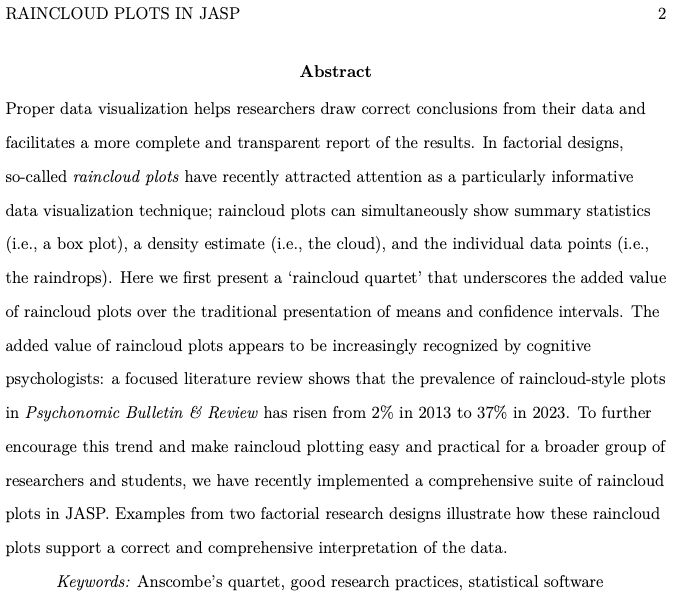
Four raincloud plots: a normal distribution, bimodal, skewed, and one riddled with outliers. Popular sample statistics are identical so that mere plotting of the identical means and confidence intervals would miss these qualitative differences.
abstract of pre-print
The Raincloud Quartet (new pre-print)
All N = 111, M = 0.04, SD = 0.27.
One-sided t-tests vs. 0 yield: t(110) = 1.67, p = .049.
Only raincloud plots reveal the qualitative differences, preventing the drawing of inappropriate conclusions.
How did we create the quartet?
Where are data & code?
🧵👇
23.11.2024 13:17 — 👍 128 🔁 39 💬 10 📌 4
In case no one has told you, go watch Wicked.
22.11.2024 20:32 — 👍 2 🔁 0 💬 0 📌 0
Goose chase meme.
Top Panel: Suspicious goose asks "biased relative to what?"
Bottom Panel: Goose is chasing a man, yelling "Biased relative to what?"
When a study talks about various things that could bias estimates but never explicitly addresses the analysis goal in the first place
20.11.2024 04:24 — 👍 134 🔁 22 💬 5 📌 2
$150-$250/hr as the other reply says
20.11.2024 04:40 — 👍 0 🔁 0 💬 0 📌 0
We’ve got everything here
19.11.2024 14:59 — 👍 0 🔁 0 💬 0 📌 0
Great to see this paper out!
'Simulation studies for methodological research in psychology: A standardized template for planning, preregistration, and reporting.'
Journal: doi.org/10.1037/met0...
Accepted: osf.io/preprints/ps...
18.11.2024 11:43 — 👍 27 🔁 7 💬 2 📌 1
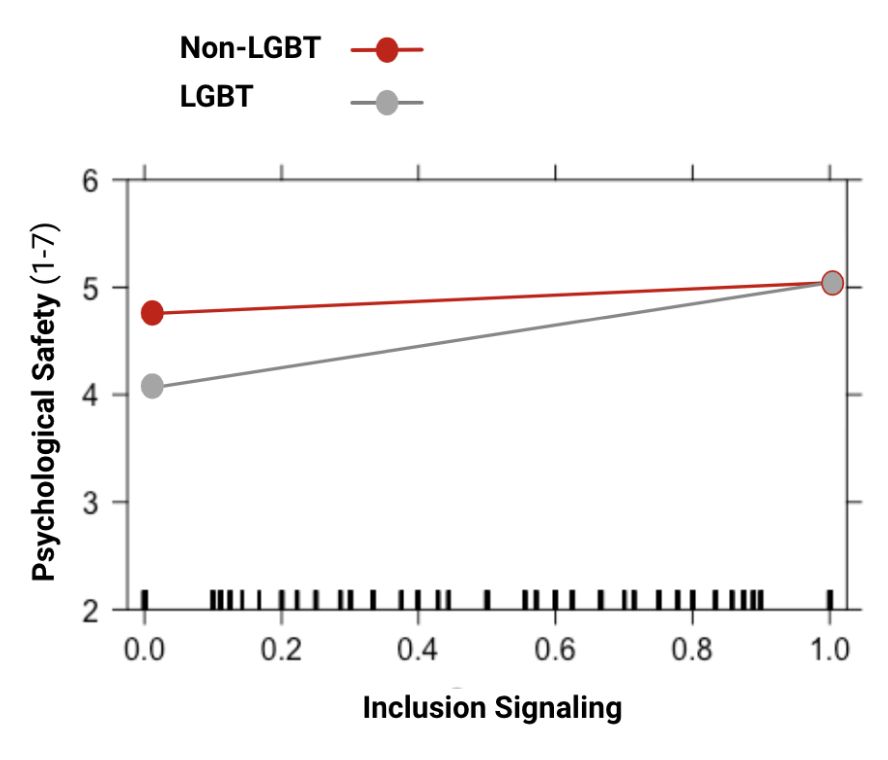
Line plot showing Main effect of Organization-level Inclusion Signaling on LGBT and non-LGBT Employees in Study 1
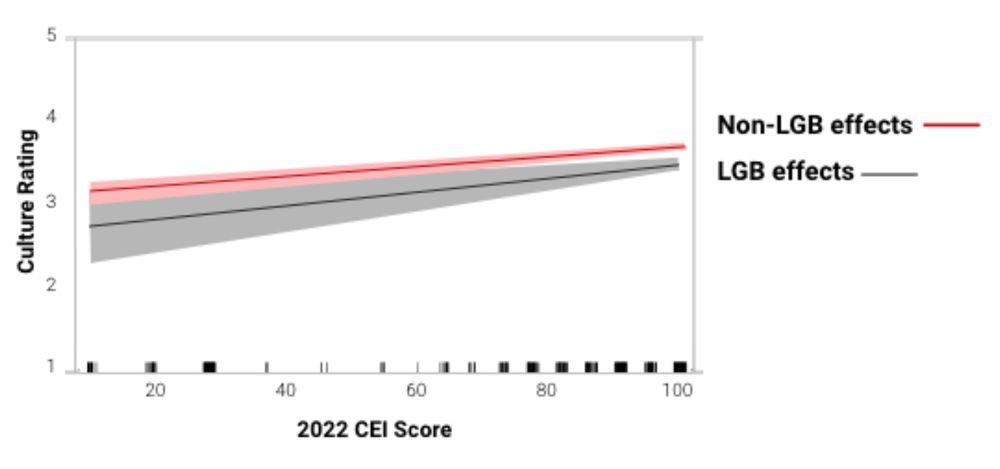
More inclusive companies are seen as having a better culture for both LGB and non-LGB people
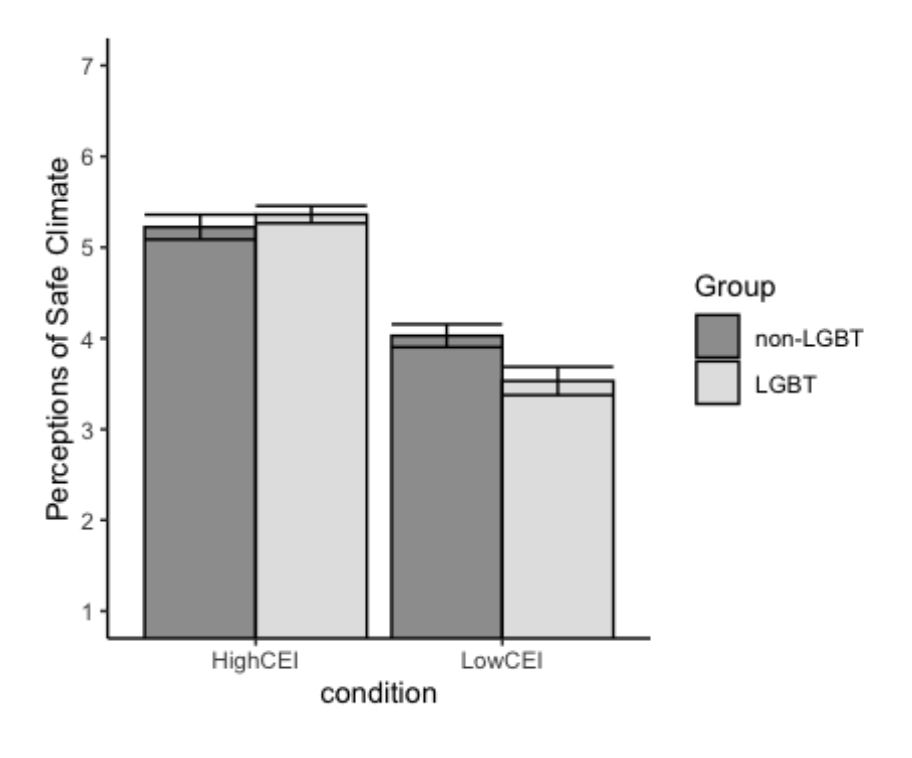
Bar graph with experimental results showing that inclusive signals benefit both non-LGBT and LGBT participants
Using a mix of observational and experimental methods, organization-level inclusion signals had positive effects for both LGBT and non-LGBT employees
osf.io/preprints/ps...
#socialpsyc #psychology #PsychSciSky #prejudice
18.11.2024 14:20 — 👍 23 🔁 9 💬 2 📌 0
You need a better key to translate probability to words.
Then, the logit = log (p/1-p) is just another y axis on this chart
19.11.2024 01:47 — 👍 14 🔁 3 💬 1 📌 1
1 for sure
18.11.2024 22:47 — 👍 0 🔁 0 💬 0 📌 0
Me!
18.11.2024 19:43 — 👍 1 🔁 0 💬 0 📌 0
Assistant Professor at Columbia Psychiatry | Depression and digital mental health in young people
Love nature, writing, arts & crafts, music, community, books, #SciComm, play & growing. Editor Ciadish.co.uk (for chronically ill and #disabled [CIAD] writers & the readers who love their books). Co-founder CripCoop.co.uk mutual support network #CripCoop
Academic. Pleasure activist. Author of Bodyminds Reimagined & Black Disability Politics. Both open access from Duke University Press. She/her.
https://linktr.ee/samischalk
DisCrit-Critical Educator-Black Asian Feminist exploring intersections, searching for Justice-Yogini-Tweets=mine. She/Her Author-Pedagogy of Pathologization 🍉
Scholar of African American religious history & religion and race in America.
Website: https://www.judithweisenfeld.com/
Most recent book: Black Religion in the Madhouse: Race and Psychiatry in Slavery's Wake (NYU 2025)
Poet | current manuscript: Mélusine 🐍 | she/her
1st Black Harley Quinn Writer
Bestselling award winning comic writer
BINGO LOVE | HARLEY QUINN
Kidlit author: MY LITTLE PONY
Screenwriter | Writing Consultant
Disabled | Neurodivergent
They/She
https://linktr.ee/mizteefranklin
Disabled queer mama. Professional over-thinker and wordy writer.
ZinRock.com
author of the award-winning FLOWERS FOR THE SEA. rep Arley Sorg of KT Literary. preliminary editor and sensitivity reader. horror, grimdark, and dark fantasy obsessed. weirdo. Queer Black af depressive. toss a coin? https://ko-fi.com/zinrock
Award-winning author of prose & comics, maker of food and small objects she/her/hers http://nalohopkinson.com
Multi-gendered water elemental (all pronouns, use they/them for myself) pretending to be an ink-stained lycanthrope. Writer-type. Codex, SFWA. Black Lives still matter. I'd apologize for cursing but I'm not actually sorry. More at killerpuppytails.com
Author. Poet. Gothic Academic. PhD. she/her
Codex Writers Group, MLA
Published in: Clarkesworld, Strange Horizons, BCS, Uncanny, Lightspeed (POCDSF) etc
Website: www.mythopoetica.com
Bibliography: https://mythopoetica.com/bibliography/
Chronically ill, LongCovid since 2020. Public health advocate and lived experience expert. Ex-Texan. Medicine, languages, Sociology, & law. Global citizen & polyglot.
Book Reviewer | Book Blogger | Writer | Artist | Editor | 18+ only
Reads: Mostly BIPOC authors- all genres
BSc: Natural Resources- Conservation Rangeland Ecology
BSc: Sustainability
Oregon State University Alum
Master of Arts. Trans Woman. Ace. BDSM Practitioner & Scholar. Optimistic Nihilist. Amateur nuclear physicist. An aging punk who believes violence is necessary to fight oppression. Muay Thai and workouts, still not Super Saiyan. #NAFO 🔞🍁☢️
Disabled Loudmouth.
https://www.canva.com/design/DAFjqA7WtS0/11YO6Ql6Yl9J792_jipiwQ/edit?utm_content=DAFjqA7WtS0&utm_campaign=designshare&utm_medium=link2&utm_source=sharebutton
#DisabilityTooWhite Creator • Founder of Ramp Your Voice!, LLC • #Disability_Rights #Consultant • Social Worker • #Writer
https://www.rampyourvoice.com/
https://www.vilissathompson.com/
http://patreon.com/RampYourVoice
Moya Bailey. Quirky Black Girl. Queer Androgyne. 90s R&B Lover. Teacher. Gatherer. Mozzarella Stick Aficionado.
https://linktr.ee/moyabailey
Retired college principal, learning to write poems. First pamphlet Liven Yourself Up, available through Yaffle's Nest. Dogmother. Living with large vessel vasculitis.