Covid and Flu Can Triple Your Risk of Heart Attack. A new analysis adds to the research about the link between viral infections and heart disease, by Nina Agrawal www.nytimes.com/2025/10/29/w... via @nytimes.com
31.10.2025 11:53 — 👍 17 🔁 12 💬 0 📌 2
@tracieedward.bsky.social
Covid and Flu Can Triple Your Risk of Heart Attack. A new analysis adds to the research about the link between viral infections and heart disease, by Nina Agrawal www.nytimes.com/2025/10/29/w... via @nytimes.com
31.10.2025 11:53 — 👍 17 🔁 12 💬 0 📌 2Awesome, @ryantennant.ca 👏🏻👏🏻👏🏻!
@onschoolsafety.bsky.social

Call for help!
Looking for a HCW who got covid in the workspace, and suffered a consequence (likely long COVID)
For an interview for a piece I am working on.
Anonymity guaranteed.
Thanks for considering!
DM2 open.
This is also ultimately a reminder that school (and bus) air quality is a workplace health and safety issue and that workers have legal rights to breathe safe air at work. Kids have no such legal protection but the WORKERS sure do!!! #NBPoli
29.10.2025 10:48 — 👍 24 🔁 9 💬 1 📌 1this reminds me of a movie.....
28.10.2025 20:28 — 👍 43 🔁 8 💬 2 📌 0
This image shows gauges with the Oct 25 - Nov 7, 2025 Forecast scores for Canada, the provinces, & territories. From left to right: Canada: VERY HIGH - 10.5 Alberta: VERY HIGH - 13.0 British Columbia: VERY HIGH - 10.5 Manitoba: VERY HIGH - 10.7 New Brunswick: SEVERE - 15.1 Newfoundland & Labrador: VERY HIGH - 12.2 North: VERY HIGH - 11.7 Nova Scotia: SEVERE - 15.4 Ontario: VERY HIGH - 10.3 Prince Edward Island: VERY HIGH - 10.2 Quebec: HIGH - 9.4 Saskatchewan: SEVERE - 15.9 A text box reads: "The COVID Forecast is calculated from 3 equally weighted categories: 1) Current infections and spread; 2) Healthcare system impact; 3) Mortality. Within each category there is one sub-category for trends over the most recent week (Trends) and one sub-category for current parameter values relative to a specified baseline (Current values). Trends and current values are weighted equally when determining the final score for a category. All Forecast input data and sources are available here (https://datastudio.google.com/embed/u/0/reporting/42b886cf-d661-488e-b7d8-5c5836b55ab6/page/p_2yqs028mwc). Past Forecast scores are available in the table below. Forecast scores are grouped into 4 ranges: MODERATE (1 to <5, white), HIGH (6 to <10, yellow), VERY HIGH (10 to <15, orange), SEVERE (>15 red)."
Canadian COVID Forecast: Oct 25 - Nov 7, 2025
SEVERE: NB, NS, SK
VERY HIGH: CAN, AB, BC, MB, NL, North, ON, PEI
HIGH: QC
MODERATE: none
About 1 in 126 people in Canada are CURRENTLY infected.
![This image describes the Canadian COVID Forecast for the fourteen-day period between Oct 25 - Nov 7, 2025, which is produced by COVID-19 Resources Canada. Canada’s COVID Forecast outlook is VERY HIGH [decreasing] with a COVID INDEX SCORE of 10.5
About 1 of every 126 people is infected.
Estimated infections this week: 488,600-614,500
What these numbers mean: MODERATE 1-5, HIGH 5-10, VERY HIGH 10-15, SEVERE >15 COMPARED TO THE LOWEST POINT IN THE COVID PANDEMIC IN CANADA
How much higher are key indicators compared to the lowest point in the COVID pandemic in Canada?
Waste water, infections: HIGH; 7.6X higher
Long COVID: HIGH; 6.3X higher
Hospitalizations: VERY HIGH; 13.3X higher
Deaths: VERY HIGH; 10.5X higher
HOW TO HELP:
EVERYONE:
UPDATE vaccines every 6 months
WEAR N95-type masks
AVOID indoor social gatherings
AVOID crowded non-essential places
Who is HIGH RISK
People 60 and older, babies < 1 year, pregnant
ALL AGES: immunocompromised OR medically at-risk OR no vaccine or infection in the last 6 months
Recommendations are based on the COVID-19 Risk Index from the Peterborough ON Public Health Unit
COVID-19 Resources Canada is a grassroots organization of volunteer scientists supporting Canadian COVID responses. Sources, data and methods for the COVID Index are available at www.Covid19Resources.ca](https://cdn.bsky.app/img/feed_thumbnail/plain/did:plc:qbuobwdie7rzq4fburk63aft/bafkreigpeacmqptud5mnrujlgjyoctxg3fsgkav53qkhotpgzuczwiq2yu@jpeg)
This image describes the Canadian COVID Forecast for the fourteen-day period between Oct 25 - Nov 7, 2025, which is produced by COVID-19 Resources Canada. Canada’s COVID Forecast outlook is VERY HIGH [decreasing] with a COVID INDEX SCORE of 10.5 About 1 of every 126 people is infected. Estimated infections this week: 488,600-614,500 What these numbers mean: MODERATE 1-5, HIGH 5-10, VERY HIGH 10-15, SEVERE >15 COMPARED TO THE LOWEST POINT IN THE COVID PANDEMIC IN CANADA How much higher are key indicators compared to the lowest point in the COVID pandemic in Canada? Waste water, infections: HIGH; 7.6X higher Long COVID: HIGH; 6.3X higher Hospitalizations: VERY HIGH; 13.3X higher Deaths: VERY HIGH; 10.5X higher HOW TO HELP: EVERYONE: UPDATE vaccines every 6 months WEAR N95-type masks AVOID indoor social gatherings AVOID crowded non-essential places Who is HIGH RISK People 60 and older, babies < 1 year, pregnant ALL AGES: immunocompromised OR medically at-risk OR no vaccine or infection in the last 6 months Recommendations are based on the COVID-19 Risk Index from the Peterborough ON Public Health Unit COVID-19 Resources Canada is a grassroots organization of volunteer scientists supporting Canadian COVID responses. Sources, data and methods for the COVID Index are available at www.Covid19Resources.ca
Canadian COVID Forecast Oct 25 - Nov 7, 2025
CANADA
VERY HIGH [decreasing]
About 1 of every 126 people is infected.
Compared to lowest point of pandemic in Canada:
-Infections: 7.6 x higher
-Long COVID: 6.3 x higher
-Hospitalizations: 13.3 x higher
-Deaths: 10.5 x higher
In July 2022, a NS teacher shared this photo on social media of a filter from a NS classroom and was harassed to take it down. Nothing has changed since then.
25.10.2025 17:18 — 👍 19 🔁 7 💬 1 📌 0
As bad as COVID-19 was, the authors of a new book on pandemic planning believe we got off lightly, @crof.bsky.social writes.🦠
25.10.2025 05:02 — 👍 139 🔁 46 💬 21 📌 9💨💨💨💨
BRAVE research project
Bioaerosol Risk Assessment interVention Engineering
'has a goal of reducing respiratory illnesses, such as cold, flu, and asthma symptoms, by 25 percent with its own innovative clean-air version of a fire suppression system. '

Canada’s unions agree: Employers who are negligent regarding the health, safety, and lives of workers must feel the whole weight of the law.
#EnforceWestray #CanLab
www.thesafetymag.com/ca/topics/oh...

Ontario’s #OntEd system is under attack!
Bill 33 centralizes power, scapegoats trustees, & ignores chronic underfunding. Students need smaller classes, more teachers + ed workers + proper supports—not more gov't control. The gov't must abandon this bill & invest in our students.
🔗 bit.ly/3WjYpaX
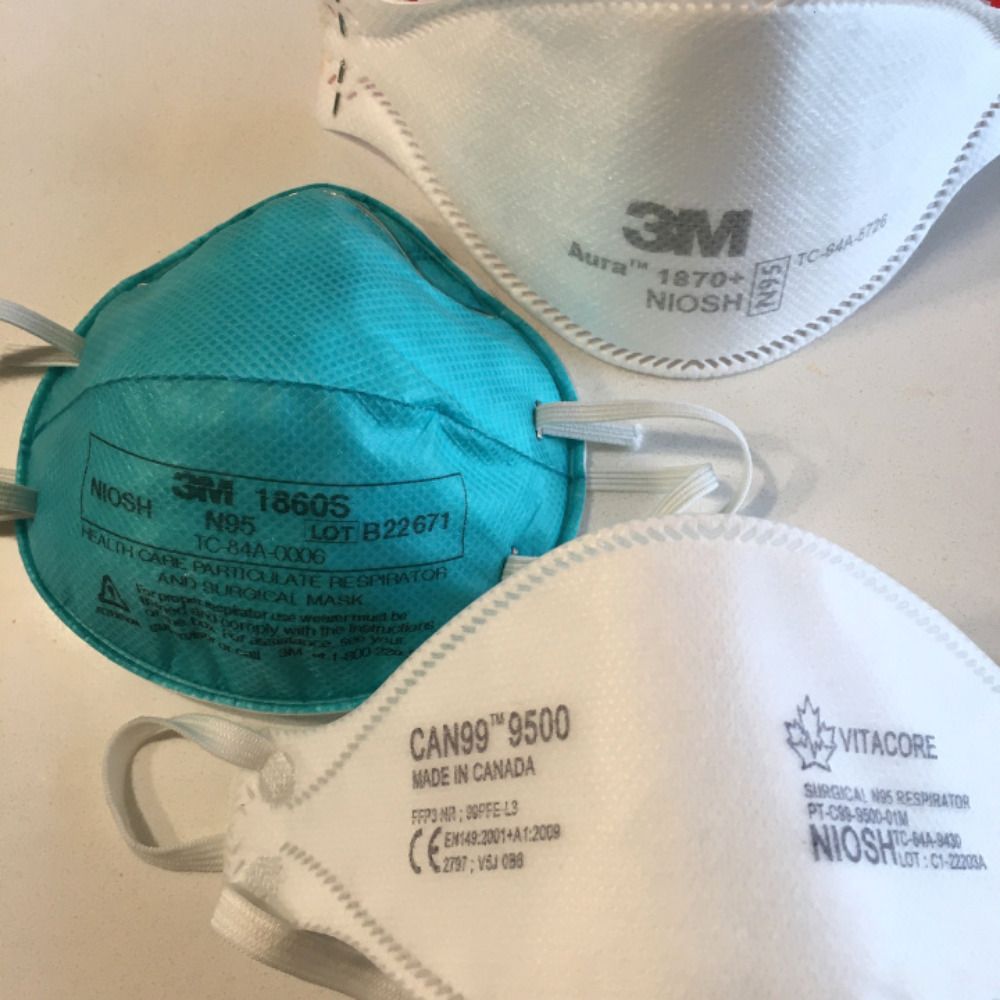
Health Canada puts out guidelines recommending N95s and clean indoor air!
Let’s do this!
Yes it’s overdue, and no it doesn’t address every risk factor, but we can significantly curb COVID with respirator use and clean air.
www.canada.ca/content/dam/...
I’ve talked to more doctors this year who are thinking about leaving medicine than ever before.
The system is stretched well past its limit, as are those inside.
Latest:

A news article from Medical Xpress dated October 20, 2025, titled “Post-pandemic COVID-19 linked with high numbers of workforce absences and exits.” The word “Post” is crossed out and replaced in red text with “Ongoing.” Below the headline, an image shows a woman in a blue sweater holding a tissue to her nose, appearing sick.
"COVID-19 continued to cause about the same number of monthly work absences year-round as occurred during peak influenza months, a team that includes Yale School of Public Health (YSPH) researchers has found."
Source: archive.li/z10Zl

Map of Big Cities Health Coalition Highlighting: Austin, TX Baltimore, MD Boston, MA Charlotte, NC Chicago, IL Cleveland, OH Columbus, OH Dallas, TX Denver, CO Detroit, MI El Paso, TX Fort Worth, TX Houston, TX Indianapolis, IN Kansas City, MO Las Vegas, NV Long Beach, CA Los Angeles, CA Louisville, KY Memphis, TN Milwaukee, WI Minneapolis, MN New York City, NY Oakland, CA Oklahoma City, OK Philadelphia, PA Phoenix, AZ Portland, OR San Antonio, TX San Diego, CA San Francisco, CA San Jose, CA Seattle, WA Tucson, AZ Washington, DC
The Big Cities Health Coalition, which serves over 60 million or 1 in 5 people in the US, has issued a statement condemning the federal government's moves to limit vaccine access and spread disinformation. The cities are working together to ensure people get vaccinated.
21.10.2025 04:25 — 👍 785 🔁 286 💬 14 📌 13
Staff member at Massachusetts school dies after alleged assault by student | Click on the image to read the full story https://www.wdsu.com/article/teen-charged-meadowridge-academy-death-swansea/69076594?utm_campaign=snd-autopilot
17.10.2025 20:13 — 👍 0 🔁 1 💬 0 📌 0
Staff member at Mass. school dies after alleged assault by student | Click on the image to read the full story
17.10.2025 00:46 — 👍 3 🔁 2 💬 0 📌 0
How workers died last week: Rail incident, gas leak, fall, school violence, tree care, vehicle incidents and shootings. On average, over 100 workers are killed every week in the United States due to traumatic injuries suffered at work. jordanbarab.com/confinedspac...
21.10.2025 17:14 — 👍 5 🔁 6 💬 1 📌 0
New job posting | Nouvelle occasion d'emploi
City of Toronto | Associate Medical Officer of Health
See our job board for more info | Voir notre babillard d'emplois pour les détails www.cpha.ca/job-board

Change is inevitable.
Sometimes it’s good change.
ospe.on.ca/advocacy/pol...


Long COVID isn’t rare. It’s a complex, chronic condition affecting millions worldwide, often for months or years after infection. Our latest article breaks down 7 key facts everyone should know about long COVID — from how common it is, to why prevention still matters.
whn.global/seven-things...

That’s right they did!!!
Let’s go, #Canada!!!
ospe.on.ca/advocacy/pol...
@barryhunt008.bsky.social @ukhadds.bsky.social @onschoolsafety.bsky.social @coopspeak.bsky.social @theresisters.bsky.social @cancovsoc.bsky.social
#IAQ
#KnowBetterBreatheBetter
Wisdom from Schoolhouse Rock.
18.10.2025 11:00 — 👍 5661 🔁 2702 💬 210 📌 191
Well Life COVID and INFLUENZA rapid antigen test kits, package of 5.
Never wonder whether it's COVID or FLU again.
ANNOUNCING THE FIRST combo rapid tests FOR HOME, approved by Health Canada.
Detect COVID, FLU A, and FLU B with just one swab.
This is a great tool to have ready the next time a family member isn't feeling well.
![This image describes the Canadian COVID Forecast for the fourteen-day period between Oct 11 - Oct 24, 2025, which is produced by COVID-19 Resources Canada. Canada’s COVID Forecast outlook is HIGH [no change] with a COVID INDEX SCORE of 8.9
About 1 of every 95 people is infected.
Estimated infections this week: 558,700-965,600
What these numbers mean: MODERATE 1-5, HIGH 5-10, VERY HIGH 10-15, SEVERE >15 COMPARED TO THE LOWEST POINT IN THE COVID PANDEMIC IN CANADA
How much higher are key indicators compared to the lowest point in the COVID pandemic in Canada?
Waste water, infections: HIGH; 6.1X higher
Long COVID: HIGH; 5.9X higher
Hospitalizations: VERY HIGH; 11.3X higher
Deaths: HIGH; 9.2X higher
HOW TO HELP:
EVERYONE:
UPDATE vaccines every 6 months
WEAR N95-type masks
Who is HIGH RISK?
People 60 and older, babies < 1 year, pregnant
ALL AGES: immunocompromised OR medically at-risk OR no vaccine or infection in the last 6 months
Recommendations are based on the COVID-19 Risk Index from the Peterborough ON Public Health Unit
COVID-19 Resources Canada is a grassroots organization of volunteer scientists supporting Canadian COVID responses. Sources, data and methods for the COVID Index are available at www.Covid19Resources.ca](https://cdn.bsky.app/img/feed_thumbnail/plain/did:plc:qbuobwdie7rzq4fburk63aft/bafkreigvlpwphipwsz3vxkdczvw35noac7v4tolew6ewwuawaqtki2h75i@jpeg)
This image describes the Canadian COVID Forecast for the fourteen-day period between Oct 11 - Oct 24, 2025, which is produced by COVID-19 Resources Canada. Canada’s COVID Forecast outlook is HIGH [no change] with a COVID INDEX SCORE of 8.9 About 1 of every 95 people is infected. Estimated infections this week: 558,700-965,600 What these numbers mean: MODERATE 1-5, HIGH 5-10, VERY HIGH 10-15, SEVERE >15 COMPARED TO THE LOWEST POINT IN THE COVID PANDEMIC IN CANADA How much higher are key indicators compared to the lowest point in the COVID pandemic in Canada? Waste water, infections: HIGH; 6.1X higher Long COVID: HIGH; 5.9X higher Hospitalizations: VERY HIGH; 11.3X higher Deaths: HIGH; 9.2X higher HOW TO HELP: EVERYONE: UPDATE vaccines every 6 months WEAR N95-type masks Who is HIGH RISK? People 60 and older, babies < 1 year, pregnant ALL AGES: immunocompromised OR medically at-risk OR no vaccine or infection in the last 6 months Recommendations are based on the COVID-19 Risk Index from the Peterborough ON Public Health Unit COVID-19 Resources Canada is a grassroots organization of volunteer scientists supporting Canadian COVID responses. Sources, data and methods for the COVID Index are available at www.Covid19Resources.ca
Canadian COVID Forecast Oct 11 - Oct 24, 2025
CANADA
HIGH [no change]
About 1 of every 95 people is infected.
Compared to lowest point of pandemic in Canada:
-Infections: 6.1 x higher
-Long COVID: 5.9 x higher
-Hospitalizations: 11.3 x higher
-Deaths: 9.2 x higher

This image shows gauges with the Oct 11 - Oct 24, 2025 Forecast scores for Canada, the provinces, & territories. From left to right: Canada: HIGH - 8.9 Alberta: HIGH - 7.0 British Columbia: HIGH - 8.4 Manitoba: VERY HIGH - 14.9 New Brunswick: VERY HIGH - 11.3 Newfoundland & Labrador: SEVERE - 17.0 North: VERY HIGH - 12.3 Nova Scotia: SEVERE - 16.3 Ontario: HIGH - 7.5 Prince Edward Island: VERY HIGH - 11.8 Quebec: HIGH - 10.0 Saskatchewan: SEVERE - 17.0 A text box reads: "The COVID Forecast is calculated from 3 equally weighted categories: 1) Current infections and spread; 2) Healthcare system impact; 3) Mortality. Within each category there is one sub-category for trends over the most recent week (Trends) and one sub-category for current parameter values relative to a specified baseline (Current values). Trends and current values are weighted equally when determining the final score for a category. All Forecast input data and sources are available here (https://datastudio.google.com/embed/u/0/reporting/42b886cf-d661-488e-b7d8-5c5836b55ab6/page/p_2yqs028mwc). Past Forecast scores are available in the table below. Forecast scores are grouped into 4 ranges: MODERATE (1 to <5, white), HIGH (6 to <10, yellow), VERY HIGH (10 to <15, orange), SEVERE (>15 red)."
Canadian COVID Forecast: Oct 11 - Oct 24, 2025
SEVERE: NL, NS, SK
VERY HIGH: MB, NB, North, PEI
HIGH: CAN, AB, BC, ON, QC
MODERATE: none
About 1 in 95 people in Canada are CURRENTLY infected.

The two spikes in CO2? Elevator rides...reason I still wear mask in public elevators (and restrooms)...
14.10.2025 12:44 — 👍 66 🔁 20 💬 5 📌 0
HEPA purifiers not tied to less #viral exposure in elementary classrooms, analysis finds #HEPA purifiers were associated with a 33% decrease in viral diversity, but the reduction wasn't linked to fewer school absences.

Schools cut covid-19 sick days by 20 per cent using HEPA air filters Placing HEPA air filters into classrooms in the Bradford area of the UK reduced the number of covid-19-related absences among students by more than 20 per cent By Clare Wilson 20 October 2023
The CIDRAP study is old… pre-pandemic… and you have to ask the question… what has changed.
Important things about HEPA use… you have to have enough clean air delivery… and they need to be switched on. Using masks enhances the effect due to source control and reduction of near field transmission.

How workers died last week: 16 killed in munitions plan explosion, four workers die from falls, forklift, tree care, oil well, construction incidents, helicopter crash, firefighting, vehicle incidents and shootings. jordanbarab.com/confinedspac...
13.10.2025 21:37 — 👍 10 🔁 6 💬 0 📌 0