First post on Bluesky! 🌿
Excited to share our new study in Ecography, led by Maxime Lenormand: combining naturalist inventories and satellite data to map plant biodiversity.
Here’s a bioregionalization of the flora of France!
🔗 nsojournals.onlinelibrary.wiley.com/doi/full/10....
08.09.2025 11:39 — 👍 48 🔁 12 💬 0 📌 1
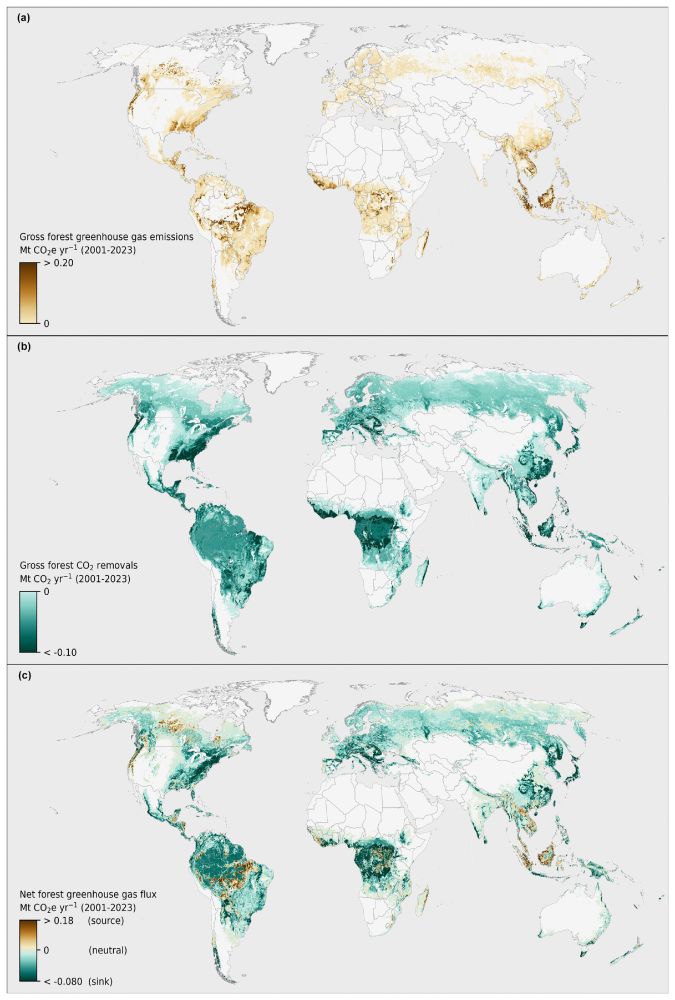
Figure 3 from the paper of Gibbs et al (2025) showing three maps respectively representing the amounts of greenhouse gas emmisions, removal, and net flux.
Caption from the paper: Forest-related GHG fluxes (annual average, 2001–2023). (a) Gross GHG emissions. (b) Gross CO2 removals. (c) Net GHG flux. Fluxes are aggregated to 0.04×0.04° (approximately 4×4 km) cells for display purposes. Publisher's remark: please note that the above figure contains disputed territories.
🌲🌳🌐 New study reminds us that forests act globally as a #carbon sink
Between 2001 and 2023, the world's #forests have absorbed 5.5 gigatonnes more #CO2 than they have emitted on average each year.
👉 Gibbs et al. dx.doi.org/10.5194/essd... 🧪
28.03.2025 17:53 — 👍 40 🔁 19 💬 0 📌 0
Global Ecology 🌐 starter pack vol 1 & 2 are full and curated !! ✨💚
Please share so they will fly into the blue sky 🦋🌈
Vol1 👉 bsky.app/starter-pack...
Vol2 👉 bsky.app/starter-pack...
Will start a Vol. 3 soon, please reply if you want to be in !
🌐🧪🌍🦤🍁🦑🪴🦉🐍🌾
12.02.2025 11:51 — 👍 120 🔁 54 💬 31 📌 1

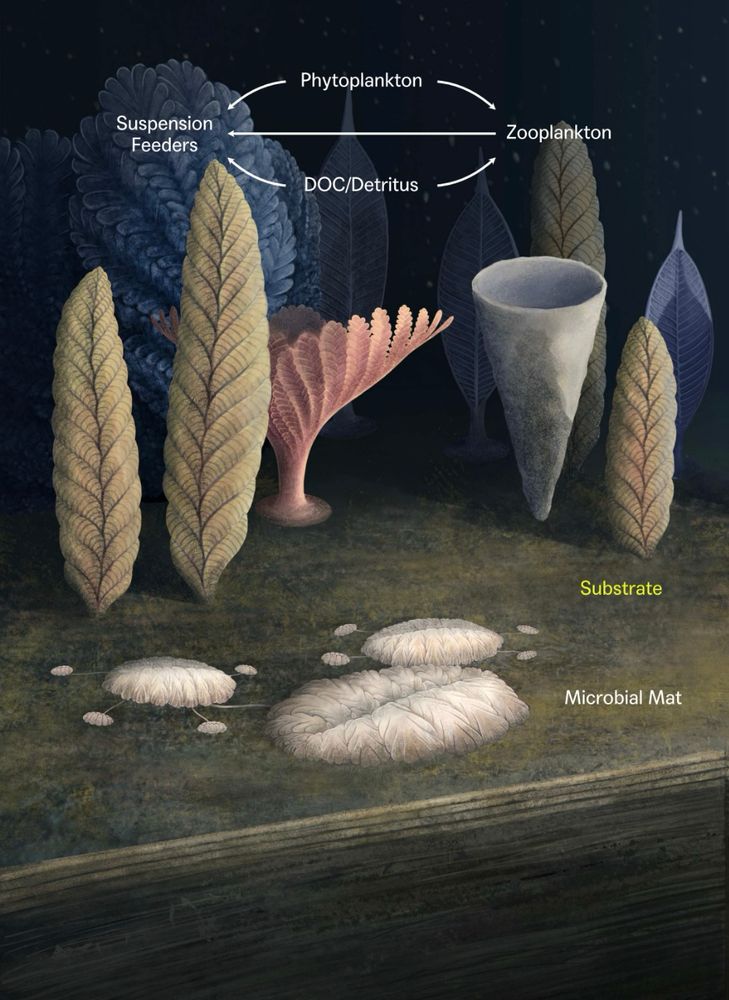
The Atlantic Forest in Brazil. A lush almost mossy looking canopy of trees covers pointy hills in close proximity. It's the kind of landscape that a geographer would get goosebumps looking at.
📝 How Amazon Trees Marched to the Atlantic Forest 🧵
https://doi.org/n3rb
Ancient rainforest trees found hidden highways through Brazil's drylands, making more than a dozen epic journeys from the Amazon to the Atlantic coast over twelve million years.
#Botany #PlantScience 🧪 #InBrief
27.01.2025 14:28 — 👍 35 🔁 12 💬 2 📌 1
A great starter pack to connect with people working on #ecology at a large scale 🌍🧪
Global Ecology Vol. 2 👉 go.bsky.app/L37W5uH
DM @global-ecology.bsky.social to join the pack, there’s still room for more ! 😊
31.01.2025 17:56 — 👍 9 🔁 3 💬 0 📌 0

How will biodiversity respond to efforts to mitigate C emissions? Smith et al. in @science.org document that vert. biodiv. benefits from (natural) reforestation. BUT, planting biocrops, while it reduces climate change, hurts most species bc they lose habitat. 🧪🌎
www.science.org/doi/10.1126/...
28.01.2025 20:12 — 👍 34 🔁 5 💬 0 📌 1

Woody Vegetation Dataset for Latin America Released
geog.umd.edu/featured-con... Annual data from 2015 to 2023 provides detailed insights into tree canopy cover and height. 🍁🍁🌳 #forestecol
28.01.2025 23:27 — 👍 6 🔁 2 💬 0 📌 0
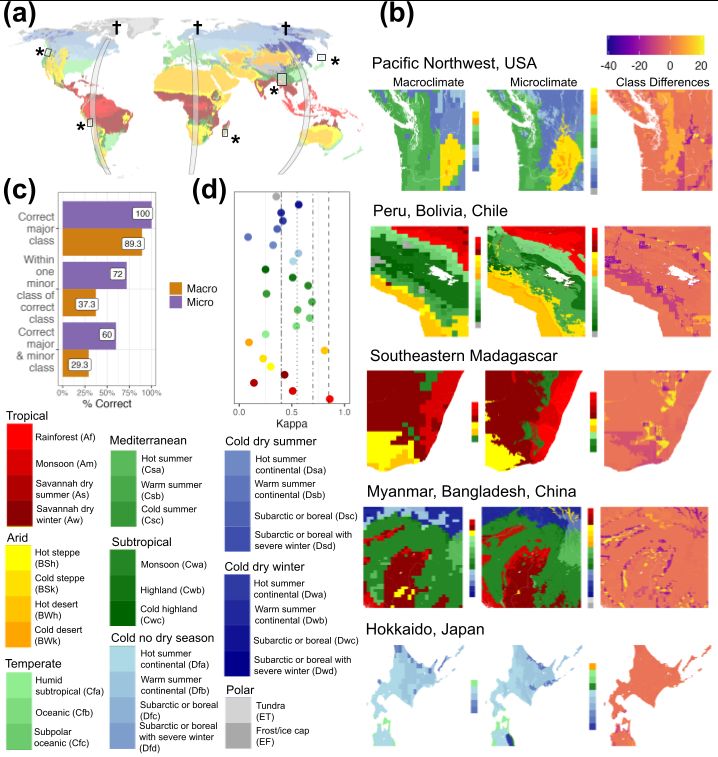
My final PhD chapter published in FEE (Frontiers in Ecology and the Environment): re-mapping Köppen-Geiger climate zones, but now using microclimate! Very excited to have this one out:
onlinelibrary.wiley.com/doi/abs/10.1...
21.01.2025 14:22 — 👍 75 🔁 26 💬 3 📌 2

Figure 1 from the study by Champreux et al. (published in Ecological Monographs) showing four global biome maps using different biome-delimitation criteria resulting in various geographic divisions, biome names, and number of biomes.
Caption from the study: Global biome maps compared in this study. (a) Compilation biome map of World Wildlife Fund Terrestrial Ecoregions of the World (Olson et al., 2001). (b) Simulated biome map from Holdridge's (1967) life zones (Leemans, 1990a, 1990b) and two functional biome maps: (c) MODIS-IGBP land-cover-type product (Friedl et al., 2010; Loveland & Belward, 1997) and (d) dominant biome distribution over 31 years from global functional biome scheme from Higgins et al. (2016, 2017). Biome names are derived from three letters (1) tall versus short, (2) low, medium, and high vegetation productivity index, and (3) cold, dry, both cold and dry, nonseasonal for growth limitation index.
What is a #biome? 🌳🌲🌱
How can we delineate past, present and future biomes, despite the patchy and incomplete data we have on the distribution of nature on Earth? 🌍🌐
Our review 👉 doi.org/10.1002/ecm....
🧪 #ecology #biogeography #paleoecology #climate #vegetation #FunctionalTraits
24.01.2025 17:43 — 👍 62 🔁 23 💬 0 📌 0
Thank you!
24.01.2025 12:34 — 👍 0 🔁 0 💬 0 📌 0

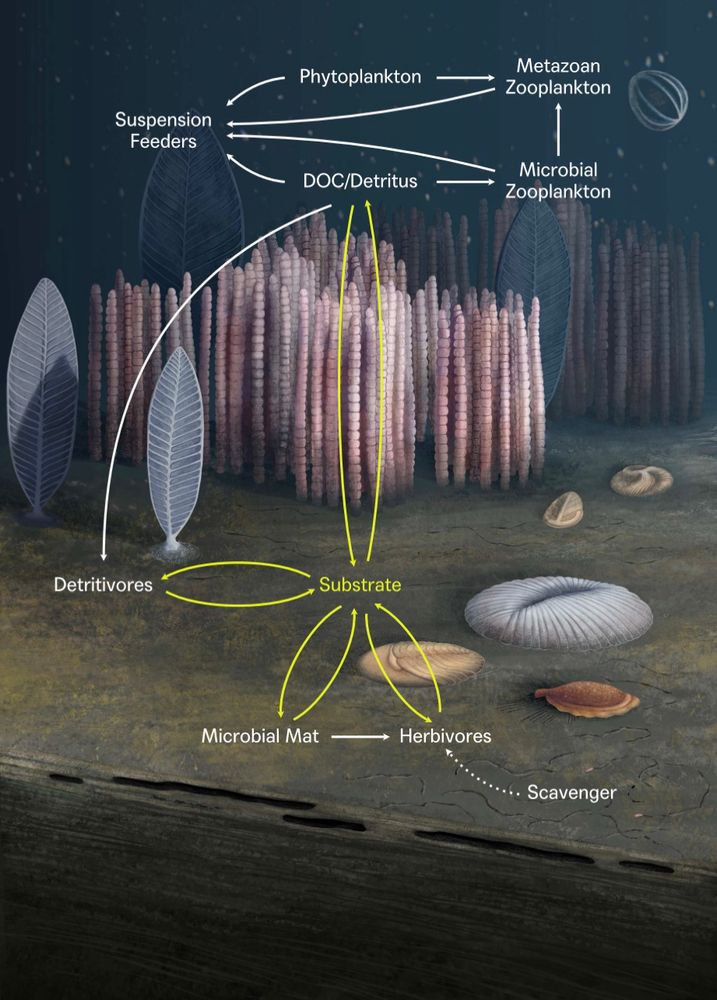
Figure 5 from the recent paper from Jurikova et al. (2025), a paleo-artistic representation of the Carboniferous-Permian transition showing luxuriant Carboniferous forests on the left and more arid Permian environments on the right with associated fauna, separated by a river.
Caption from the paper: A relatively rapid rise in atmospheric CO2 approximately 294 Ma released the Earth from its penultimate icehouse (left) and transitioned the world to a warmer and drier climate of the Early Permian (right). Palaeo-artistic rendering based on findings of this study and previously published literature
Rapid rise in atmospheric #CO2 marked the end of the Late #Palaeozoic Ice Age
Jurikova et al. 👉 rdcu.be/d7fQJ
"About 294 million years ago, atmospheric CO2 rose abruptly (4-fold), releasing the Earth from its penultimate ice age and transforming the Early Permian into a warmer world."
23.01.2025 17:41 — 👍 3 🔁 0 💬 0 📌 0

World map showing biodiversity collection hotspots (red) and blindspots (blue). BALL ET AL./PEERJ (2025)
Our records of the world’s biodiversity are patchy—but that's not because lots of places are "unexplored." That story and more of the best in @science.org and science in this edition of #ScienceAdviser: www.science.org/content/arti... 🧪
21.01.2025 16:56 — 👍 58 🔁 22 💬 3 📌 3
Thank you!
20.01.2025 12:33 — 👍 0 🔁 0 💬 0 📌 0
Hi Graciela, I'd be happy to be added 😊
17.01.2025 17:46 — 👍 1 🔁 0 💬 1 📌 0

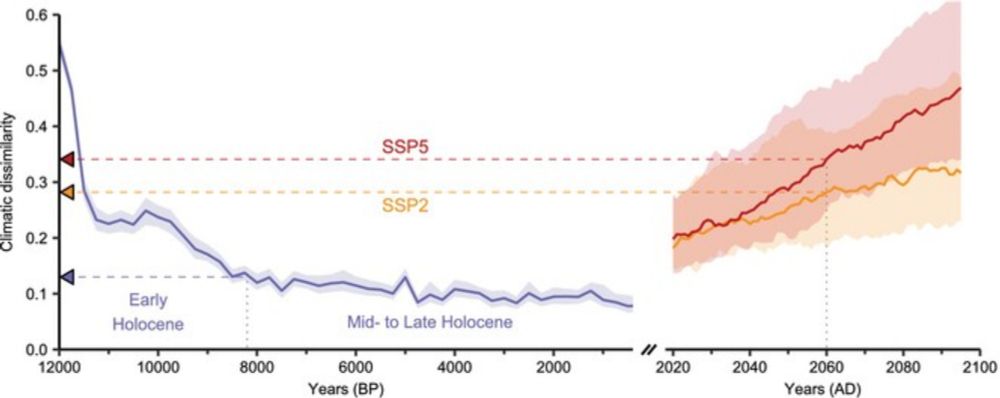
🌍 Projected future climatic forcing on the global distribution of #vegetation types 🌲🌳🌿🍃🌱
Allen et al. 👉 doi.org/10.1098/rstb...
#Biogeography #ecology #biomes
03.01.2025 17:20 — 👍 7 🔁 0 💬 0 📌 0
Post your most popular #art from Twitter🍁
I've never had anything actually go viral or get many likes, but this Ginkgoales leaf montage ended up being my most popular piece of art: so YAY for paleobotany!!! #paleoart #paleobotany #ginkgo
21.10.2024 18:04 — 👍 174 🔁 36 💬 5 📌 8
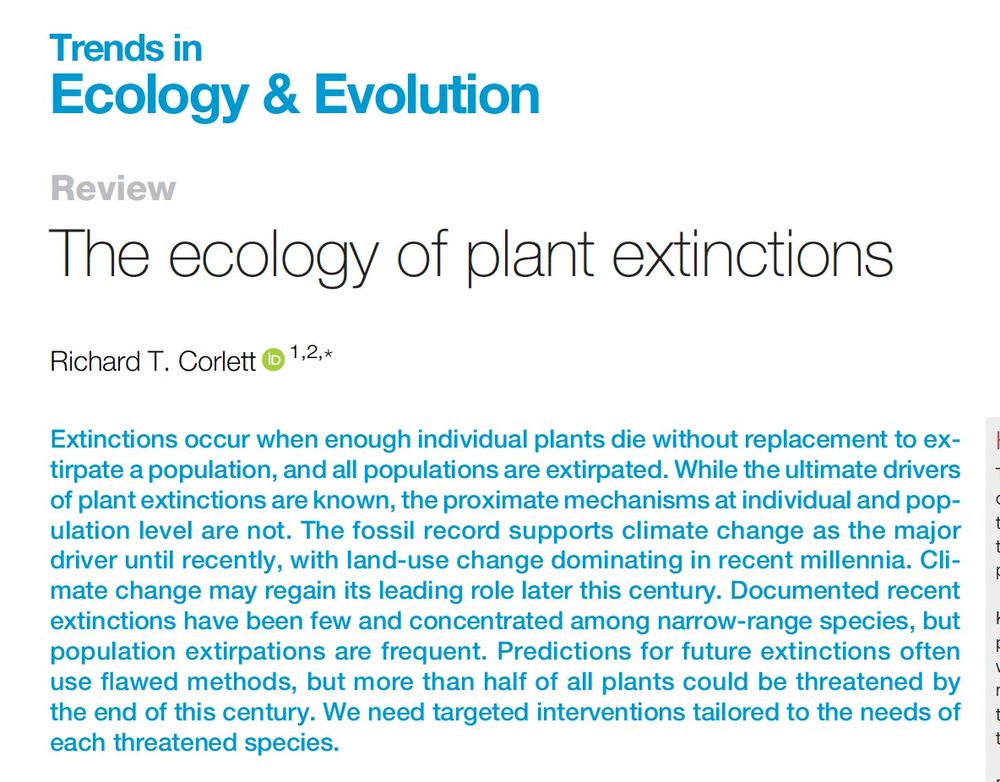
Image of the first page and abstract of the paper "The ecology of plant extinctions
Author links open overlay panel
Richard T. Corlett 1 2
Show more
Add to Mendeley
Share
Cite
https://doi.org/10.1016/j.tree.2024.11.007
Get rights and content
Highlights
The fossil record suggests that climate change was the major driver of plant extinctions and regional extirpations from the Pliocene until recently, when anthropogenic habitat loss became dominant.
Known recent plant extinctions are disproportionately few in comparison with well-studied animal taxa, but many more species are probably committed to inevitable extinction unless given targeted support.
Recent warm-edge extirpations demonstrate the growing impact of anthropogenic climate change and show that predictions of massive climate-driven extinctions later this century are plausible.
The proximate causes for population extirpations are still rarely known but are likely to be highly varied and both species and location specific."
An important review - The ecology of plant extinctions - "Recent warm-edge extirpations demonstrate the growing impact of anthropogenic climate change & show that predictions of massive climate-driven extinctions later this century are plausible" www.sciencedirect.com/science/arti... 🌾🌎🧪🌐
07.12.2024 11:59 — 👍 226 🔁 87 💬 5 📌 0

Figure 7 from S. Scheiter et al. 2024 showing 3 world maps representing the predicted and observed biome maps, as well as the areas where they agree or disagree.
Caption from the paper: Global biomes derived from traits. Using species distribution models and bioclimatic data, biome patterns derived from the spatial
coverage of the trait data were extrapolated to the global scale. Here, results from trait cluster 1 and the Nature Conservancy (2009) biome map were used. Biomes: 1, tropical subtropical moist broadleaf forest; 3, tropical subtropical grassland savanna and shrub; 4, tropical subtropical dry broadleaf forest; 5, tropical subtropical coniferous forest; 6, flooded grassland and savanna; 7, desert and xeric shrub; 8, montane grassland and shrub; 9, mediterranean forest woodland and scrub; 10, temperate broadleaf and mixed forest; 11, temperate grassland savanna and shrub; 12, temperate conifer forest; 13, boreal forest/taiga; 14, tundra. Publisher’s remark: please note that the above figure contains disputed territories.
🌍 Crowd-sourced trait data can be used to delimit global #biomes 🌳🌲🌱🌿🍃
Scheiter et al. 👉 bg.copernicus.org/articles/21/...
#Biogeography #vegetation #FunctionalTraits #ecology 🌐
06.12.2024 17:47 — 👍 44 🔁 11 💬 0 📌 0

Plate from the paper showing details of the anatomy of the roots of the new species
Congratulations to T. Durieux who just got his second lead author paper from his PhD project accepted. The paper describes a new species of woody tree that was growing about 360 million years ago in what is now Ireland 🌲⛏️ doi.org/10.1016/j.re...
#paleobotany #botany
03.12.2024 10:08 — 👍 48 🔁 10 💬 2 📌 1

Global burned area increasingly explained by climate change
Nature Climate Change - Complex interactions between drivers have hampered efforts to understand observed changes in fire behaviour worldwide. Here fire model ensembles and impact attribution show...
Global burned area increasingly explained by climate change
Burton et al. 👉 rdcu.be/d2yat
"The simulations show that climate change increased global burned area by 15.8% [...] for 2003–2019 and increased the probability of experiencing months with above-average global burned area by 22% [...]"
05.12.2024 17:00 — 👍 1 🔁 1 💬 0 📌 0
After 12 years as a palaeoclimatologist, I changed my suit to become a data teacher. Founder of the DataSharp Academy, where I teach everyday skills to help you become a confident, independent data analyst.
PhD student in Devonian Palaeobotany at the University of Edinburgh
Assistant Professor of Physical Geography, University of Cambridge | Interest in conservation palaeoecology |UKRI Future Leaders Fellow l Fellow Girton College | Conservation Palaeoecology Lab page: https://www.conservepalaeo.com/
European Geosciences Union is the leading organisation supporting Earth, planetary & space science researchers in Europe. #EGU26 3-8 May 2026. Online Mon-Fri 10-5 CET.
Official account of EGU Division on Climate: Past, Present & Future - @egu.eu 🌤️. Posts are written by the CL ECS Social Media team. Check out our Division homepage www.egu.eu/cl/. Contact us at ecs-cl@egu.eu.
#50YearsOfESA: we're the European Space Agency, keeping you posted on European space activities.
Please see our Privacy Notice: https://esa.int/connectwithus
JFR ( ISSN 1007 -662X , IF 4.6 Q1 ) Journal of Forestry Research | Ranked 6/92
🌳 Follow for studies on forest sustainability, ecology, & conservation! 🌳
🔗 https://link.springer.com/journal/11676
News from the #Paleoanthropology 🦴🦷⚒️ lab at the University of Tübingen 🎓 & Senckenberg 🌍
"The Role of Culture in Early Expansions of Humans" | Home of the Roceeh Out of Africa Database (ROAD)
Geographer at http://roceeh.net
We are the Terrestrial Ecology Research Group at TU Munich in Freising - headed by Wolfgang Weisser. We investigate patterns and drivers of biodiversity change in agricultural, natural and urban ecosystems.
Tropical forests in our time - people, trees and climate. Posts by Oliver Phillips.
🌍 Ecohydrologist | Passionate about water, climate & ecosystems | Assistant Prof @Imperial
Head of Key Biodiversity Areas Secretariat working with governments and conservation practitioners to identify the most important places for biodiversity
@cnrs-insu.bsky.social researcher at @climatecerege.bsky.social.
Using biomarkers to study climate, ocean, and environment of the past.
@icta-uab.bsky.social alumna.
ORCID: https://orcid.org/0000-0002-3047-6064
🇫🇷 -> 🇪🇸 -> 🇫🇷
Professor at Technical University of Munich
Head of Research at Berchtesgaden National Park
Ecosystem Dynamics - Forest Management - Mountain Landscapes
https://www.lss.ls.tum.de/edfm | https://www.nationalpark-berchtesgaden.bayern.de
Earth resilience, tipping behavior, nonlinear thinking, stability analysis, climate change, photosynthesis, soil respiration, tree mortality, Fulbright Scholar
https://sites.google.com/view/chuixiangyi
Conservation biologist @idiv/UFZ. Focus on EU's Common Agricultural Policy & Nature Restoration Regulation. Agri EU Projects Agroecology-TRANSECT, LAFERIA.
Butterflies & citizen science projects: VielFalterGarten, UNP+, BMS-IL. Father of 2.
BUND, S4F, SCB
Paleoecology | Biogeography | Rangelands
Herbivores and Fire
Incoming Assistant Professor of Rangeland Ecology & Management at New Mexico State University
Postdoc at OK State
Climate Hub Fellow