Did you catch @afgilmour.bsky.social’s recent article in @edweek.org?
12.01.2026 18:55 — 👍 0 🔁 0 💬 0 📌 0

Inside One State's Bold Plan to Keep Special Education Teachers
Pennsylvania's training and mentoring program works to retain teachers serving students with disabilities.
💡“The unique thing about Pennsylvania is they decided to do as many things as they can at once, addressing each part of the [special education teacher] pipeline.” - @afgilmour.bsky.social
Read how Pennsylvania supports its #SpecialEducation workforce: www.edweek.org/teaching-lea...
22.12.2025 20:25 — 👍 5 🔁 4 💬 0 📌 0

IDEA at 50
The landmark federal law ensured access for students with disabilities. Now it’s time to focus on outcomes.
“Delivering effective #SpecialEducation involves collecting data, monitoring progress, and making instructional changes when progress stalls or falters.” - @afgilmour.bsky.social
Alli’s recent article in Education Next reflects on 50 years of #IDEA: www.educationnext.org/idea-at-50-l...
09.12.2025 17:30 — 👍 2 🔁 4 💬 0 📌 0
The Individuals with Disabilities Education Act (#IDEA) was enacted 50 years ago. @airinforms.bsky.social highlights IDEA’s impact and the ongoing work to ensure a free appropriate public education for students with disabilities below.
26.11.2025 19:05 — 👍 1 🔁 2 💬 0 📌 0
💡“Our shortages aren’t really from not having enough people; it’s having people teaching the wrong thing.” - @afgilmour.bsky.social
Check out this article from Education Week which features research from our recent working paper on the #SpecialEducation teacher workforce.
20.11.2025 18:45 — 👍 3 🔁 5 💬 0 📌 0

Screenshot from the SPARC Center Data Explorer.
The graph looks at the percentage of special education teachers (SETs) who changed schools by school-poverty level. Seven states are included: Hawai‘i, Indiana, Massachusetts, Pennsylvania, Texas, Virginia, and Washington. For each state, there are three dots showing the percent of SETs moving schools at low-poverty schools, middle-poverty schools, and high-poverty schools. In all states except Hawai‘i, the rate is highest for high-poverty schools.
Did you know recruitment and retention of #SpecialEducation teachers varies widely by school contexts, including by poverty level, enrollment demographics, and location?
🔎Explore more with our data visualizer: sparccenter.org/data-explore...
18.11.2025 18:39 — 👍 5 🔁 4 💬 0 📌 2

Photo from the award presentation for the Excellence in Teacher Education Award from the Teacher Education Division of the Council for Exceptional Children. Two people stand in the center of the photo, both smiling. LaRon Scott, left, wears a tan suit. Lucky Mason-Williams, right, wears a black suit and holds the award plaque in her hand.
🎉 Congratulations to SPARC Center’s @lmasonwms.bsky.social for receiving the Excellence in Teacher Education Award from @ted-cec.bsky.social!
This honor recognizes Lucky's outstanding contributions to preparing and supporting #SpecialEducation teachers.
14.11.2025 17:15 — 👍 1 🔁 1 💬 0 📌 0
SPARC Data Explorer | SPARC Center
✨What does the #SpecialEducation teacher workforce look like within and across states? Our new interactive data visualizer tool looks at the composition, stability, and distribution of the workforce in our seven partner states.
Explore the tool: sparccenter.org/data-explore...
13.11.2025 17:35 — 👍 4 🔁 5 💬 0 📌 0

States face different special education staffing challenges that require targeted responses | Brookings
Special education teacher turnover varies by state, calling for targeted, locally informed policy solutions.
"As we have demonstrated, different states face different #SpecialEducation teacher turnover problems. This suggests that the most promising solutions might vary across states."
Read more about our recent findings in our article with @brookings.edu: www.brookings.edu/articles/sta...
12.11.2025 17:31 — 👍 4 🔁 4 💬 0 📌 3
The Composition, Distribution, and Stability of the Special Education Teacher Workforce in Seven States | SPARC Center
🔍Our new Working Paper uses consistent variables across states. Leveraging Common Education Data Standards and Statewide Longitudinal Data Systems enables meaningful cross-state comparisons of the #SpecialEducation Teacher workforce.
Read more: sparccenter.org/research-fin...
11.11.2025 17:00 — 👍 2 🔁 4 💬 0 📌 0
💡SPARC Center’s @roddy-theobald.bsky.social is presenting at @appam.bsky.social this week. Explore his sessions at the link below.
10.11.2025 14:35 — 👍 4 🔁 3 💬 0 📌 0
Nov 14 Session:
💡Piloting the Revealing Special Educators’ Conditions for Teaching Measure: A Psychometric Evaluation with a Nationally Representative Sample with @lizbettini.bsky.social
🕐️ 11–11:50 am
📍 Washington Park 2
07.11.2025 18:32 — 👍 0 🔁 0 💬 0 📌 0
Nov 13 Sessions Continued:
💡A Systematic Review and Meta-Analysis of Dual-Certification in Special Education and General Education (Session: Multiple Paper 41) with @afgilmour.bsky.social
🕐️ 3–3:50 pm
📍 Century A
07.11.2025 18:32 — 👍 1 🔁 0 💬 1 📌 0
Nov 13 Sessions Continued:
💡Multiple Lenses on Special Educators’ Work: Exploring the Complexity and Multidimensionality of Special Education Teaching Quality with @lizbettini.bsky.social
🕐 Thursday 11/13 from 3:00–3:50 pm
📍 Pershing Place West
07.11.2025 18:32 — 👍 0 🔁 0 💬 1 📌 0
Nov 13 Sessions Continued:
💡Project SUSTAIN: Developing a Collaborative Intervention for Special Educators’ Conditions for Teaching with @lizbettini.bsky.social
🕐️ 11–11:50 am
📍 Penn Valley
07.11.2025 18:32 — 👍 0 🔁 0 💬 1 📌 0
Nov 13 Sessions Continued:
💡Examining the Special Education Workforce through Cross-State Analysis with @lmasonwms.bsky.social and @afgilmour.bsky.social
🕐️ 10–10:50 am
07.11.2025 18:32 — 👍 1 🔁 0 💬 1 📌 0
Nov 13 Sessions:
💡Overwork in Special Education: A Qualitative Analysis of Teachers’ Perspectives with @lizbettini.bsky.social
🕐️ 8–8:50 am
📍 Washington Park 3
💡Keynote Panel: Preparing Special Educators in a Time of Uncertainty with Lynn Holdheide
🕐️ 9–9:50 am
07.11.2025 18:32 — 👍 0 🔁 0 💬 1 📌 0
Nov 12 Sessions:
💡Publishing and Reviewing for Teacher Education and Special Education Journal with LaRon Scott and @lizbettini.bsky.social
🕐 1-1:50pm
📍 Century B
💡Special Educators’ Working Conditions and Building Family Relationships: A Missing Link?
🕐️ 1–1:50pm
📍 Pershing Place East
07.11.2025 18:32 — 👍 0 🔁 0 💬 1 📌 0

Promotional graphic for an upcoming conference. The background shows a twilight view of downtown Kansas City, Missouri. White bold text at the top reads: “Upcoming Conference.” Below, in smaller text: “Teacher Education Division 2025, Nov 11–14 | Kansas City, MO.” At the bottom, the SPARC logo appears with colorful starburst lines. The website “sparccenter.org” is displayed in blue on the lower right.
🌟SPARC Center researchers are presenting at @ted-cec.bsky.social next week. Check out this thread for their sessions:
07.11.2025 18:32 — 👍 2 🔁 2 💬 1 📌 2
The Composition, Distribution, and Stability of the Special Education Teacher Workforce in Seven States | SPARC Center
Our results underscore the importance of considering #SpecialEducation staffing challenges across states and contexts. Read the full paper here: sparccenter.org/research-fin...
06.11.2025 19:00 — 👍 0 🔁 0 💬 0 📌 0

A stacked bar chart showing turnover rates of special education teachers in seven states, broken down by school type and by turnover type (attrition from teaching, moving schools, or switching to general education).
➡️ Patterns of turnover varied across school types, with the highest turnover in charter schools.
06.11.2025 19:00 — 👍 0 🔁 0 💬 1 📌 0
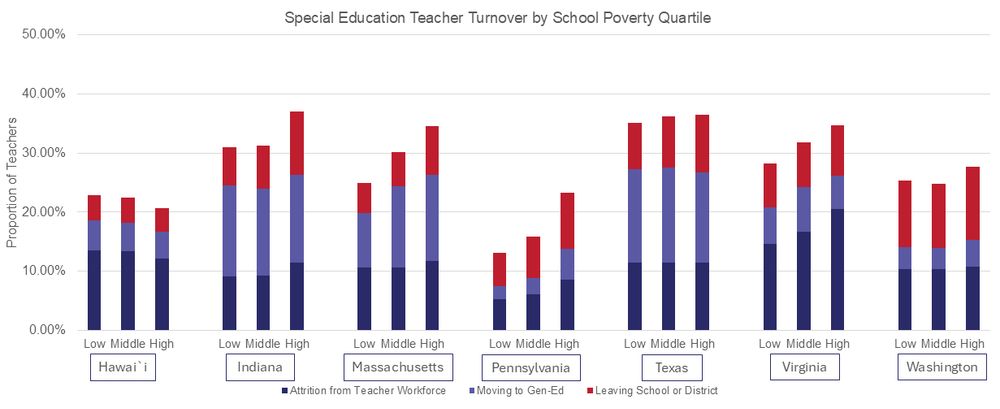
A stacked bar chart showing turnover rates of special education teachers in seven states, broken down by school poverty level and by turnover type (attrition from teaching, moving schools, or switching to general education).
➡️ Special education teacher turnover rates were generally higher in higher-poverty schools.
06.11.2025 19:00 — 👍 1 🔁 0 💬 1 📌 0

A line graph showing attrition rates for special education teachers between 2015 and 2023.
➡️After the first year of the pandemic, special education teacher attrition rates declined, spiked, and then stabilized.
06.11.2025 19:00 — 👍 0 🔁 0 💬 1 📌 0
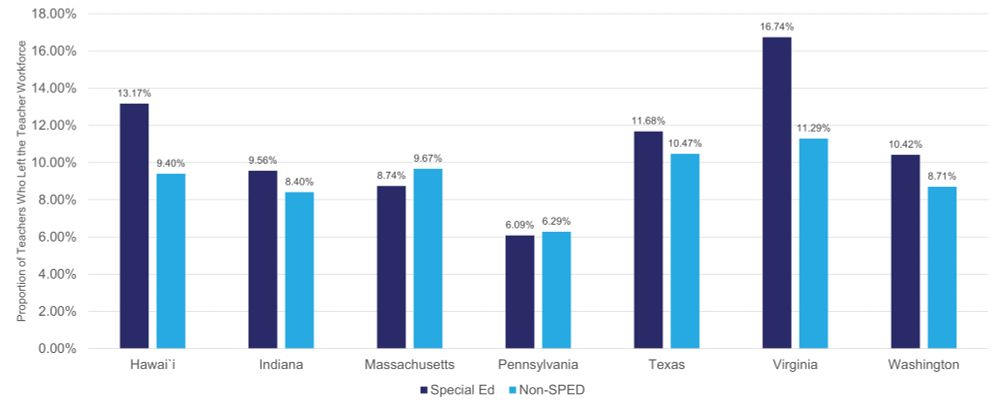
A bar chart showing attrition rates of special education teachers vs non-special education teachers in seven states. Most states had higher rates of attrition for SETs.
➡️ In most states, special education teacher attrition rates were higher than attrition rates for other teachers.
06.11.2025 19:00 — 👍 0 🔁 0 💬 1 📌 0

A bar chart showing the ratios of students with disabilities to special education teachers in seven states. Ratios vary widely.
➡️ States varied considerably in how they identify special education teachers in their data and how they staff special education, leading to different staffing ratios.
06.11.2025 19:00 — 👍 0 🔁 0 💬 1 📌 0

Abstract of SPARC Working Paper No. 01-1025, titled "The Composition, Distribution, and Stability of the Special Education Teacher Workforce in Seven States."
The abstract reads: Special education staffing challenges threaten the delivery of effective special education services to students with disabilities. We investigated the composition, distribution, and stability of the special education teacher (SET) workforce over time and across seven states. Some challenges were similar across states, such as trends in SET workforce stability over time, while other challenges (e.g., SET certification rates) varied considerably by state. Staffing challenges also varied within some states, contributing to considerable inequity in SET stability and in the distribution of novice SETs, SETs without full certification, and SETs of color. These findings suggest a need for policies and practices that vary by state context and target the districts and schools most affected by SET staffing challenges.
📢 Our new Working Paper provides important cross-state insights into the #SpecialEducation teacher workforce.
We highlight some of our major findings in this thread⬇️
06.11.2025 19:00 — 👍 1 🔁 1 💬 1 📌 0
We are grateful to our partner states for their collaboration in this important work. We look forward to continuing our research in the year ahead.
30.10.2025 14:00 — 👍 1 🔁 0 💬 0 📌 0
SPARC Data Explorer | SPARC Center
⭐Resource #3: An interactive dashboard exploring the key dimensions of the special education teacher workforce across all our partner states: sparccenter.org/data-explore...
30.10.2025 14:00 — 👍 1 🔁 1 💬 1 📌 4
Abstract of SPARC Working Paper No. 01-1025, titled "The Composition, Distribution, and Stability of the Special Education Teacher Workforce in Seven States."
The abstract reads: Special education staffing challenges threaten the delivery of effective special education services to students with disabilities. We investigated the composition, distribution, and stability of the special education teacher (SET) workforce over time and across seven states. Some challenges were similar across states, such as trends in SET workforce stability over time, while other challenges (e.g., SET certification rates) varied considerably by state. Staffing challenges also varied within some states, contributing to considerable inequity in SET stability and in the distribution of novice SETs,SETs without full certification, and SETs of color. These findings suggest a need for policies and practices that vary by state context and target the districts and schools most affected by SET staffing challenges.
⭐Resource #1: A Working Paper with details of our cross-state analysis of the special education teacher workforce: sparccenter.org/research-fin...
30.10.2025 14:00 — 👍 2 🔁 2 💬 1 📌 0
Inspiring and empowering you to make a difference in your K 12 community.
💻 Website: www.edweek.org
📧 Newsletters: https://www.edweek.org/newsletters
👩🏽💻 Research & write about k-12 ed policy @ Brookings
💖 Stationery, books, coffee, & reality tv
🏆 Once voted best penmanship
Assistant Professor of Education Policy, Organization, & Leadership, University of Illinois Urbana-Champaign. Former middle school science teacher in Oakland and Los Angeles.
https://www.paul-bruno.com/
https://www.last.fm/user/pabruno
Former teacher, special education professor, and literacy specialist. Current auntie extraordinaire and occasional ne’er-do-well.
📍NC
PhD in special education. Postdoctoral scholar. I study teacher preparation and professional identity development. Former ECSE teacher. She/her
Assistant professor of education leadership and policy at University of Michigan-Flint @umflintcase.bsky.social. Views are my own. Please excuse typos.
Associate professor @uvaehd.bsky.social studying the people and policies that make school districts tick. Views are my own.
Assistant Professor of Special Education at the University of Southern Maine and PBIS coordinator for Maine DOE. UConn PhD and NCLII scholar. she/her.
Postdoctoral Research Associate at Brown University | Ph.D. in Special Education from Boston University | (she/her)
http://lindsey-kaler.com
Associate Prof of Special Education
Researcher. Teacher educator.
Associate professor at Vanderbilt, language, social, behavioral development, implementation & sustainment, research synthesis (he/him) + food + travel 🍕✈️
https://linktr.ee/jason.chow
Associate Prof, Binghamton University. Advocate for a prepared, representative, stable, & equitably distributed special ed workforce.
Professor and Special Education Researcher at UW-Madison, mom, co-parent, partner, cyclist, walker, hiker, retired runner, she/her PA/MI/CA/MD/OR/CT/WI
We're a nonprofit, nonpartisan think tank using the tools of economics to defend & promote workers' interests in economic policy discussions.
epi.org
Podcast: epi.org/podcast/
Newsletter: epi.org/signup/
Federal Policy Watch: epi.org/policywatch
Advancing policies & practices to dismantle the racial & economic barriers embedded in the American education system. www.edtrust.org
Barnett Family Professor, Stanford University 🌲
Senior Fellow, @hooverinstitution.bsky.social & @siepr.bsky.social
Research Associate, @nber.org
https://dee.stanford.edu/
#GoBirds 🦅
Assistant Professor @ University of Michigan's Center for the Study of Higher and Postsecondary Education. Research on High School, College & Career. CTE. Politics & Econ of Ed. Former HS teacher. He/Him.🌈
Devoted to development & use of evidence to improve educational policy, practice, & outcomes. Research Manager at Center for OBC https://obc.southerneducation.org/resources/
Associate Editor https://direct.mit.edu/edfp/issue
researchpractice.org
Associate Professor of Education Leadership & Policy | School safety and security | Online learning | High school leadership | School improvement
https://www.samanthaviano.com/