Interested in this as a way to extend my R / RShiny skills beyond the academic realm of ecology. I can't DM you but will check back for further updates!
22.04.2025 08:36 — 👍 0 🔁 0 💬 0 📌 0
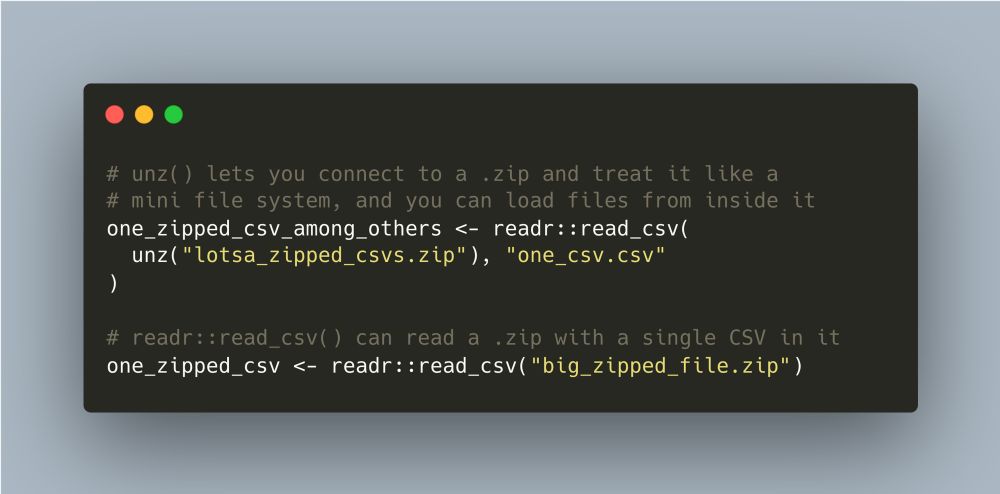
# unz() lets you connect to a .zip and treat it like a mini file system,
# and you can load files from inside it
one_zipped_csv_among_others <- readr::read_csv(
unz("lotsa_zipped_csvs.zip"), "one_csv.csv"
)
# readr::read_csv() can read a .zip with a single CSV in it
one_zipped_csv <- readr::read_csv("big_zipped_file.zip")
Thing I just learned in #rstats: unz() lets you connect to a .zip and load files from inside it without actually unzipping it (great for a file I'm working with that's 30 MB zipped and 1+ GB unzipped, with multiple CSVs in it)
18.04.2025 18:19 — 👍 232 🔁 46 💬 10 📌 3
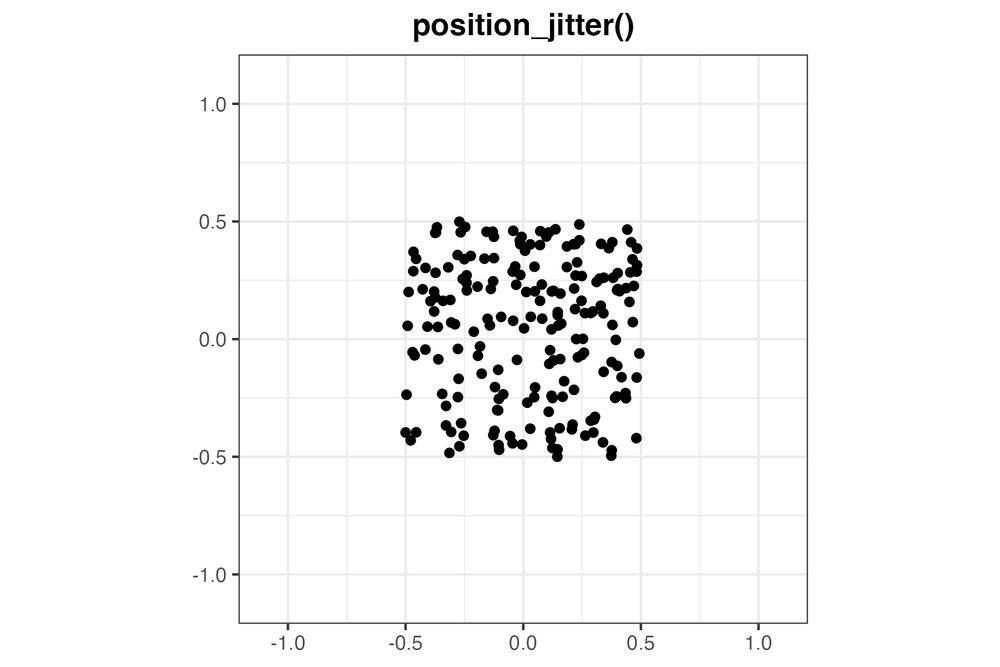
position_jitter()

position_jitter_ellipse()
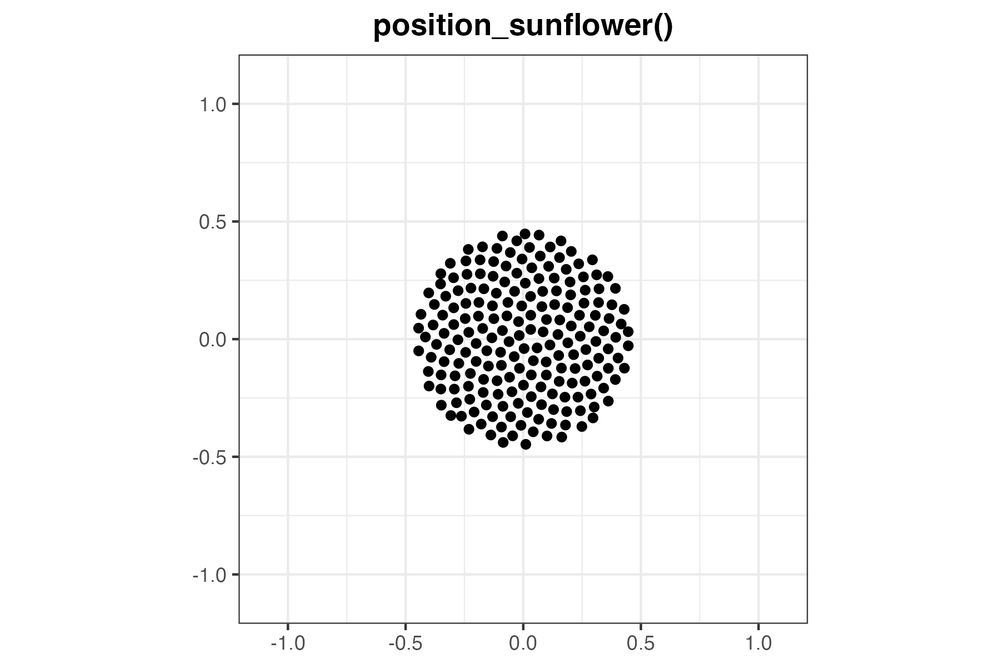
position_sunflower()

position_circlepack()
New visualization tool alert!
The vayr package version 1.0.0 is now on CRAN.
It contains position adjustments for ggplot2 that help with overplotting in pleasing ways. My favorite is position_sunflower().
- install.packages("vayr")
- alexandercoppock.com/vayr
#rstats #ggplot2 #dataviz
16.04.2025 19:53 — 👍 194 🔁 53 💬 3 📌 3

Sadiah Qureshi in conversation with David Olusoga about extinction
Manchester Histories presents an 'In Conversation' event marking the launch of 'Vanished: An Unnatural History of Extinction' (Penguin 2025)
Join @davidolusoga.bsky.social and Philip Leverhulme Prize winner @sadiahqureshi.bsky.social in conversation this June as they explore the themes of Qureshi’s powerful new book, Vanished: An Unnatural History of Extinction.
Buy your tickets here: www.eventbrite.co.uk/e/sadiah-qur...
17.04.2025 07:30 — 👍 15 🔁 9 💬 0 📌 0

The cover of a board game review in the "Books and Arts" section of the science journal, Nature. The page is mostly taken up by a large color photo of the game board, which features detailed pictures of fish cards. The title of the review is "This board game lets you dip into marine ecology".
Had a lot of fun reviewing the #boardgame #Finspan w/
@oschwery.bsky.social for @nature.com!
This fish-themed game harnesses some of my favorite aspects of #Wingspan, blending stunning art & trophic ecology with fast-paced play.
rdcu.be/eg2Dx
#Finspan by @stonemaiergames.com
10.04.2025 18:00 — 👍 63 🔁 18 💬 1 📌 0
This is fantastic! This website allows you to watch TV stations from around the world. I just watched 2 minutes of Afghan volleyball. All the small regional TV stations from Germany are here too. Spread the word! Source: tv.garden
29.03.2025 06:26 — 👍 245 🔁 90 💬 24 📌 12
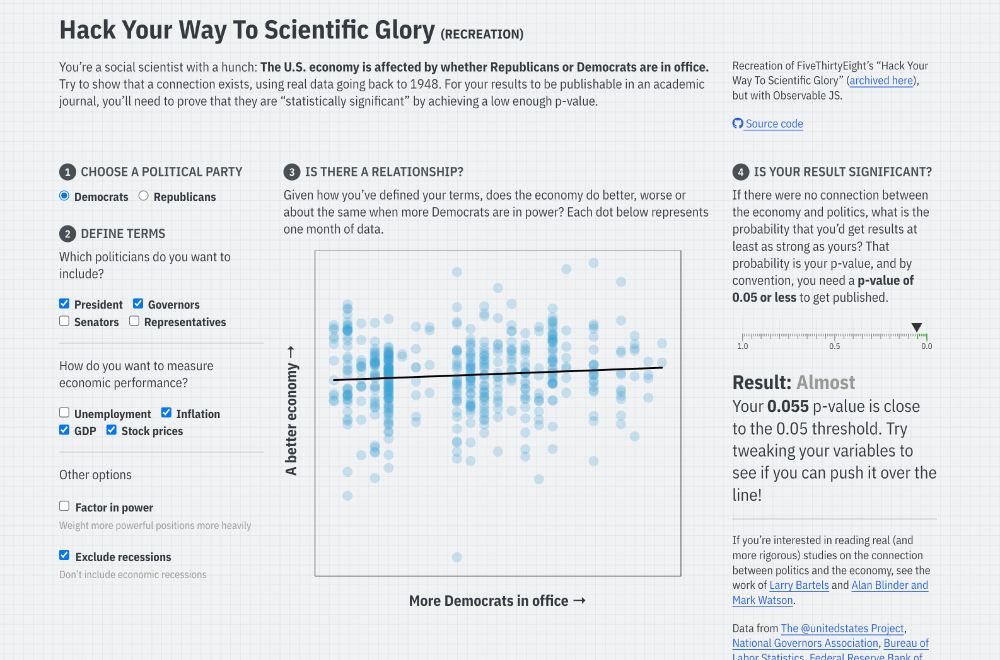
Screenshot of the linked Quarto website, with input checkboxes to change different conditions for a regression model that predicts economic performance based on US political party, with a reported p-value
I’ve long used FiveThirtyEight’s interactive “Hack Your Way To Scientific Glory” to illustrate the idea of p-hacking when I teach statistics. But ABC/Disney killed the site earlier this month :(
So I made my own with #rstats and Observable and #QuartoPub ! stats.andrewheiss.com/hack-your-way/
20.03.2025 18:30 — 👍 1468 🔁 438 💬 57 📌 29
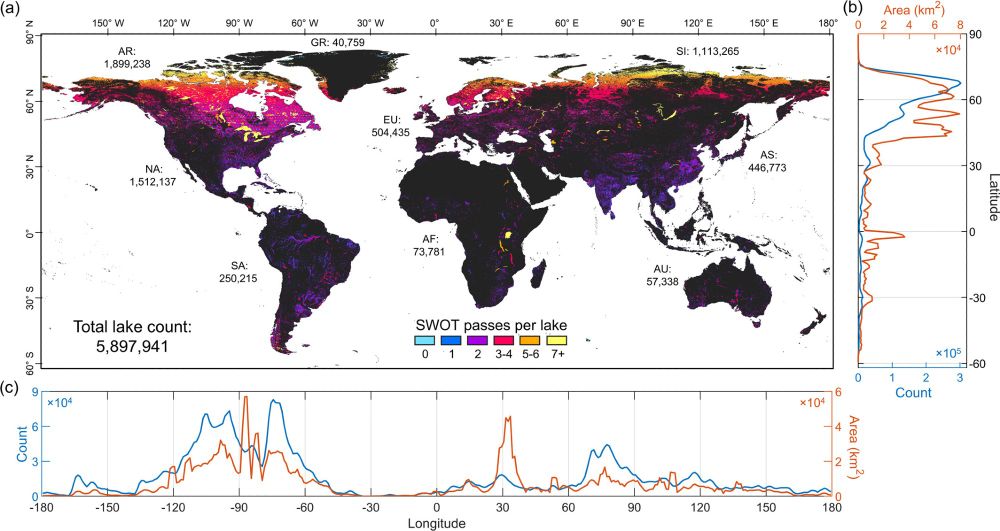
Map of global lake distribution, colored by the number of SWOT overpasses per 21 day cycle. There are many lakes with a high number of SWOT overpasses at high northern latitudes, but there are also tens of thousands to more than a million lakes on every continent. Lakes are graphed by latitude and longitude on the edges of the figure.
Do you work on lakes globally? Check out what is, to my mind, the most complete global database of lakes (~6M) and associated attributes, newly published in WRR. Also the basis for SWOT lake data. agupubs.onlinelibrary.wiley.com/doi/full/10....
19.03.2025 12:28 — 👍 97 🔁 36 💬 4 📌 0
🔎 🌍 🧪 How reliable are biodiversity trend assessments? A new paper in @ecography.bsky.social led by the amazing @wilkesma.bsky.social, reveals hidden sources of uncertainty in monitoring data and modeling choices that can dramatically alter conservation conclusions… (1/5)
🔗 bit.ly/4ibhAgq
18.03.2025 09:30 — 👍 10 🔁 8 💬 1 📌 0
Sustainable Transitions Masters plus PhD | University of Essex
The University of Essex is offering three Masters plus PhD research scholarships on our Sustainable Transitions doctoral training programme for Home / UK applicants from underrepresented groups.
More opportunities for postgraduateresearch via the @leverhulme.bsky.social #SustainableTransitions programme at University of Essex. Fully funded MSc followed by a PhD. Open to UK students meeting specific eligibility criteria. Closing 18 April. See www.essex.ac.uk/scholarships... for more details
03.02.2025 10:59 — 👍 2 🔁 3 💬 0 📌 0
Just two weeks left apply for these opportunities for unique interdisciplinary PhD research on #biodiversity funded by @leverhulme.bsky.social. Apply by 7th February!
26.01.2025 13:53 — 👍 5 🔁 2 💬 0 📌 0
Messing around with shinylive. For real, how are people not freaking out?!!
Zero hosting costs, no online requirements, no installation required, nothing not a damn thing.
#rstats #databs
09.01.2025 19:26 — 👍 44 🔁 9 💬 3 📌 0
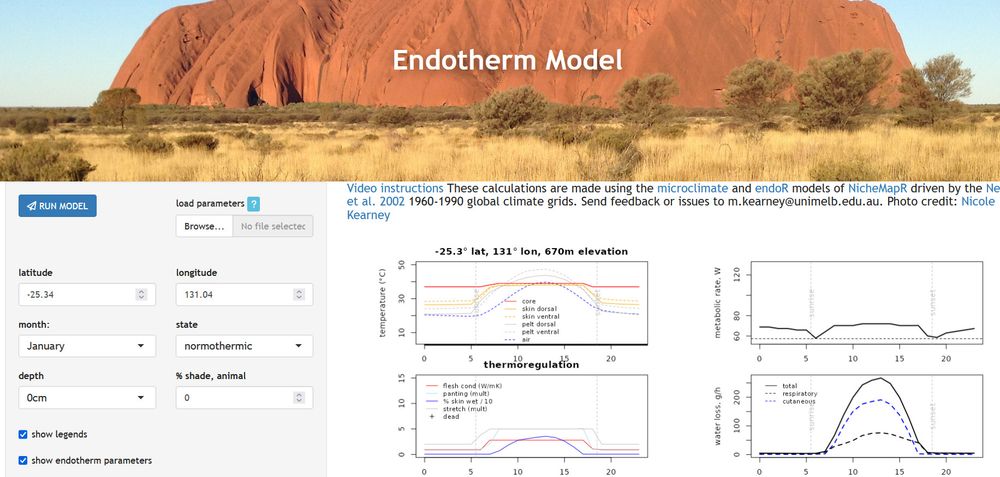
I'm happy to use my first #Bluesky post to announce that there's now a shiny app for the endotherm model of the #NicheMapR package bioforecasts.science.unimelb.edu.au/app_direct/e...
14.12.2024 05:51 — 👍 99 🔁 27 💬 0 📌 0
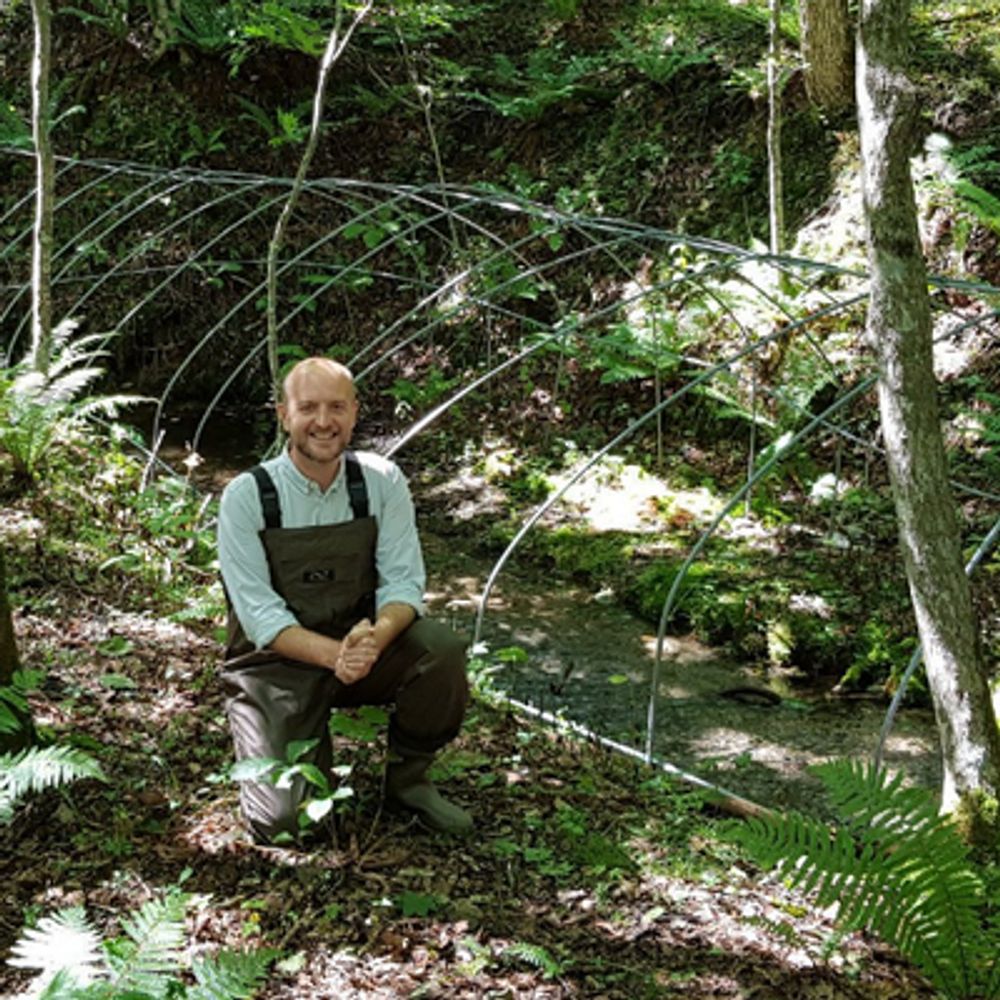
Everything you ever wanted to know to get started on #microclimate is compiled there ⬇️ in 🔟 guidelines 🤓 Unpack each 1️⃣ to select the right variable, the most relevant spatiotemporal scale, the best sampling design & to tailor your analyses to your study question
🧪🌐🍁
shorturl.at/VYP8f
17.12.2024 17:50 — 👍 52 🔁 18 💬 2 📌 0

Stunning free #science vector art for your next poster, paper or talk 🤩
The #NIH has compiled over 2,000 illustrations including swatches and pattern brushes
bioart.niaid.nih.gov
#rstats #dataviz #phd #illustration
10.12.2024 07:52 — 👍 107 🔁 30 💬 3 📌 2
How do you "become" a boomer. Asking for a friend who wants significantly cheaper housing relative to income 😂
09.12.2024 15:49 — 👍 2 🔁 0 💬 1 📌 0

This ridgeline plot and the unconventional use of shading from white to blue to indicate sea ice loss is great. It also reinforces the impression of a dense ice pack breaking up.
Chart by @janatausch.bsky.social www.ft.com/content/63fb... #dataviz
09.12.2024 11:48 — 👍 101 🔁 27 💬 3 📌 4
Could I be added please?
07.12.2024 08:24 — 👍 1 🔁 0 💬 0 📌 0
Exotic plants are better at hitchhiking upslope 🏔 than natives ⬇️ A very important result which supports former findings on exotic plants shifting and expanding their elevation ranges upslope at a rapid pace #RangeX #BioShifts 🧪🌐🌏🍁
shorturl.at/h846l
03.12.2024 17:53 — 👍 39 🔁 11 💬 2 📌 0
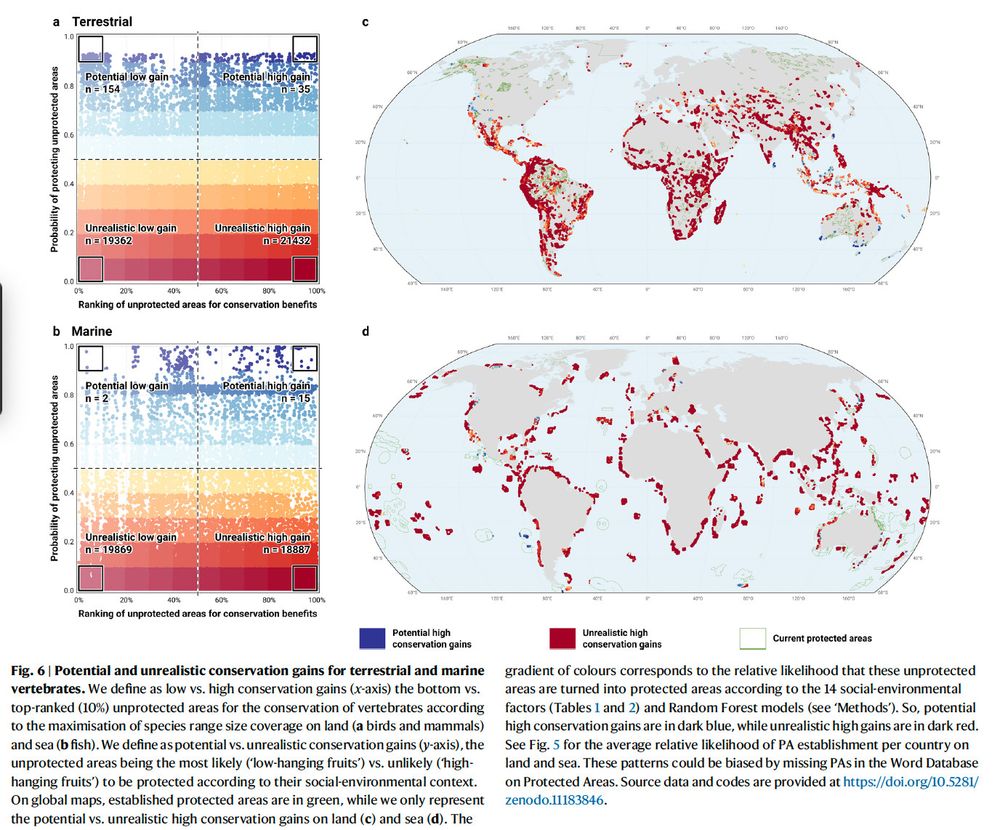
Potential and unrealistic conservation gains for terrestrial and marine
vertebrates. We define as low vs. high conservation gains (x-axis) the bottom vs.
top-ranked (10%) unprotected areas for the conservation of vertebrates according
to themaximisation of species range size coverage on land (a birds and mammals)
and sea (b fish).We define aspotential vs. unrealistic conservation gains (y-axis), the
unprotected areas being the most likely (‘low-hanging fruits’) vs. unlikely (‘highhanging
fruits’) to be protected according to their social-environmental context.
On global maps, established protected areas are in green, while we only represent
the potential vs. unrealistic high conservation gains on land (c) and sea (d). The
gradient of colours corresponds to the relative likelihood that these unprotected
areas are turned into protected areas according to the 14 social-environmental
factors (Tables 1 and 2) and Random Forest models (see ‘Methods’). So, potential
high conservation gains are in dark blue,while unrealistic high gains are in dark red.
See Fig. 5 for the average relative likelihood of PA establishment per country on
land and sea. These patterns could be biased by missing PAs in theWord Database
on Protected Areas. Source data and codes are provided at https://doi.org/10.5281/
zenodo.11183846.
The socioeconomic and environmental niches of world terrestrial and marine #ProtectedAreas
see our last study in Nat. Commun.
👉 www.nature.com/articles/s41...
🔑 We highlight ‘potential’ versus ‘unrealistic’ conservation gains on land and sea to meet global conservation targets.
🧪🌐🌍🦤🦑
04.12.2024 11:41 — 👍 49 🔁 7 💬 2 📌 1
The founder of Statistics Globe that helps you master #rstats is on BlueSky now. Give Joachim a follow ⤵️
04.12.2024 13:19 — 👍 18 🔁 4 💬 1 📌 0
Data-driven storytelling for sport. 📈
U.S. sports @optaanalystus.optajoe.com
https://www.theanalyst.com
Sign up for our Stat, Viz, Quiz football newsletter: http://theanalyst.com/sign-up
Senior Data Viz Developer @optaanalyst.optajoe.com. I draw things with code. 👨🏻💻. react/svelte + d3 💚. 🇮🇪➡️🇩🇪. Dad²
Supporting Irish businesses to assess their impacts and dependencies on nature and take action for biodiversity: businessforbiodiversity.ie
#JoinTheEvolution #ForNature #BizBioIrl
Associate Professor in Mathematics Education at Dublin City University. Chair of the Independent Advisory Committee for Ireland’s Nature Restoration plan. Former Chair of Ireland’s Citizens’ Assembly on Biodiversity Loss.
Act local, think global.
International Biodiversity Consultants Ltd (IBC) is an independent biodiversity and ecology specialist consultancy dedicated to conserving and enhancing our environment with experience worldwide. Link: https://linktr.ee/ibioconsultants
Academic at the University of Leeds, working on #ecology, #evolution, #entomology, #education. Views my own. He/him.
Ecologist (restoration, ecosystem assessment, beaver-nerd, water policy), botanist, birder, hill walker. No pictures of cats (dogs a different matter). YNWA.
Prof. Freshwater Science, University of Stirling. Associate Dean Research, Natural Sciences.
PhD
Research assistant at Institut Botanic de Barcelona
@ibb-botanic.bsky.social
I am interested in #insect #evolution and #biogeography, islands, and diversification dynamics.
#entomology #taxonomy
Researching land-use change & how it impacts biodiversity at
Humboldt-Universität zu Berlin
Seeking to support biodiversity conservation.
Posts by
@tkuemmerle.bsky.social & team (check out our starterpack).
hu.berlin/biogeo
SnakeEvolution.org
https://discord.gg/QpBQthS3TZ
The International Biogeography Society. Fostering collaboration, awareness of & education in biogeography, for the study & conservation of the world's biota.
https://www.biogeography.org/
🌐 http://www.biogeography-usc.org
⚙️ A. Baselga & C. Gómez-Rodríguez
Unified Models of Biological Diversity | Beta Diversity | Distance-Decay | Beetles | betapart (R)
CRETUS
Universidade de Santiago de Compostela
macroecologist, biogeographer, tropical ecologist. head of @BioGeoMacro lab @uniGoettingen.
Evolution, phylogenetics, biogeography, epidemiology, computational biology, statistical models, machine learning, scientific software — 🌵🕰️🌎🎲🖥️📈 — https://landislab.org
Science: ENMTools, RWTY, general eco-evo quant stuff.
Music: Hypnospace Outlaw, Frog Fractions 2 ARG, Son of Strelka, The Scientist, Evergreen, Waldeinsamkeit.
https://linktr.ee/danlwarren
Biodiversity Scientist, Professor, Ant Radiologist @ U Maryland and @OIST
https://arilab.unit.oist.jp/
Ramón y Cajal Researcher @ Real Jardín Botánico (RJB-CSIC) | Earlier @ IBB (CSIC-CMCNB), CBGP (UPM-INIA/CSIC) & Royal Botanic Gardens, Kew | Duke University & UAM alumna | #Biogeography #Evolution #Phylogenomics #Plants #Systematics
researcher at Museo Argentino de Ciencias Naturales, CONICET • spider nerd • taxonomy, systematics, biogeography • he/él • views my own • 🇧🇷🇦🇷
This is the official account of the Society of Island Biology (SIB). For more information go to https://islandbiology.com/.
Associate Professor at University of Santiago de Compostela (Spain) - Interested in beetles, biogeography and macroecology
Santiago de Compostela. Web: http://biogeography-usc.org/


![Snake Evolution and Biogeography [SEB]](https://cdn.bsky.app/img/avatar/plain/did:plc:qrvkldtoehnm65iqdykjvwhb/bafkreifyvgzgdwojapne3geatqzva44lcn2hcxca5edbbq5cpfivxrym74@jpeg)