Hi Gregg, to add more map Layers you need to drag a new or duplicate Makepoint calculation onto the visualisation pane.
If stuck, I wrote a 3 post blog series for Biztory on getting started with Map Layers, here: www.biztory.com/blog/tableau...

@sparsonsdataviz.bsky.social
Tableau Visionary
Hi Gregg, to add more map Layers you need to drag a new or duplicate Makepoint calculation onto the visualisation pane.
If stuck, I wrote a 3 post blog series for Biztory on getting started with Map Layers, here: www.biztory.com/blog/tableau...
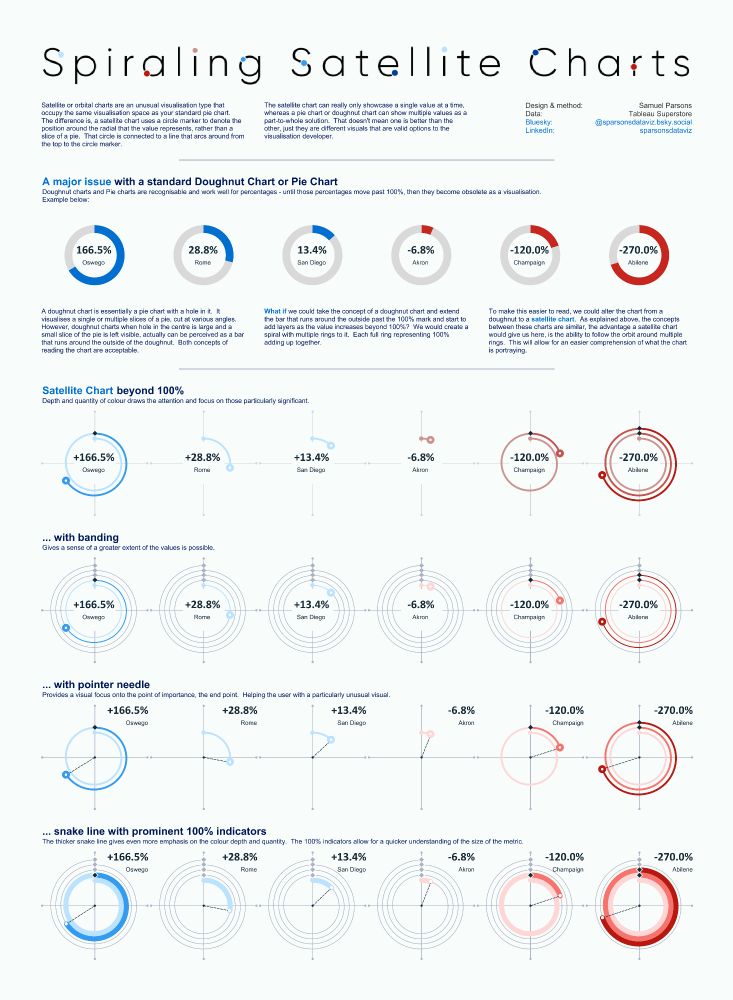
Spiraling Satellite Charts
New visualisation using Tableau! What can you do if your pie / doughnut chart %s go beyond 100%? Try a spiraling satellite chart!
Link: lnkd.in/eKMcmR5j
Great work Darragh!
14.01.2025 21:02 — 👍 1 🔁 0 💬 1 📌 0
🚨I'm hiring!🚨
Based in: India
Role: Senior Data Visualization Analyst
Come work for me in my Data Viz team at Amex GBT! If you are interested, the link is below. It is critical you share your dashboard portfolio in the application.
Job details: travelhrportal.wd1.myworkdayjobs.com/Jobs/job/Gur...

Second day in a new job, first day in a new office! It has been super insightful so far.
07.01.2025 14:32 — 👍 5 🔁 0 💬 0 📌 0You are welcome!
05.12.2024 12:57 — 👍 1 🔁 0 💬 0 📌 0#datafam Tableau
I have been waiting for this blog trilogy on getting started with Tableau Map Layers to land and then found it was already published 2 months ago!!
Anyway, it's still relevant and I hope they help someone!
Blog 1: lnkd.in/eQSf8jW3
Blog 2: lnkd.in/e2_g6yh3
Blog 3: lnkd.in/e2kZ-WKg
I couldn't find it yesterday, but I have just now. I saw it from Jorge Camoes Medium blog post: medium.com/visualizing-...
29.11.2024 23:58 — 👍 2 🔁 0 💬 1 📌 0I'm moving out! I'll comeback once the hit 20!
28.11.2024 22:08 — 👍 1 🔁 0 💬 1 📌 0Absolutely, my eldest is 11, turning 12 soon. So I think I'm on my way out of the 'golden age' and so find it difficult now.
28.11.2024 22:02 — 👍 1 🔁 0 💬 1 📌 0I find it more and more difficult as my kids grow up. They stay up longer in the evening before going to bed, and so they start eating into "my" time and I find I have less time to do the stuff I want to do as a consequence. It's become an effort for sure.
28.11.2024 21:33 — 👍 1 🔁 0 💬 1 📌 0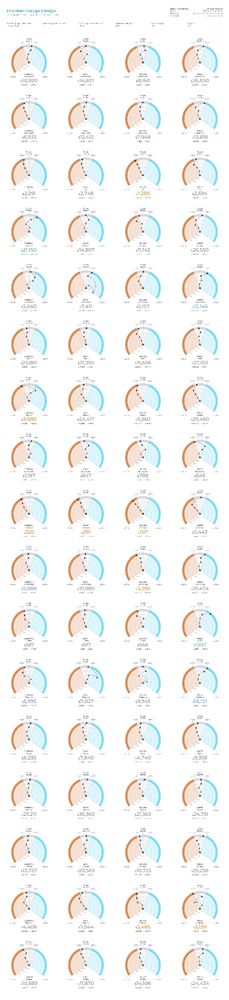
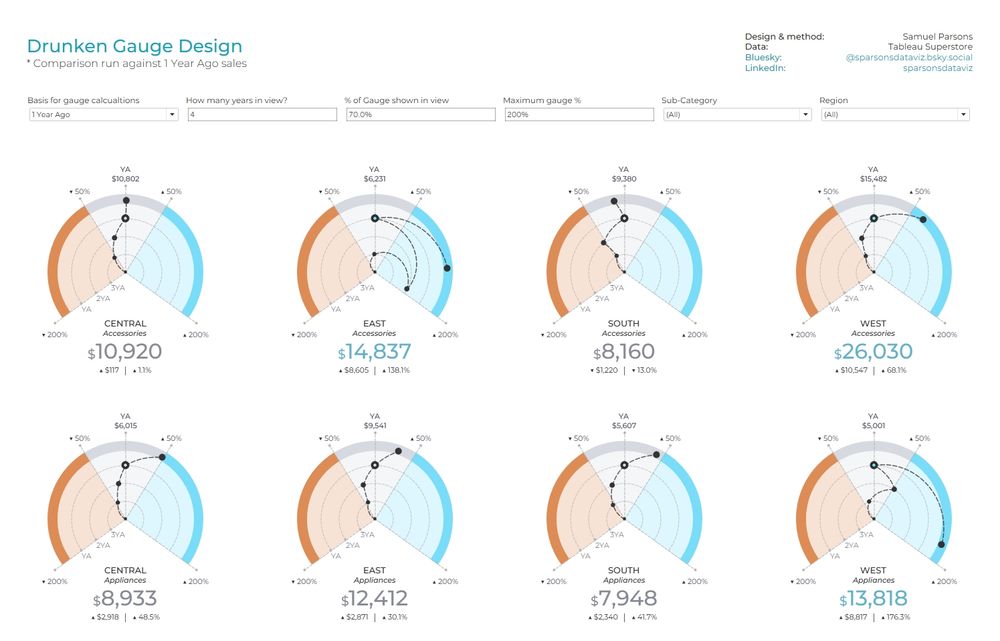
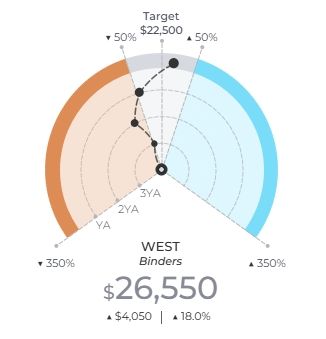
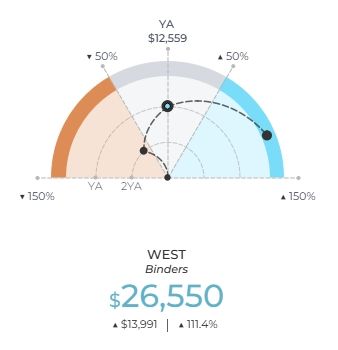
Drunken Gauge / Speedometer Charts
I've wanted to build one for a while now!
They are niche in their use case and I wouldn't recommend as the go to KPI visual, but they are fun and tell a story.
Now published to my Tableau Public site (link below).
Link: lnkd.in/ezbsfduj
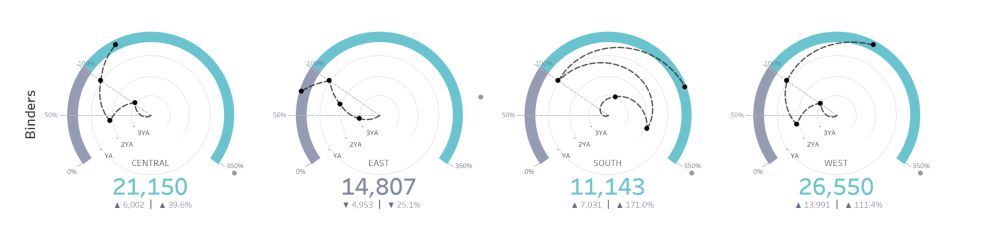
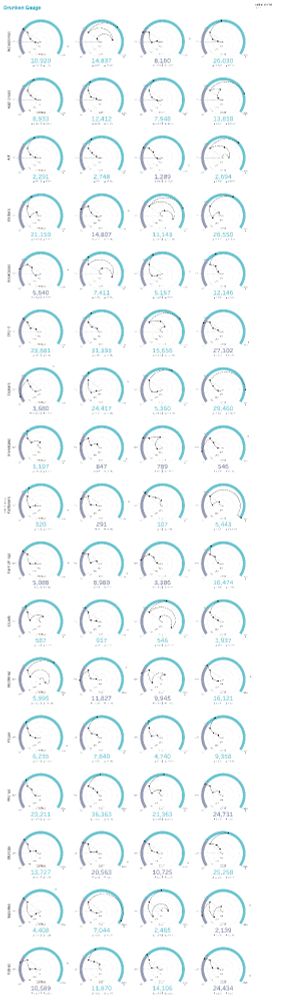
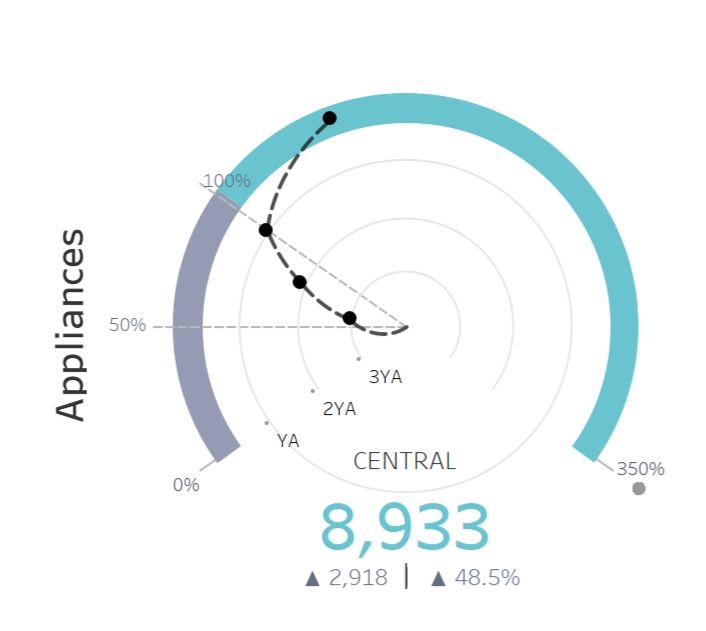
Trying a bit of fun for a Friday and I can't even blame the drink for these Drunken Gauge Charts! 😅
Still a work in progress, but I'm getting there.
#Tableau
Where was this! I want one!
12.11.2024 09:47 — 👍 0 🔁 0 💬 0 📌 0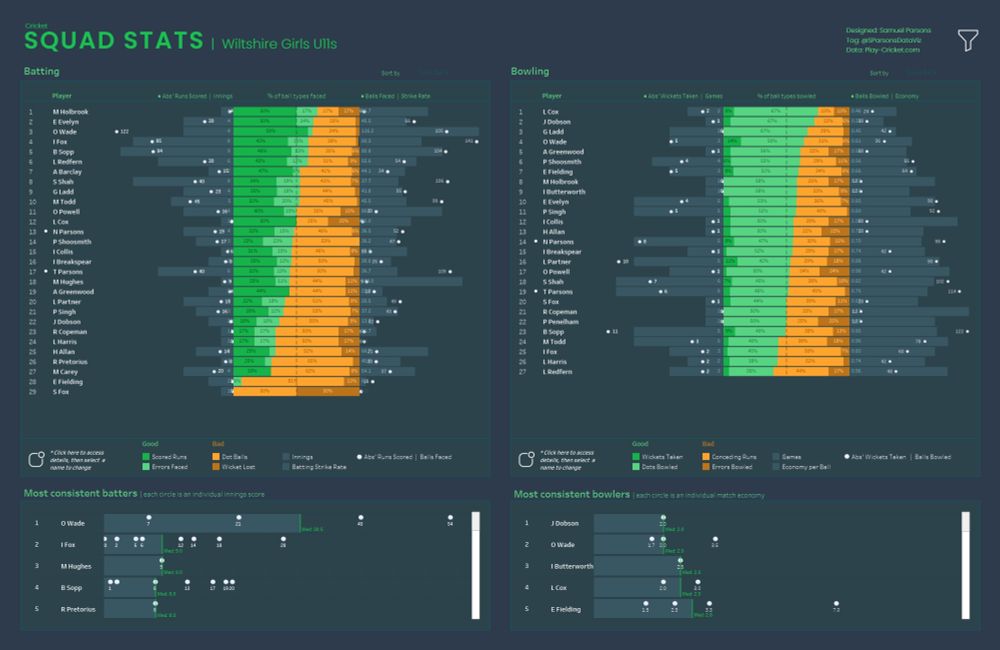
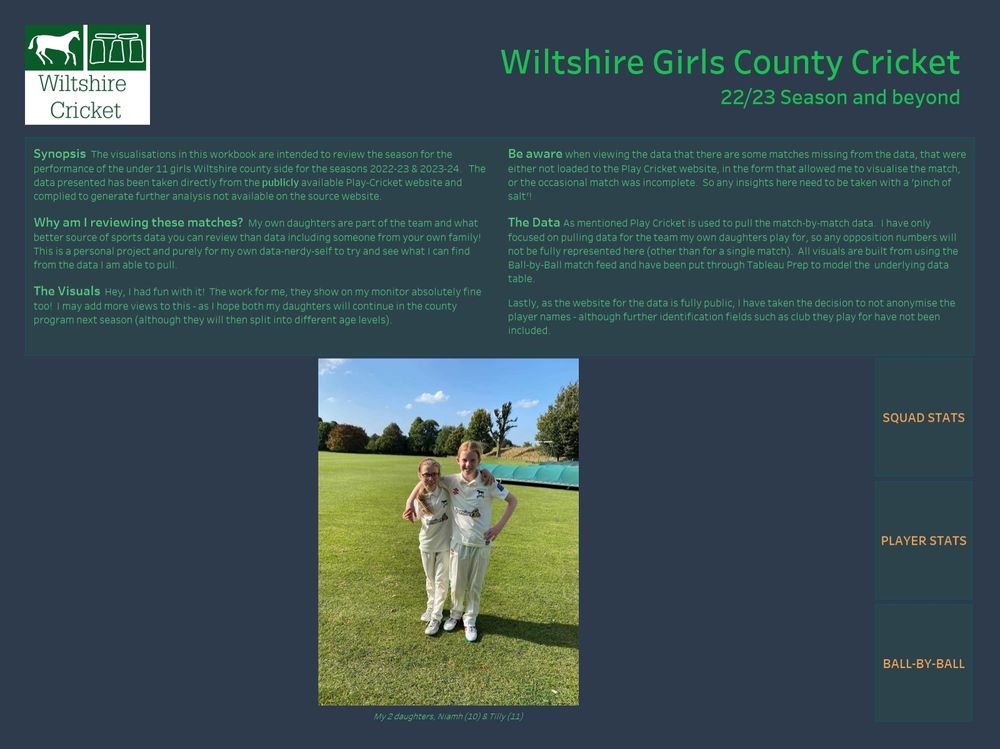
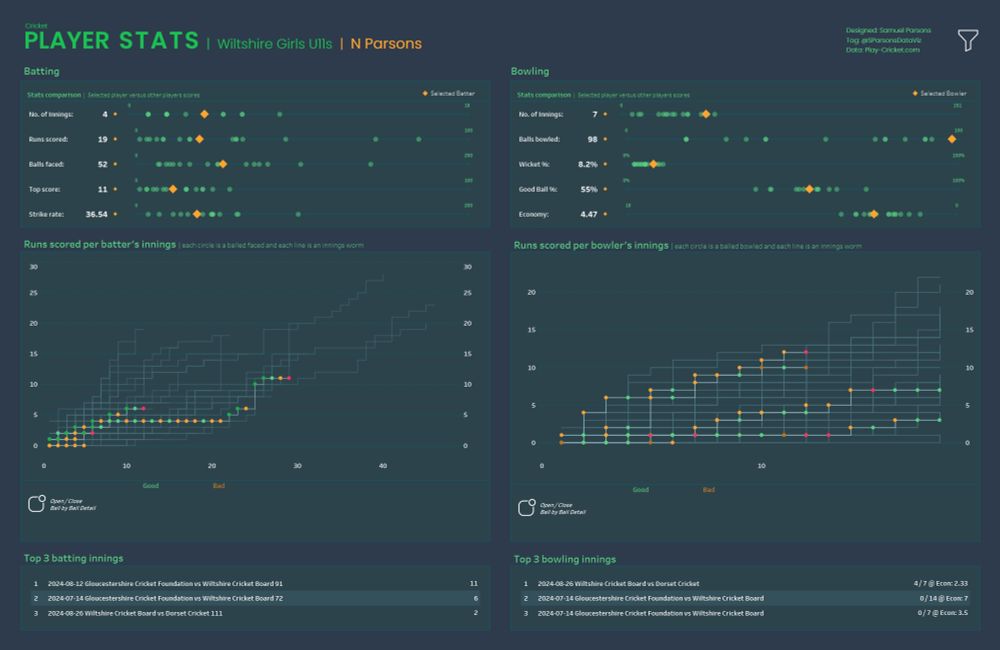
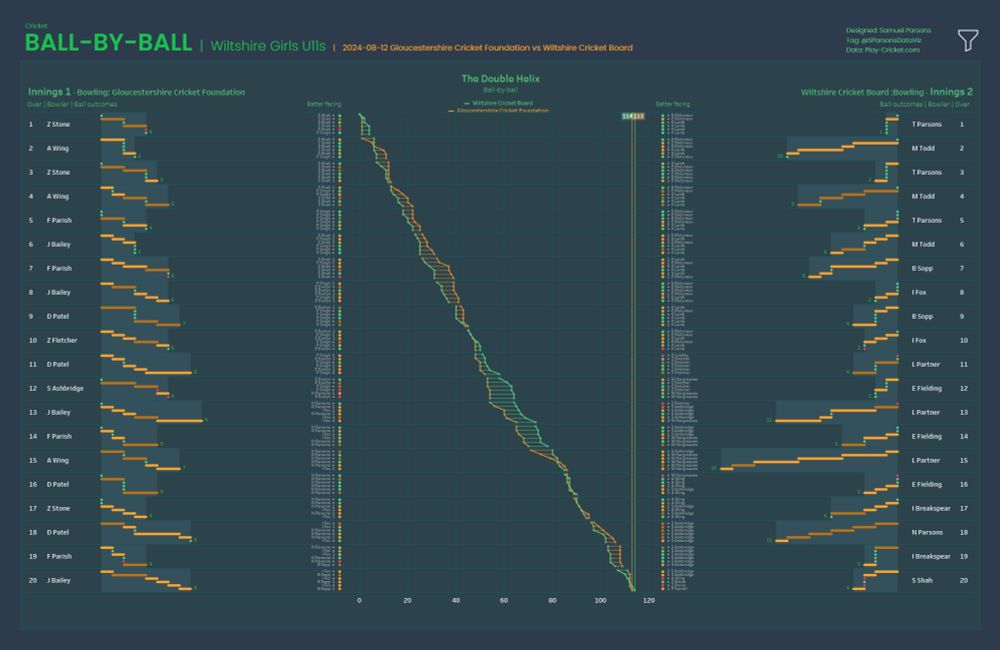
New viz - this is a personal project for me.
WILTSHIRE GIRLS COUNTY CRICKET
My 2 daughters have been playing county cricket for the last couple of seasons and I have pulled the data of the matches for their team and visualised it!
Link: tinyurl.com/ym7eznwb
We have been loving this quiz at work and my kids love playing with it too!
04.09.2024 08:13 — 👍 3 🔁 0 💬 0 📌 0Nice work Nicola! I particularly liked 4. About alternatives to Dual Axis. The intersection between two lines and the potential interpretation is something I am often guilty of overlooking.
04.09.2024 08:06 — 👍 1 🔁 0 💬 0 📌 0