Woman standing in front of a wall of PhD theses
🎓✨ Join Frida Bengtsson’s PhD defence!
In her thesis, Frida explores how voluntary collective action and stewardship can help shape more sustainable fisheries governance.
📅 16 Sept 2025
🕐 13:00 CEST
📍 Hörsal 2, Hus 2, Campus Albano, Stockholm
💻 Or online: stockholmuniversity.zoom.us/j/69192718789
05.09.2025 12:47 — 👍 7 🔁 2 💬 0 📌 0

A new study finds that 50 percent of the freshwater required for soy and beef exports to the EU rely on river basins in Brazil with high or critical water scarcity.
Read more what co-author Lan Wang Erlandsson has to say about the implications --> www.stockholmresilience.org/research/res...
27.08.2025 10:16 — 👍 13 🔁 7 💬 1 📌 0

A line graph shows the time series of global mean surface temperature anomalies for each May-June-July from 1850 through 2025. There is a long-term increasing trend and large year-to-year variability. The mean surface temperature anomaly in May-July 2025 was 1.03°C globally. Anomalies are computed relative to a 1901-2000 climate baseline. All data is from NOAA/NESDIS/NCEI NOAAGlobalTemp v6.0.0 on this graphic.
The average global temperature anomaly for every May-July period since the year 1850. As expected, 2025 will not set a new record for the annual mean metric.
Data provided by @noaa.gov NOAAGlobalTemp v6.0.0 (www.ncei.noaa.gov/products/lan...).
27.08.2025 11:53 — 👍 57 🔁 21 💬 3 📌 1

A wide angle photo of the Chief Sequoia tree in California reach up into the mostly blue sky overhead, and dwarfing the other nearby trees.

A wide angle photo of the McKinley tree in California reach up into the mostly blue sky overhead, and dwarfing the other nearby trees.
Two legendary Sequoias of the Giant Forest: Chief Sequoia (left), the 9th largest tree in the grove and the 27th largest in the world, and 291-ft-tall McKinley (right), named after the 25th President of the United States.
27.08.2025 19:09 — 👍 82 🔁 13 💬 3 📌 0
One way of visualizing the variability and multidecadal decline of July #Arctic sea-ice thickness and sea-ice volume through 2025...
+ Data information (PIOMAS): climatedataguide.ucar.edu/climate-data...
27.08.2025 19:53 — 👍 97 🔁 39 💬 0 📌 0
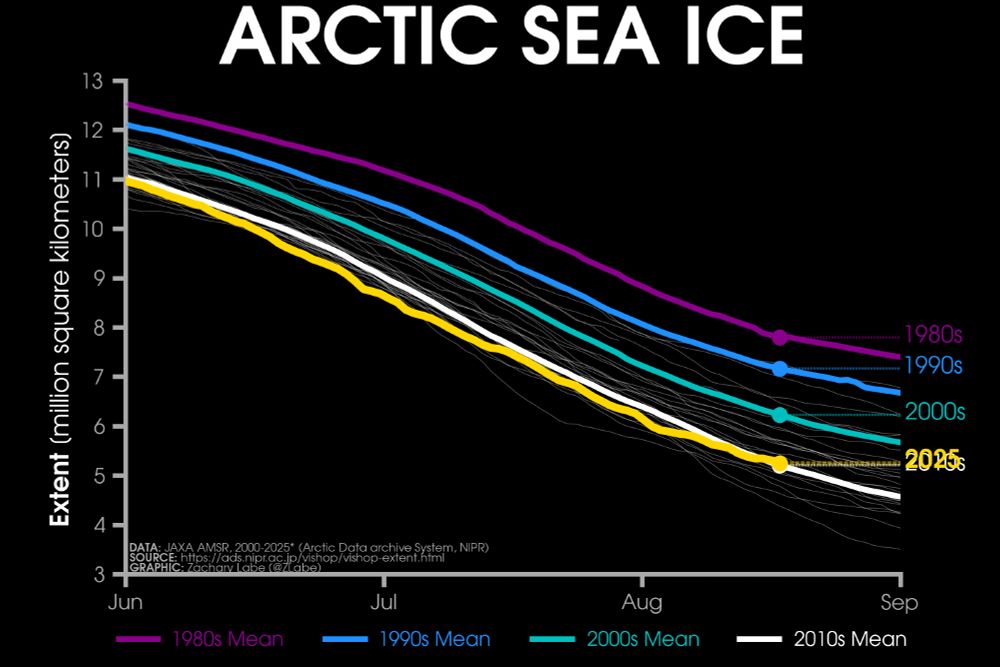
Line graph time series of 2025's daily Arctic sea ice extent compared to decadal averages from the 1980s to the 2010s. The decadal averages are shown with different colored lines with purple for the 1980s, blue for the 1990s, green for the 2000s, and white for the 2010s. Thin white lines are also shown for each year from 2000 to 2024. 2025 is shown with a thick gold line. There is a long-term decreasing trend in ice extent for every day of the year shown on this graph between June and September by looking at the decadal average line positions.
Monday ice update - #Arctic sea ice extent is currently the 11th lowest on record (JAXA data) 🧪🌊
• about 50,000 km² above the 2010s mean
• about 980,000 km² below the 2000s mean
• about 1,920,000 km² below the 1990s mean
• about 2,550,000 km² below the 1980s mean
More: zacklabe.com/arctic-sea-i...
19.08.2025 00:24 — 👍 98 🔁 31 💬 2 📌 0

A photo of a large golden sand dune encompassing the bottom left half of the image, with snow-capped mountains and blue stormy skies in the distance.
Sand
& Snow
& Storms.
19.08.2025 03:09 — 👍 170 🔁 10 💬 3 📌 1
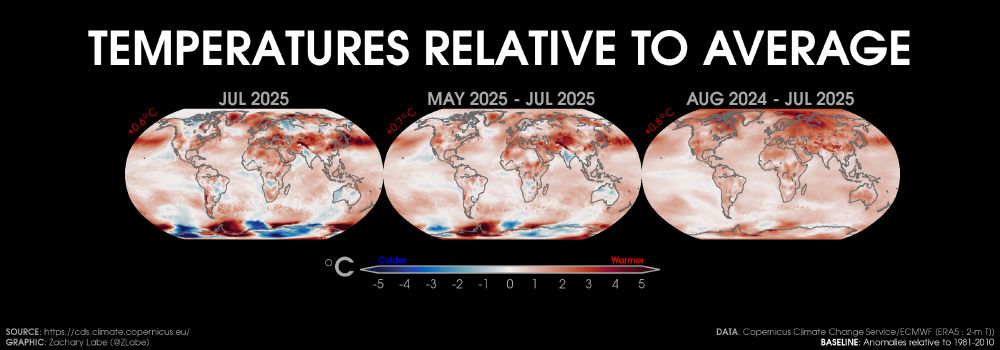
Three Robinson projection maps showing 2-m air temperature anomalies in July 2025, May 2025 to July 2025, and August 2024 to July 2025 across the globe. Red shading is shown for warmer anomalies, and blue shading is shown for colder anomalies. Most areas are warmer than average. The mean global near-surface air temperature anomaly for each map is also displayed in the upper-left corner. Anomalies are calculated relative to a 1981-2010 baseline. Data is from ERA5 reanalysis using the 2-m air temperature variable.
Temperature anomalies (departure from average) around our planet for the last month (left), 3 months (center), and 12 months (right)... note the band of warmth across the Northern Hemisphere midlatitudes.
Data from doi.org/10.24381/cds...
11.08.2025 11:33 — 👍 90 🔁 33 💬 1 📌 1
What the Arctic Teaches Us About the Climate Crisis: A Conversation with Dr. Zachary Labe
From weather blogs to world-class graphics, a leading young climate scientist helps us visualize a planet in flux.
What the Arctic Teaches Us About the Climate Crisis: A Conversation with Dr. Zachary Labe - chrisgloninger.substack.com/p/what-the-a...
(many thanks for the awesome conversation and article @climatechris.bsky.social, @davidthoreson.bsky.social, and @channingdutton.bsky.social)
11.08.2025 20:51 — 👍 95 🔁 24 💬 2 📌 2
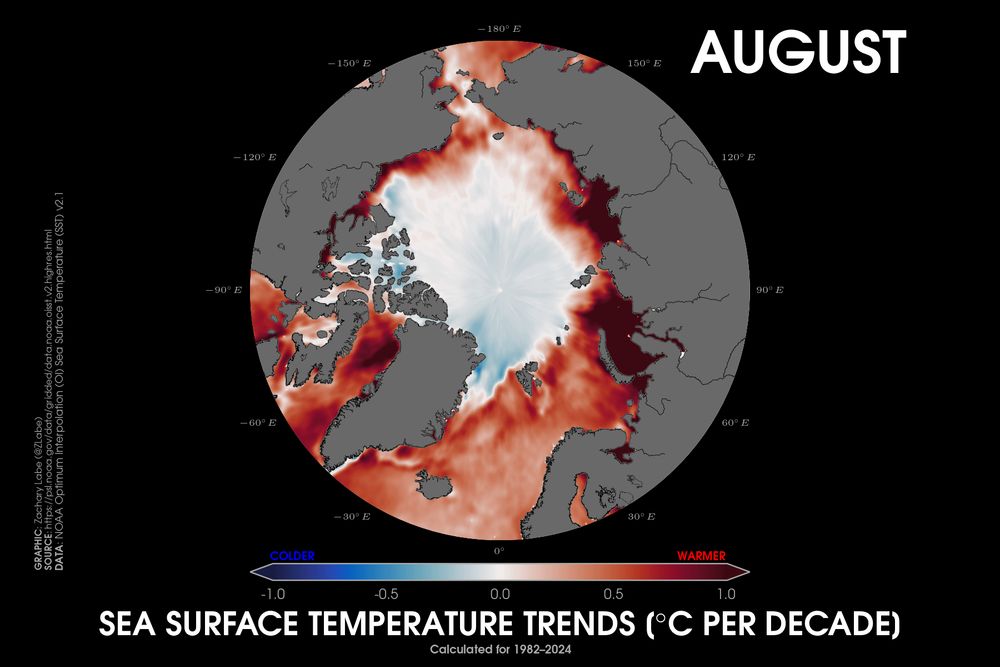
Polar stereographic map of sea surface temperature trends for Augusts from 1979 to 2024. Red shading is shown for warming trends, and blue shading is shown for cooling trends. All areas of the ocean are observing warming.
Quick look at August sea surface temperature trends across the #Arctic, which are warming nearly everywhere that sea ice is not found. We'll have an update on this in our next Arctic Report Card, which will be released in December 2025.
Last year's summary: arctic.noaa.gov/report-card/...
09.08.2025 14:37 — 👍 90 🔁 25 💬 0 📌 3

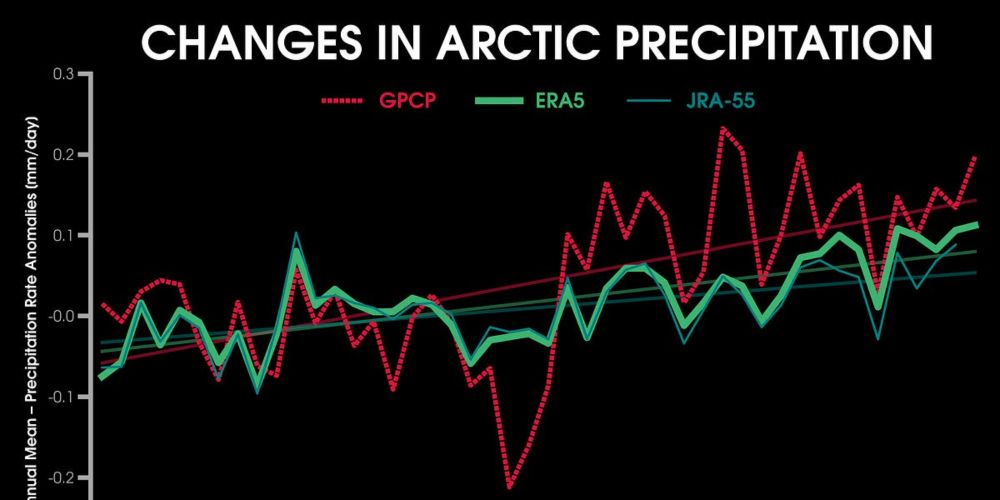
Polar stereographic map showing August precipitation trends over the period of 1979 to 2024. Nearly all areas are getting wetter across the Arctic in this month. Data is from GPCP.
Much of the #Arctic Ocean region is also getting wetter in the month of August, as estimated by GPCP. The largest trends are found in the Barents-Kara Seas region, which correlates with warmer SSTs and less sea ice.
Data psl.noaa.gov/data/gridded...
Info arctic.noaa.gov/report-card/...
05.08.2025 12:40 — 👍 50 🔁 19 💬 1 📌 1
This is your final week to make it count for butterflies! 🦋
Butterfly Conservation Vice President and wildlife presenter Mike Dilger is on the lookout for Marbled Whites, Ringlets and Gatekeepers.
What species are you hoping to see during your #BigButterflyCount? 👀
05.08.2025 14:36 — 👍 23 🔁 16 💬 3 📌 1
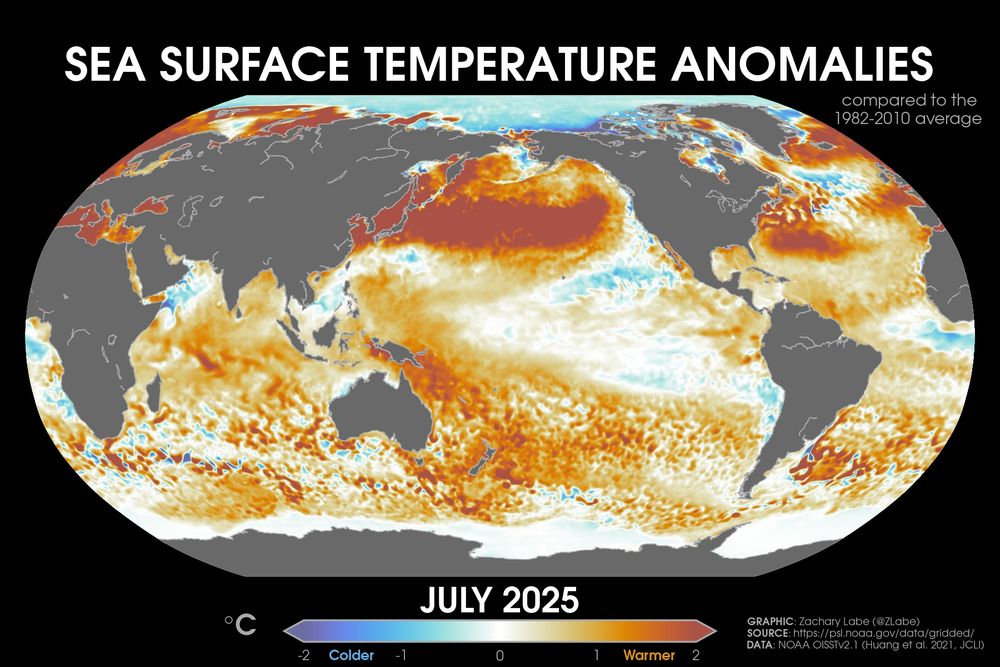
Global map showing sea surface temperature anomalies in July 2025 relative to 1982 to 2010. Most areas are warmer than average. Red is shown for warmer sea surface temperatures, and blue is shown for colder sea surface temperatures. Data is from NOAA OISSTv2.1.
Woah, the hot spot across the northern Pacific is even more prominent in last month's sea surface temperature map. This is really quite striking! Though the extratropics in both hemispheres are warmer than average too.
Data from @noaa.gov OISSTv2.1 at www.ncei.noaa.gov/products/opt...
05.08.2025 00:52 — 👍 839 🔁 292 💬 42 📌 27
Last month was the 3rd lowest #Antarctic sea ice extent on record for the month of July.
This was 1,130,000 km² below the 1981-2010 July average. Data from the nsidc.org/data/seaice_...
04.08.2025 12:11 — 👍 80 🔁 36 💬 3 📌 3
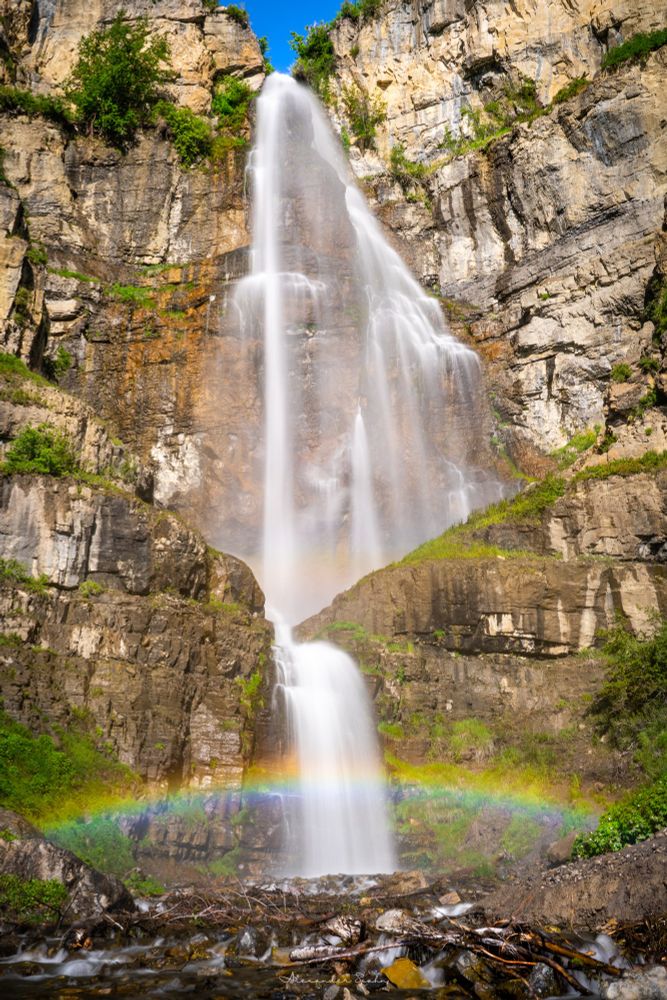
A towering white waterfall cascading over a steep rocky cliff with multiple levels. A vibrant rainbow shines at its base.
#ActuallyDoGoChasingWaterfalls
03.08.2025 23:13 — 👍 199 🔁 24 💬 7 📌 1
Gorgeous ❤️
04.08.2025 18:19 — 👍 1 🔁 0 💬 0 📌 0

The Luminance of My Blues
Shot on Canon and Sigma
ISO 400 • 1/400 • f/8.0 • 600 mm
Copyright © 2025 Revieshan
The Luminance of My Blues
#SaveButterflies #ButterflyWorld #PlanetButterfly #RoamThePlanet #VisualsOfEarth #EarthFocus #WildlifePhotography #WildlifeConservation #NatuurFotografie #NaturePhotography #ClimateResilience #ShowYourStripes #CanonNordic #ShareMySigma
@savebutterflies.bsky.social
04.08.2025 18:09 — 👍 13 🔁 7 💬 2 📌 0
"The first principle is that you must not fool yourself—and you are the easiest person to fool.” — Richard Feynman
31.07.2025 04:46 — 👍 416 🔁 85 💬 5 📌 2

Star trails seen in a gap between the tops of leafy trees.
Through the treetops.
Durham Bridge NB
July 29-30, 2025 – 11:14pm to 3:54am
#startrails #astrophotography
30.07.2025 23:51 — 👍 18 🔁 3 💬 0 📌 0
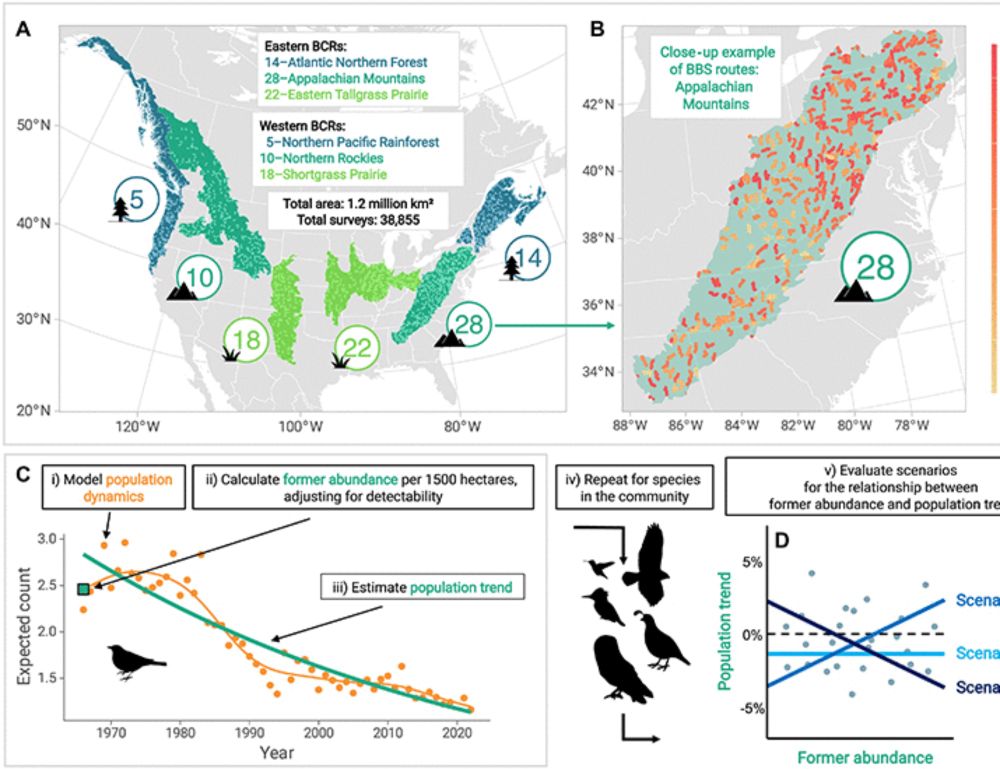
North American bird declines are driven by reductions in common species
Declines in North American birds are driven not by rare species vanishing but by sharp losses among formerly common species.
🚨 First PhD chapter is out! My work thus far, with @andy2dobson.bsky.social
We found that formerly common species have declined the fastest, on average.
📄 North American bird declines are driven by reductions in common species | Science Advances www.science.org/doi/10.1126/...
31.07.2025 03:18 — 👍 165 🔁 88 💬 3 📌 3
Check out @climatecentral.org's new interactive tools for monitoring ocean heat around the world: www.climatecentral.org/climate-matt...
Using the Ocean CSI system, you can find the influence of human-caused climate change on daily sea surface temperatures and around the paths of tropical cyclones.
31.07.2025 12:27 — 👍 177 🔁 68 💬 4 📌 7

Anna's hummingbird looking at the camera. Its gorget is well-lit, reflecting deep pinks toward to viewer. The bird is perched on a tiny twig with some small leaves on the bottom of the image. The background is a smooth tan color, blurred out by a bokeh effect.
👋 Hi, I’m Gates!
🐅 PhD Candidate at Princeton University
📉 Studying emergent patterns of biodiversity loss
🦢 Currently working on birds, previously on snow leopards!
I especially love talking stats, rare orchids, complex systems, photography, & big cats!
Say hi if you’re into nature or numbers! 😊
15.11.2024 04:16 — 👍 15 🔁 2 💬 1 📌 0
One of those nights…
31.07.2025 05:33 — 👍 629 🔁 84 💬 7 📌 3
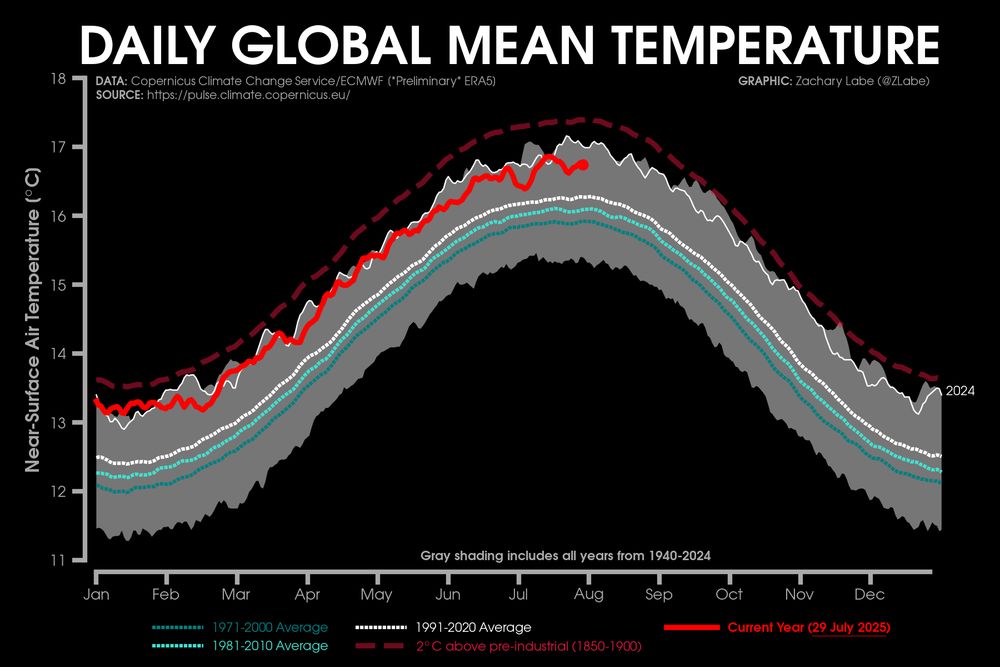
Graph showing daily global mean near-surface air temperatures for 2025. This is also compared to the daily data from the 1971-2000 average, 1981-2010 average, and 1991-2020 average. Annotations are also shown to the current year with the other years from 1940 to 2024 and a threshold of 2°C above the 1850-1900 pre-industrial level. There is a strong seasonal cycle, with a peak during the boreal summer season. There is a long-term warming trend. 2024 is also indicated, which was the warmest year on record. Data is from ECMWF ERA5 reanalysis and updated through 29 July 2025
We are now at the climatological warmest time of year for the average global temperature. While there will be no new absolute records this year for the annual maximum, our planet remains much warmer than any previous decade in our records. 🤒
Graphic from zacklabe.com/climate-chan...
31.07.2025 14:24 — 👍 119 🔁 43 💬 5 📌 2
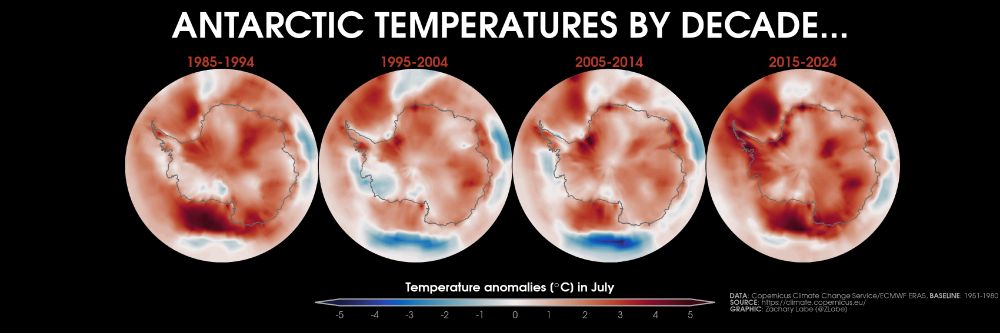
Four polar stereographic maps showing Antarctic near-surface air temperature anomalies for the month of July in 1985-1994, 1995-2004, 2005-2014, and 2015-2024. There is substantial regional variability.
A look at temperature departures for each of the last 4 decades across the #Antarctic. Lots of spatial variability by region this time of year.
Data from doi.org/10.24381/cds... and uses a 1951-1980 reference period for the anomalies.
31.07.2025 18:50 — 👍 42 🔁 19 💬 0 📌 1
Three years ago today I completed my first 14er with Pike's Peak! Here's a video of my descent along the boulder scramble near the summit, where ankles go to get sprained.
27.07.2025 19:15 — 👍 299 🔁 21 💬 17 📌 1
U ever just watch a couple birds fly by and think to yourself, "damn, I'm lucky to exist in such a beautiful world?" Because same.
24.07.2025 17:23 — 👍 135 🔁 12 💬 8 📌 0

Line graph time series of daily mean Arctic sea ice volume for each year from 1979 to 2025 using shades of red, white and blue. A seasonal cycle is shown with thicker ice in late winter and thinner ice in late summer. A long-term decreasing trend is also visible. Data is from PIOMAS v2.1.

Line graph time series of daily mean Arctic sea ice thickness for each year from 1979 to 2025 using shades of red, white and blue. A seasonal cycle is shown with thicker ice in late winter and thinner ice in late summer. A long-term decreasing trend is also visible. Data is from PIOMAS v2.1.
A comparison of daily #Arctic sea ice thickness and volume. Each line represents one year from 1979 [dark blue] to 2024 [dark red]. This year is shown in yellow - now updated through June 2025 (summer melt season)
More graphics of thickness and volume: zacklabe.com/arctic-sea-i...
22.07.2025 12:11 — 👍 66 🔁 30 💬 1 📌 1